University of Windsor University of Windsor
Scholarship at UWindsor
Scholarship at UWindsor
Electronic Theses and Dissertations Theses, Dissertations, and Major Papers
2008
Modeling, control, and implementation of enhanced premixed
Modeling, control, and implementation of enhanced premixed
combustion in diesel engines
combustion in diesel engines
Raj Kumar
University of Windsor
Follow this and additional works at: https://scholar.uwindsor.ca/etd
Recommended Citation Recommended Citation
Kumar, Raj, "Modeling, control, and implementation of enhanced premixed combustion in diesel engines" (2008). Electronic Theses and Dissertations. 8056.
https://scholar.uwindsor.ca/etd/8056
This online database contains the full-text of PhD dissertations and Masters’ theses of University of Windsor students from 1954 forward. These documents are made available for personal study and research purposes only, in accordance with the Canadian Copyright Act and the Creative Commons license—CC BY-NC-ND (Attribution, Non-Commercial, No Derivative Works). Under this license, works must always be attributed to the copyright holder (original author), cannot be used for any commercial purposes, and may not be altered. Any other use would require the permission of the copyright holder. Students may inquire about withdrawing their dissertation and/or thesis from this database. For additional inquiries, please contact the repository administrator via email
MODELING, CONTROL, AND IMPLEMENTATION OF
ENHANCED PREMIXED COMBUSTION IN DIESEL ENGINES
by Raj Kumar
A Dissertation
Submitted to the Faculty of Graduate Studies
through Mechanical, Automotive and Materials Engineering in Partial Fulfillment of the Requirements for
the Degree of Doctor of Philosophy at the University of Windsor
Windsor, Ontario, Canada
2008
1*1
Library and Archives CanadaPublished Heritage Branch
395 Wellington Street OttawaONK1A0N4 Canada
Bibliotheque et Archives Canada Direction du
Patrimoine de I'edition 395, rue Wellington OttawaONK1A0N4 Canada
Your file Votre reference ISBN: 978-0-494-80246-5 Our file Notre reference ISBN: 978-0-494-80246-5
NOTICE: AVIS:
The author has granted a
non-exclusive license allowing Library and Archives Canada to reproduce, publish, archive, preserve, conserve, communicate to the public by
telecommunication or on the Internet, loan, distribute and sell theses
worldwide, for commercial or non-commercial purposes, in microform, paper, electronic and/or any other formats.
L'auteur a accorde une licence non exclusive permettant a la Bibliotheque et Archives Canada de reproduire, publier, archiver, sauvegarder, conserver, transmettre au public par telecommunication ou par I'lnternet, preter, distribuer et vendre des theses partout dans le monde, a des fins commerciales ou autres, sur support microforme, papier, electronique et/ou autres formats.
The author retains copyright ownership and moral rights in this thesis. Neither the thesis nor substantial extracts from it may be printed or otherwise reproduced without the author's permission.
L'auteur conserve la propriete du droit d'auteur et des droits moraux qui protege cette these. Ni la these ni des extraits substantias de celle-ci ne doivent etre imprimes ou autrement
reproduits sans son autorisation.
In compliance with the Canadian Privacy Act some supporting forms may have been removed from this thesis.
Conformement a la loi canadienne sur la protection de la vie privee, quelques
formulaires secondaires ont ete enleves de cette these.
While these forms may be included in the document page count, their removal does not represent any loss of content from the thesis.
Bien que ces formulaires aient inclus dans la pagination, il n'y aura aucun contenu manquant.
1+1
AUTHOR'S DECLARATION OF ORIGINALITY
I hereby certify that I am the sole author of this thesis and that no part of this thesis has
been published or submitted for publication.
I certify that, to the best of my knowledge, my thesis does not infringe upon anyone's
copyright nor violate any proprietary rights and that any ideas, techniques, quotations, or
any other material from the work of other people included in my thesis, published or
otherwise, are fully acknowledged in accordance with the standard referencing practices.
Furthermore, to the extent that I have included copyright material that surpasses the
bounds of fair dealing within the meaning of the Copyright Canada Act, I certify that I
have obtained a written permission from the copyright owner(s) to include such
material(s) in my thesis and have included copies of such copyright clearances to my
appendix.
I declare that this is a true copy of my thesis, including any final revisions, as approved
by my thesis committee and the Graduate Studies office, and that this thesis has not been
ABSTRACT
Three different combustion modes for simultaneous nitrogen oxides (NOx) and low-particulate-matter (PM) called enhanced-premixed combustion (EPC) are described in
this thesis for diesel engines.
a) Multi-pulse EPC: This combustion mode was implemented with multi-pulse
fuel-injection events early during the compression stroke and a heavy use of EGR. This type
of combustion was characterized by a short combustion duration which increased the
rate-of-pressure rise and maximum pressures in comparison to the conventional diesel
combustion mode. The combustion phasing for this mode was kinetics controlled and this
combustion mode was largely applicable to mid-load engine operating conditions.
b) EGR enabled EPC with single injection: This combustion mode was implemented with
a single-injection close to top-dead center and a heavy use of EGR. The use of
closed-loop control on combustion phasing via a cylinder pressure based control was found to be
an important enabler for stabilizing this type of combustion. This combustion mode was
applied mainly at low-load engine operating conditions.
c) Combustion mode with a split heat-release characteristic: This combustion mode
consisted of a part of the fuel delivery very early during the compression stroke and a part
of the fuel delivery close to the top-dead-centre (TDC). The part of fuel injected close to TDC experienced conventional high-temperature combustion and oxidized the
carbon-monoxide produced earlier in the cycle, thereby improving combustion efficiency. The
split nature of the combustion limited the rate-of-pressure rise associated with the
multi-pulse EPC combustion.
The implementation of EPC were associated with fuel-efficiency penalty either due to
off-phasing of combustion event, UHC and carbon-monoxide or oil-dilution. Specific
A production version of 2.0 Liter, 4-cylinder FORD common-rail diesel engine was
modified for the EPC experiments to run in a single-cylinder mode using a prototype
intake and exhaust manifold and using independent fuel-injection strategies.
Keywords: Enhanced premixed combustion, heavy-EGR, long-ignition delay combustion,
DEDICATION
This dissertation is dedicated to my parents, Mr. M. Muthurajan and Mrs .M.Nagaratinam
my sister, Dr. M.Uma Maheshwari and brother M.Anand, who are my great role models
and friends, and for always believing in me, inspiring me, and encouraging me to reach
higher in order to achieve my goals. I am also thankful to my dear friend Simran without
ACKNOWLEDGEMENTS
I take this opportunity to thank everyone who helped in completing my PhD. I am
extremely thankful to advisor my Dr. Ming Zheng for his valuable guidance. Dr. Zheng
extended his support in all areas of research: experimentation, control and modeling work.
I would also like to thank the committee members Dr. Graham T. Reader, Dr. Xiaohong
Xu, Dr. Robert Gasper and Dr. Jimi Tjong for their guidance in this research.
I am extremely thankful to my colleagues Dr. Meiping Wang, Dr. Mwila Clarence
Mulenga, Usman Asad, Yuyu Tan, Xiaoye Han and Siddhartha Banerjee, who helped me
during my stay at the University of Windsor.
Many thanks to Bruce Durffy, Steve Budinsky, Andy Jenner, Rob, Tim and other
members of the Technical Support Center at the University of Windsor who helped in the
in-house fabrication of several components for the project.
I am also thankful to Dr. William de Ojeda at International Truck and Engine Company
for his valuable inputs.
I am grateful for the support from the University of Windsor, AUTO 21TM (a member of
the Network of Centers of Excellence of Canada Program). Additionally, the
collaborators in the Clean Diesel Engine Laboratory are also thanked; Canada Research
Chair Program, Canada Foundation of Innovation (CFI), Ontario Innovation Trust (OIT),
Natural Sciences and Engineering Research Council of Canada (NSERC), Ford Motors
Canada, International Truck and Engine Corporation.
Raj Kumar
Windsor, Ontario, Canada
TABLE OF CONTENTS
AUTHOR'S DECLARATION OF ORIGINALITY Ill
ABSTRACT IV
DEDICATION VI
ACKNOWLEDGEMENTS VII
LIST OF FIGURES XI
LIST OF TABLES XXI
1 PREFACE 1
1.1 Motivation 1
1.2 Objective and approach 1
1.3 Thesis Organization 2
2 INTRODUCTION 4
2.1 Diesel Engine 4
2.2 Combustion in Diesel Engines 4
2.3 Oxides of Nitrogen 7
2.4 Particulate Matter 9
2.5 Un-burnt-Hydrocarbons 10
2.6 Exhaust Emissions Regulation 11
2.7 NOx-PM trade-off 14
3 LITERATURE REVIEW 15
3.1 Mechanism of particulate matter and NOx reduction 15
3.2 Simultaneous NOx and particulate-matter reduction in diesel engine 17
3.3 Enhanced Premixed Combustion Strategies 23
4 OBJECTIVES OF THE STUDY 28
4.1 Objectives 28
5 METHODOLOGY 31
5.1 Experimental Preparation 31
5.2 Post-processing of In-cylinder Pressure 36
5.3 Emission Analyzers 38
5.5 Modeling Work 40
6 RESULTS AND DISCUSSION 43
6.1 Empirical Work 43
6.1.1 EPC experiments with single injection and no EGR 45
6.1.2 EPC with multiple-fuel injection strategy and no EGR 47
6.1.3 EPC at high load with multiple injection strategies and EGR 49
6.1.4 Injection pressure as an enabler for EPC combustion 62
6.1.5 EGR enabled EPC experiments with single-injection strategy 64
6.1.6 Parametric study during EPC combustion 73
6.1.7 Limitations of EGR enabled EPC 79
6.2 Adaptive Fuel Injection Control 82
6.2.1 Validation of adaptive control algorithm 87
6.2.2 Continuous change in EGR at constant boost 90
6.2.3 Continuous increase in boost at the same EGR valve setting 92
6.2.4 Very high EGR condition 94
6.2.5 EPC with adaptive control 97
6.2.6 Transients in enhanced premixed combustion Region 98
7 CYCLE THERMAL EFFICIENCY CHARACTERIZATION FOR EPC 109
7.1 Efficiency Description 109
7.2 Factors Effecting Cycle Thermal Efficiency for EPC Combustion 114
7.3 Equivalence between the Thermal Conversion Efficiency and CO, HC
Emissions 119
8 ANALYSIS OF MODELING RESULTS 132
8.1 CHEMKIN Simulation for Deciding EPC Boundary Conditions 132
8.2 Simulation Studies for EPC Combustion with EGR Fuel Reforming 143
8.3 Multi-Dimensional Modeling 150
9 HEAT-RELEASE RATE CHARACTERIZATION 156
9.1 Heat-Release Pattern for NOx 158
9.2 Heat-Release Pattern for Soot 162
9.3 Heat-Release Pattern for HC 166
9.5 Heat-Release Rate, Combustion-Phasing and Fuel Injection Scheduling 169
9.6 Heat-Release Rate Pattern for Thermal Efficiency 174
9.7 Heat-Release Rate Pattern for CO Post-Oxidation 174
9.8 Implementation of EPC 180
9.9 Revisiting the basic premise 185
10 CONCLUSIONS AND FUTURE WORK 189
10.1 Conclusions 189
10.2 Future Work 193
REFERENCES 194
11 APPENDIX 202
11.1 Fuel-Injection Strategies at Clean-Diesel Engine Laboratories 202
11.2 Engine Instrumentation 205
11.3 US-FTP Emission Norms 208
11.4 Evolution of Diesel Engine Oils 215
11.5 Modeling Equations 216
11.6 NOx Estimation Using Zeldovich mechanism 221
11.7 Carbon Monoxide Formation 223
11.7.1 Effect of temperature 223
11.7.2 Effect of oxygen concentration 224
11.7.3 Effect of pressure 225
11.8 Various Methods of Expressing EGR 226
11.9 Glossary of Terms 227
VITAAUCTORIS 229
LIST OF FIGURES
Figure 2-1: Typical heat-release rate from a classical diesel engine based on testing
in the Clean Diesel Laboratory 6
Figure 2-2: Mechanism of emission formation in diesel engines [6] 7
Figure 2-3: Hydrocarbon formation in diesel engine [4] 11
Figure 2-4: Evolution of NOx emission standards and control techniques 13
Figure 2-5: Evolution of soot emission standard and control techniques 13
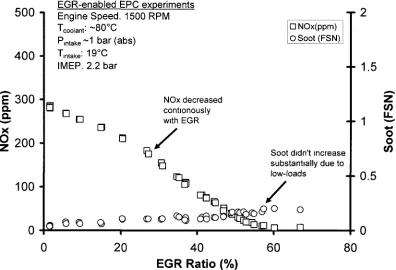
Figure 2-6: Experimental results showing traditional NOx soot trade-off with the
application of EGR at the Clean Diesel Engine Laboratory [25] 14
Figure 3-1: Pathway for simultaneous NOx and soot reduction [11] 16
Figure 3-2: Mechanism of the soot formation for surrogate diesel fuel, n-heptane
[14] 17
Figure 3-3: Port injection experiments at the University of Windsor [35] 21
Figure 3-4: Emission results for port injection experiments [35] 22
Figure 3-5: Simultaneous reduction of NOx and soot using lean homogenous
cylinder charge 24
Figure 3-6: Simultaneous reduction of NOx and soot with weak-homogeneous
cylinder charge 25
Figure 3-7: Transition to conventional combustion to low emission diesel
combustion 26 Figure 3-8: Overall mixture preparation strategies for diesel HCCI type of
combustion 27
Figure 4-1: Implementation and characterization of EPC experiments 30
Figure 5-1: Hardware modifications for conversion to a single-cylinder research
engine for the EPC experiments 34
Figure 5-2: Implementation of enhanced premixed combustion strategies 35
Figure 5-3: System layout showing cylinder pressure data-acquisition 36
Figure 5-4: List of tools and their application to support EPC combustion strategy 41
Figure 5-5: Simulation tools and there area of application to support the
Figure 6-1: Effect of varying the commanded SOI on NOx emissions with a single
injection strategy 46
Figure 6-2: Effect of timing advance (conventional timing and no EGR) 46
Figure 6-3: Injection timing and quantity selection for lean-homogenous mixture
preparation 48
Figure 6-4: Heat-release for point A 48
Figure 6-5: Heat-release rate for point C 49
Figure 6-6: Effect of EGR on EPC combustion for a fixed injection strategy 51
Figure 6-7: Effect of boost on EPC combustion at a constant EGR ratio for a fixed
injection strategy 51
Figure 6-8: Effect of boost on EPC combustion strategy at constant intake oxygen
concentration and a fixed injection strategy 52
Figure 6-9: Effect of start of injection on liquid penetration length for a fixed
injection pressure 54
Figure 6-10: Effect of boost on spray penetration for a fixed start of injection 55
Figure 6-11: Effect of injection pressure on liquid spray penetration length 55 Figure 6-12: Effect of injection strategy on fuel condensation/HC emissions 56
Figure 6-13: Implementation of injection timing guidelines for enhanced premixed 57
Figure 6-14: Effect of EGR and boost on emission at fixed injection strategy 58
Figure 6-15: Effect of EGR and boost on emission at fixed injection strategy 58
Figure 6-16: Effect of EGR and boost on emission at the fixed-injection strategy 59
Figure 6-17: Representative heat-release for the case of 2-injections with lOOkPa
boost and 51% EGR 59
Figure 6-18: Injection timing window that was able to obtain simultaneous
low-NOx and low-soot combustion with multi-pulse injection strategies 61
Figure 6-19: Transition from conventional diesel to HCCI combustion mode during
the dynamometer tests 62
Figure 6-20: Effect of injection pressure on the mixing duration 63
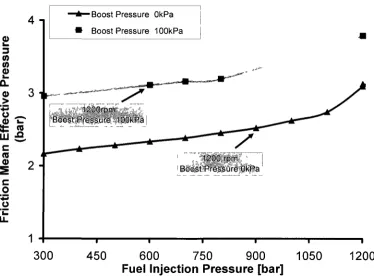
Figure 6-21: Effect of injection-pressure on friction-mean effective pressure
determined using a motoring dynamometer 63
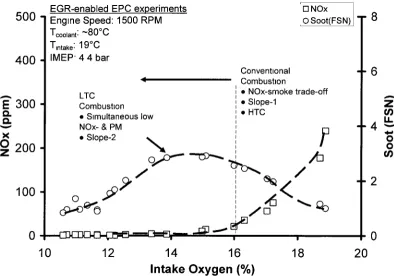
Figure 6-23: EGR-enabled EPC experiments at low-loads 65
Figure 6-24: Simultaneous reduction of NOx and soot with EGR-enabled EPC
combustion using a single injection strategy 67
Figure 6-25: Simultaneous reduction of NOx and soot with EGR-enabled EPC 67
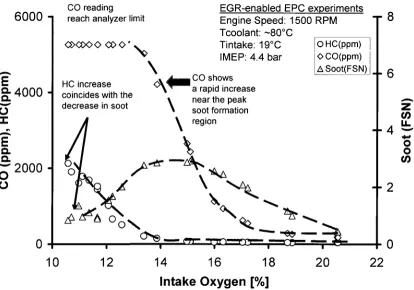
Figure 6-26: Effect of EGR on CO and HC during EGR-enabled EPC 68
Figure 6-27: Effect of intake-oxygen concentration on CO and HC during
EGR-enabled EPC 68
Figure 6-28: Enhanced premixed combustion with EGR prolonged ignition delay 69
Figure 6-29: IMEP penalty for different injection timing to achieve enhanced
premixed combustion 70
Figure 6-30: Fraction of energy carried by CO and HC in the exhaust 70
Figure 6-31: Effect of EGR on heat-release rate for a fixed SOI 71
Figure 6-32: EGR-enabled EPC combustion at mid-load conditions with increasing
boost and commanded rail pressure 72
Figure 6-33: Load-limits for a given boost and injection pressure for EGR enabled
EPC 72
Figure 6-34: Effect of load on Slope-1 and Slope-2 curves of soot formation at
fixed boost and injection pressure 74
Figure 6-35: Effect of load on Slope-1 and Slope-2 curves of soot formation at
increased boost and injection pressure 74
Figure 6-36: Effect of load on Slope-1 and Slope-2 of EPC combustion 75
Figure 6-37: Effect of intake oxygen concentration on soot-formation during EGR
enabled EPC 75
Figure 6-38: Effect of increase in load on NOx during EGR enabled EPC 76
Figure 6-39: Effect of intake oxygen concentration on soot-formation during EGR
enabled EPC 77
Figure 6-40: EGR-enabled EPC experiments at 8.0 bar IMEP 77
Figure 6-41: Use of higher injection pressure to reduce the peak soot-formation in
the Slope-1 region 78
Figure 6-42: Use of higher boost and higher injection pressure to reach EGR
Figure 6-43: Combustion flame nearly died in presence of high-EGR without
closed-loop on combustion phasing correction 80
Figure 6-44: Typical relationship between the commanded SOI and the CA-50 80
Figure 6-45: 200 consecutive pressure cycles showing the effect of SOI during EPC.
81
Figure 6-46: 200 consecutive pressure cycles showing the effect of SOI during EPC.
81
Figure 6-47: Comparison of commanded injection signal and actual injection rate ©
IAVGmbH[62] 82
Figure 6-48: Sample heat-release rate characterization based on Ford diesel engine
test 84
Figure 6-49: Relationship between CA-50% and 0(dp/de)max. 85
Figure 6-50: The decision-making flowchart for the adaptive control strategies
implemented in the tests 86
Figure 6-51: The cylinder pressure traces with the adaptive fuel injection control at
fixed EGR (slow method) 88
Figure 6-52: The effect of adaptive fuel injection control on transient 0(dP/de)max
synchronization (slow method) 88
Figure 6-53: The cylinder pressure traces with the adaptive fuel injection control at
fixed EGR (fast method) 89
Figure 6-54: The effect of adaptive fuel injection control on transient 9(dP/de)max
synchronization (fast method) 89
Figure 6-55: Adaptive fuel injection control with continuous change in EGR (slow
method) 90
Figure 6-56: Adaptive fuel injection control with continuous change in EGR, every
5th cycle shown (slow method) 91
Figure 6-57: The effect of adaptive injection on the transient 9(dp/de)max with step
change in EGR slow method 91
Figure 6-58: The effect of adaptive fuel injection control on the transient 0(dp/de)max
Figure 6-59: The effect of adaptive fuel injection control on the transient 9(dp/de)max
with boost level variations 93
Figure 6-60: The transient Pmax during continuous increase in boost levels 93
Figure 6-61: NOx reduction by extending EGR limit with the adaptive fuel
injection control 95
Figure 6-62: The cylinder pressure traces for 200 consecutive cycles with and
without adaptive fuel injection control at a heavy EGR ratio 95
Figure 6-63: The cylinder pressure traces for 200 consecutive cycles with and
without adaptive fuel injection control at a heavy EGR ratio 96
Figure 6-64: The soot comparison for tests with and without adaptive control 96
Figure 6-65: The enhanced premixed combustion cycles (NOx) enabled with
adaptive control during the dynamometer tests 97
Figure 6-66: The enhanced premixed combustion cycles (soot) enabled with
adaptive control during the dynamometer tests 98
Figure 6-67: Load and boost transient test region 99
Figure 6-68: Load change in the low-temperature combustion region with adaptive
fuel-injection control 100
Figure 6-69: Load changes in the low-temperature combustion region with adaptive
fuel-injection control 100
Figure 6-70: Load change in the low-temperature combustion region with adaptive
fuel-injection control 101
Figure 6-71: Emission measurement history during load transients with adaptive
fuel-injection control 101
Figure 6-72: Boost transient in low-temperature combustion region with adaptive
duel-injection control 102
Figure 6-73: Emission transients during boost transients with adaptive
fuel-injection control 103
Figure 6-74: Emission response during boost transients without adaptive
fuel-injection control 103
Figure 6-76: Emission response during boost and speed variations with adaptive
fuel-injection control (EGR upstream pressure not constant) 105
Figure 6-77: Emission response during boost and speed variations without adaptive
fuel-injection control. (EGR upstream pressure not constant) 105
Figure 6-78: Combined effect of boost and RPM change. (EGR held constant) 106
Figure 6-79: Emission response during boost and RPM change. (With adaptive
control and EGR back pressure held constant) 106
Figure 7-1: Energy flow-diagram for a diesel engine based on [63] 113
Figure 7-2: Comparison for heat-release rates for EPC and conventional
combustion 115
Figure 7-3: Comparison of the fuel-efficiency for different type of EPC combustion
strategies with conventional combustion 115
Figure 7-4: Heat-release rates used as input conditions for examining the effect of
combustion phasing and duration on cycle thermal efficiency 117
Figure 7-5: Effect of CA50 and combustion duration on r|jnd at 1200rpm simulated
using SAES 117
Figure 7-6: Effect of combustion phasing and combustion duration on
rate-of-pressure rise simulated using SAES 118
Figure 7-7: Effect of combustion phasing and combustion duration on maximum
in-cylinder pressure simulated using SAES 118 Figure 7-8: Effect of EGR on combustion phasing, CO and HC emissions 121
Figure 7-9: Equivalence between efficiency loss due to emissions and combustion
phasing 122
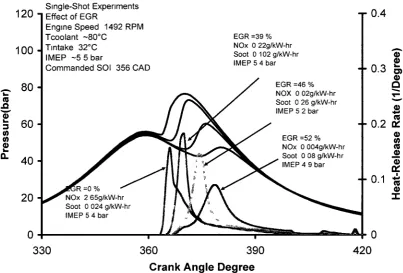
Figure 7-10: EGR enabled EPC with a single-shot combustion 126
Figure 7-11: IMEP penalty incurred due to EGR enabled EPC with fuel injection
timing adjusted to peak IMEP 126
Figure 7-12: Effect of EGR on combustion phasing and duration during the
implementation of EPC 128
Figure 7-13: Effect of EGR on CO and HC during EPC enabling 128
Figure 7-14: Heat-release rate characteristics for the conventional and EPC
Figure 7-15: Effect of combustion-phasing on IMEP for analyzing the cycle
inefficiencies of Figure 7-14 130 Figure 7-16: Effect of combustion shaping on IMEP for analyzing the cycle
inefficiencies of Figure 7-14 131
Figure 7-17: EPC cycle efficiency improvement by combustion phasing
optimization 131
Figure 8-1: Comparison of experimental and chemical kinetics based combustion
phasing predictions for EPC combustion with multiple-early injections at low load.... 133
Figure 8-2: Comparison of experimental and chemical kinetics based combustion
phasing predictions for EPC combustion with multiple-early injections at high load. ..133
Figure 8-3: Relationship between the engine boundary conditions and the
combustion phasing requirements for the multi-pulse EPC combustion strategy 134
Figure 8-4: Contour plots for the start of combustion as function of overall global
equivalence ratio and T,ntake 135
Figure 8-5: Polytropic index as a function of local lambda and intake temperature 136
Figure 8-6: Contour plot for SOC as a function of Tintake and EGR (CR=15:1) 137
Figure 8-7: Relationship between the intake temperature and the EGR-rates during
atypical EGR-sweep 138
Figure 8-8: Increase in Pmax and maximum rate-of-pressure rise with increasing
load for a fixed combustion phasing and fixed EGR 140 Figure 8-9: Increase in Pmax with increasing load for a fixed combustion phasing
and fixed EGR 140
Figure 8-10: Increase in rate-of-increase of pressure with increasing load for a fixed
combustion phasing and fixed EGR 141
Figure 8-11: Contour plot for SOC as a function of Tintake and EGR (CR=12:1) 141
Figure 8-12: Increase in Pmax and maximum rate-of-pressure rise with increasing
load for a fixed combustion phasing and fixed EGR 142
Figure 8-13: Decrease in rate-of-increase of pressure with the lowering in
compression ratio 142
Figure 8-14: Exhaust temperature and exhaust oxygen concentrations during typical
Figure 8-15: Conceptual layout of EGR reformer 144
Figure 8-16: Effect of reformer operating lambda on the production of hydrogen
and carbon monoxide 145
Figure 8-17: Sensitivity of temperature towards hydrogen production 146
Figure 8-18: Fuel reformer in intake and exhaust loop 147
Figure 8-19: Comparison of experimental and simulation cylinder pressure and
heat-release rate characteristics 151
Figure 8-20: The bulk temperature, heat-release rate and modeled rate-of-injection
for the conventional combustion 152
Figure 8-21: Combustion process on the (|)-T map during the ignition-delay period 152
Figure 8-22: Combustion process on the §-T during the pre-mixed combustion
period 153
Figure 8-23: Combustion process during the diffusion combustion period 153
Figure 8-24: Mixing process during the ignition delay period for the EPC
combustion 155
Figure 9-1: Heat-Release rate characteristics for classical diesel combustion
without emission control [75] 156
Figure 9-2: Heat-release rates configured for NOx control and post-injection for
diesel after-treatment 157
Figure 9-3: Effect of continuously increasing EGR with a fixed combustion phasing
for single injection and 2 injection strategies 158
Figure 9-4: NOx reduction by use of pilot injection (very-low EGR) 159
Figure 9-5: Combined effect of EGR and pilot injection for NOx reduction at
moderate EGR 160
Figure 9-6: Initiation of pilot-combustion suppressed by the use of heavy EGR 160
Figure 9-7: Continuous decrease in NOx with increasing EGR 161
Figure 9-8: NOx as a function of intake oxygen for different load conditions 162
Figure 9-9: Heat-release rate for soot reduction with multiple-injection and
application of EGR 163
Figure 9-11: Heat-release rate for soot reduction with single-injection and
application of heavy-EGR 164
Figure 9-12: Relationship between ignition-delay and smoke for EPC combustion
with single-shot injection strategy and a heavy use of EGR 165
Figure 9-13: The effect of injection strategy on the smoke during EPC 165
Figure 9-14: Effect of ignition delay on HC for different injection strategies 166
Figure 9-15: Typical heat-release rate and rate of pressure rise curve shown at high
loads with multiple-pulse HCCI injection strategy 167
Figure 9-16: Effect of CA50 and combustion duration on r|jnd and Pmax, (dp/d9)max
at 1200rpm, pint=3bar(abs) for single and joint heat-release shapes 168
Figure 9-17: (dp/d9)max for single hump and joint combustion 168
Figure 9-18: Implementation of split combustion heat-release rate to limit rapid
pressure rise associated with HCCI type of injection strategy [32] 169
Figure 9-19: Combustion phasing control when the injection and the combustion
phasing are coupled 170
Figure 9-20: Injection timing correction for single-shot EPC combustion 172
Figure 9-21: Understanding the injection timing and combustion phasing
correlation 173
Figure 9-22: Understanding the injection timing and combustion phasing
correlation 173 Figure 9-23: Ignition delay correlation with commanded start of injection 174
Figure 9-24: Post oxidation of CO by late-injection 175
Figure 9-25: Post oxidation of CO by late-injection 176
Figure 9-26: Empirical results with HCCI-plus-late-main injection strategy 178
Figure 9-27: Sensitivity towards EGR for enhanced premixed experiments 179
Figure 9-28: Single-shot enhanced premixed combustion with high EGR 179
Figure 9-29: Major subsystems and their output for the implementation of EPC
with prolonged ignition-delay and the injection and the combustion phasing are not
coupled 182
Figure 9-30: Transition from conventional combustion to EGR enabled EPC 184
Figure 9-32: NOx estimations based on Zeldovich's mechanism 186
Figure 9-33: Original <j)-T diagram [11] 186
Figure 9-34: Actual engine operating condition in the (j)-T diagram 187
Figure 9-35: Modified c|)-T diagram in presence of EGR 188
Figure 11-1: Injection strategies investigated for EPC combustion 204
Figure 11-2: Basic flow-chart for implementation of zero-dimensional engine cycle
simulations 220
Figure 11-3: Effect of temperature on CO oxidation (constant temperature and
pressure assumption) 223
Figure 11-4: Effect of temperature on CO oxidation (constant temperature and
volume assumption) 224
Figure 11-5: Effect of oxygen concentration on CO conversion 224
L I S T O F T A B L E S
Table 2-1: Particulate-matter constituent characterization 9
Table 3-1: History of HCCI combustion 19
Table 5-1: Geometrical characteristics of the engine used for EPC experiments 31
Table 5-2: List and specification of emission analyzers 39
Table 6-1: Experimental Test Matrix 44
Table 6-2: Effect of commanded SOI on ignition-delay 45
Table 6-3: Implementation of EPC strategies and their comparative advantages and
disadvantages 108
Table 7-1: Effect of EGR on efficiency distribution for the case of (Figure 7-8) 121
Table 8-1: Comparison of reformer efficiency 147
Table 8-2: Assumption values with linear brake thermal efficiency improvement 148
Table 8-3: Calculated overall efficiency accounting for the effect of hydrogen
production on the overall brake-thermal efficiency 149
Table 8-4: Simulation conditions for EPC combustion 155
Table 9-1: Comparison of HCCI plus late injection strategy with single-shot LTC 177
Table 9-2: Advantages and disadvantages of HCCI plus late injection strategy 178
Table 9-3: Desired heat-release characteristics 180
Table 9-4: Modes of process-control in fuel-subsystem during EPC combustion 183
Table 9-5: Modes of process-control in air-subsystem during EPC combustion 183
Table 10-1: Summary of EPC combustion techniques and their major
characteristics 192
Table 11-1: Vehicles categories used in EPA Tier 2 Standards 209
Table 11-2: Tier 2 emission standards, FTP 75 g/mi [18] 211 Table 11-3: Phase-in percentages for Tier 2 requirements 214
Table 11-4: Evolution of diesel engine oil with increasingly stringent emission
norms 215
NOMENCLATURE
ABDC
ATDC
BDC
BMEP
BSFC
CAD
CAI
CI
CN
DI
EGR
EOC
EPA
EVO
Exh
FBP
FPGA
FSN
HCCI
H-FID
HRR CA50
HTC
IBP
ICE
After Bottom Dead Centre
After Top Dead Centre
Before Bottom Dead Centre
Brake Mean Effective Pressure
Brake Specific Fuel Consumption
Crank Angle Degrees (°CA)
California Analytical Instruments
Compression Ignition
Cetane Number
Direct Injection
Exhaust Gas Recirculation
End of Combustion
USA Environmental protection Agency
Exhaust Valve Open
Exhaust
Final Boiling Point
Field Programmable Gate Array
Filter Smoke Number
Homogeneous Charge Compression Ignition
Heated-Flame Ionization Detector
Crank Angle of 50% Heat-Released
High Temperature Combustion
Initial Boiling Point
IMEP
Int
IVC
LHV
LTC
MAF
NDIR
NO
N 02
0
OH
P
"intake
PM
ppm
Ru
SAES
SOC
SOI
T
TDC
THC
1 intake
TWC
UHC
Indicated Mean Effective Pressure
Intake
Intake Valve Close
Lower Heating Value
Low Temperature Combustion
Mass Air Flow
Non-Dispersive Infra-Red
Nitrogen Oxide
Nitrogen Di-Oxide
Oxygen Radical
Hydroxyl Radical
Average Cylinder Pressure (during TID)
Intake Pressure
Particulate Matter
Parts Per Million
Universal Gas Constant
Synthetic Atmosphere Engine Simulations
Start of Combustion
Start of Injection
Average Cylinder Temperature (during TID)
Top Dead Centre
Total Hydrocarbons
Intake Temperature
Three-Way Catalytic converter
C H A P T E R I
1 P R E F A C E
1.1 Motivation
Diesel engines have high thermal efficiencies due to their higher compression ratio and
fuel-lean operation. In addition, diesel engines do not suffer from throttling losses such as
in the case of conventional gasoline engines which increases their part-load efficiency.
However, the main challenge for the modern diesel engines is to meet increasingly
stringent emission norms for oxides of nitrogen (NOx), particulate-matter (PM),
carbon-monoxide (CO) and un-burnt hydrocarbons (HC). A significant challenge for emission
reduction in current production diesel engines is the presence of NOx-PM trade-off,
which means that any emission control measure that leads to a reduction in NOx, results
in an increase in PM emissions and vice-versa.
In the present work, the enhanced-premixed combustion strategies have been
demonstrated that were able to reduce NOx and PM emissions simultaneously, with
limited penalty on the indicated efficiency.
1.2 Objective and approach
The primary goal of the work was to develop an enhanced-premixed combustion (EPC)
strategy that helped to overcome the traditional NOx-PM trade-off and reduce NOx and
PM simultaneously. This was done by the preparation of a premixed lean cylinder-charge
or premixed diluted cylinder-charge prior to the combustion process. However, the
preparation of a premixed cylinder charge with in-cylinder injection strategy represents a
significant challenge due to the low volatility of the diesel fuel. The petroleum derived
diesel fuel is composed of saturated, unsaturated and aromatic hydrocarbons. The carbon
chain for the diesel fuel consists of CIO and higher carbon atoms. The chain length has a
strong correlation with the boiling point of the fuel, with the longer chains having a
higher boiling point. Therefore, the boiling point of diesel is significantly higher than
used for the present experiments, the vaporization was initiated at ~175°C and continued
up to 350°C depending on their molecular structure of the hydrocarbons. These
high-temperatures limit the implementation of external mixture preparation strategies such as
intake-port injection for the diesel engine. Even for the in-cylinder mixture preparation
strategies the temporal window of the fuel vaporization and mixture preparation is
normally short, for instance limited to 40~80°CA depending on the engine operating
condition.
In this thesis, the effect of important engine parameters such as the fuel-injection
scheduling, exhaust gas recirculation (EGR), boost, and injection-pressure was
experimentally investigated on the mixture preparation process for the EPC combustion.
Based on the experimental studies, guidelines were developed to facilitate the
implementation of the EPC strategies over a range of engine operating conditions. The
implementation of the EGR enabled EPC strategy resulted in engine operations with high
cycle-to-cycle variation and therefore, cylinder-pressure based control strategies were
developed and used to assist the engine operation.
1.3 Thesis Organization
The thesis is divided into the IX sections.
Section-I, Preface: This section details the main motivation for the thesis.
Section-II, Introduction: In this section the basics of the diesel combustion and the
pollutant formation are discussed.
Section-Ill, Literature review: In this section work done by other authors in the area for
in-cylinder emission control for the diesel combustion is reviewed. This helped to
develop the methodology for the present work.
Section-V: Methodology: In this section the details of the experimental and the modeling
preparation are provided. The important details for post-processing the experimental data
can also be found in this section.
Section-VI, Results and discussion: The experimental test results are presented in a
chronological manner in this section.
Section-VII, Efficiency characterization: The examination of the results in the section VI
showed that there is a thermal-efficiency penalty during the implementation of the EPC
combustion strategy. The major factors that affect the cycle thermal efficiency are
documented in this section. This section also provides steps to improve
thermal-efficiency of the EPC cycles.
Section-VIII, Modeling studies: In this section, the results for the chemical-kinetic based
modeling to evaluate the boundary conditions of boost and EGR for the EPC combustion
are presented. The results for the numerical investigation of EGR-reformer are also
presented in this section. Furthermore, the computational-fluid dynamics results to
explain the EPC combustion are also described in this section.
Section-IX, Heat-release rate characterization: In this section the relationship between the
heat-release rate and each of the important emission and performance parameter for the
EPC combustion is examined. Based on this analysis, it is possible to formulate the
desired set of heat-release characteristics for the EPC combustion.
Section-X, Conclusions and future work: In this section the major conclusions of the
thesis have been summarized and the planned future-work for this project has been
CHAPTER II
2 INTRODUCTION
2.1 Diesel Engine
The concept of compression-ignition was proposed by the German engineer, Rudolf
Diesel. He was deeply influenced by his contemporaries, Sadi Carnot and Nicolaus Otto.
He understood that the engine's cycle efficiency was decided primarily by the
compression/expansion cycle. In 1876, Nicolaus Otto had demonstrated the concept of
4-stroke engine with a premixed fuel-air charge. Since a premixed cylinder charge was used,
Otto had to limit the compression ratio so that the spontaneous combustion of the
cylinder-charge would not be initiated before ignition. Diesel realized that by limiting the compression ratio, Otto had indirectly limited the thermal efficiency for the engine-cycle
[1,2,3]. Diesel's solution to the problem was to inject the fuel only during the
compression stroke and thus higher compression ratio could be used, thereby achieving
higher cycle efficiency. He published his work in a paper called, "The Theory and
Construction of a Rational Heat Engine Substitute for the Steam Engine and Today's
Combustion Engines" and applied for the patent for his ideas in 1892. He was granted
the first patent for his "Working Method and Design for Combustion Engines" in 1893
and tested his first prototype engine in same year. This engine was fuelled by powdered
coal and Diesel was able to show that internal combustion was possible with
auto-ignition.
2.2 Combustion in Diesel Engines
The diesel combustion process is usually explained on the heat-release rate diagrams such
as Figure 2-1. The heat-release rate can be considered as the rate at which the chemical
energy of the fuel is liberated during the combustion process and is estimated based on
the in-cylinder pressure data. Traditionally, four regions are identified on the heat-release rate diagram [4]; ignition delay period (A), premixed combustion phase, (B) diffusion
(A), Ignition delay period: For the conventional diesel engine combustion air alone is
compressed in the combustion chamber during the compression stroke, which greatly
increases its temperature and pressure. The diesel fuel (commonly at injection pressures
between 400-1500 bar) is injected into this highly compressed and heated air in the
liquid state during the compression stroke. The liquid fuel droplets then absorb/extract
heat from their surroundings and vaporize quickly. This reduces the temperature of the
thin layer of air surrounding the droplet but its temperature is again raised by heat
transfer from the main bulk of air. The diesel auto-ignition takes place only after the
vaporized fuel is mixed with the air to flammability limits and the local temperature is
above the auto-ignition temperature. Thus, there is a delay, called the ignition delay
period before the combustion is initiated.
(B), Premixed combustion phase: At the end of the ignition delay period, the fuel-air
mixture that is premixed during the ignition delay period burns rapidly. Once ignition has
taken place and flames are established, the thermal energy available for further
evaporation is enhanced by the energy released by combustion. The initial fuel droplets
meet air whose temperature is only slightly above their self-ignition temperature and
ignite after ignition delay, however, the subsequent fuel droplets find air that is already
heated to much higher temperatures by the burning of initial droplets and therefore their
ignition delay is much shorter.
(C), Diffusion combustion phase: Typically, at the end of premixed combustion phase the
rate of combustion is determined by the fuel-air mixing rate. The mixing controlled part
of the combustion phase is known as the diffusion combustion phase.
(D), Tail-of-combustion: A small amount of heat-release may take place after the
diffusion combustion due to oxidation of soot or other fuel-rich products during the
100 -i
80
-CTJ
£, 60 o
3 (0 (0
4 0
2 0
-Yanmar Single Shot Experiments Boost 1 bar (abs)
Engine Speed 1400 RPM EGR 0%
A = Ignition Delay Period B = Pre-mixed Combustion C = Diffussion Combustion D = Tail-of-Combustion
300
T
330 360 390 Crank-Angle Degrees (°CA)
420
Figure 2-1: Typical heat-release rate from a classical diesel engine based on testing in the Clean Diesel Laboratory.
The spatial and temporal evolution of pollutants such as NOx, particulate matter (PM),
and un-burnt hydrocarbons (UHC) are an area of intensive research. The mechanism of
pollutant formation has been explained by direct in-cylinder sampling studies, laser
diagnostic studies and computational fluid dynamic studies [5-17]. Based on these
research tools it is commonly accepted that the diesel emissions are the result of the
combustion of the heterogeneous air/fuel mixture and the amount of pollutant formation depends on the residence time in different air-fuel ratio and combustion temperature
conditions. The commonly accepted temporal emission evolution during the diesel
combustion process (Figure 2-2) suggests that the NOx is formed during the
near-stoichiometric premixed combustion. The soot also begins to form during the premixed
combustion and reaches its maximum during the diffusion combustion stage. During the
diffusion combustion both soot formation and soot oxidation processes take place and the
soot concentration at the end of the cycle is the difference between the total soot
optical-access [15]. The mechanism of formation of each of the species and the available
techniques of their reduction are also discussed below.
Premixed Combustion NOx formation region
Diffusion Combustion
Soot reaches it maximum here but is also oxidized latei in thecvcle.
TDC 20 Crank Angle
Figure 2-2: Mechanism of emission formation in diesel engines [6].
2.3 Oxides of Nitrogen
Nitrogen oxide (NO) and nitrogen dioxide (NO2) are the two main oxides of nitrogen that
are formed during diesel combustion process. NO usually constitutes about 90% of the
total exhaust NOx. Emission regulating bodies such as Environmental Protection Agency
of United States regulates only nitrogen dioxide (NO2) as a surrogate for this family of
compounds because it is the most prevalent form of NOx in the atmosphere that is
generated by human activities [19]. For the combustion of fuel with very little or no
nitrogen, the NO formation has been explained based on three mechanisms namely:
extended Zeldovich/thermal mechanism, N2O intermediate mechanism and the prompt
a) Extended Zeldovich/thermal mechanism:
The thermal mechanism is considered responsible for the majority of NOx emissions
from conventional diesel engines when the peak combustion temperatures are in excess
of 2000K. The three chemical reactions that are important in this mechanism are:
0 + N2<->NO + N (2.1)
N + 02 «-• NO + O (2.2)
N + OH <-• NO + H (2.3)
The overall reaction rate for equations (2.1)~(2.3) are temperature sensitive and as a
consequence, thermal NO only appears in significant quantities after the start of
heat-release (Figure 2-2). The temperature sensitivity of this mechanism also means that as the
in-cylinder temperature decreases during the expansion stroke, the thermal NO
concentrations freeze shortly after the end of heat-release.
b) N2O intermediate mechanism:
N2O pathway is considered important for NO formation during the lean pre-mixed
low-temperature combustion process. At sufficiently high pressures, N2O is formed as a result
of the three body reaction:
O + N2 + M <-> N20 + M (2.4)
where, "M" is a third body (molecule) of any compound that is needed to remove energy
in order to complete the reaction. In the absence of the third body, it is observed that the
produced N2O quickly decomposed back to the original reactants O and N2. Following
equations (2.5) and (2.6)
H + N20 <-• N2 + OH (2.5)
However, when the air-fuel ratio is lean, NO forms through the reaction of O with N20 .
The O is produced mainly as a result of the equilibrium reaction (2.8)
N20 + O <-* 2NO (2.7)
02 + M <-* 2 0 + M (2.8)
c) Prompt NO mechanism:
The prompt NO is considered significant during the rich combustion process, in the
presence of a high concentration of hydrocarbon, O and OH radicals. Since the prompt
NO mechanism is significant during the rich combustion, it is believed to contribute a
small amount of NO in the diffusion portion of the diesel burning process [15]. The
pathway for prompt NO is initiated by the rapid reaction of hydrocarbon radicals from the
fuel with molecular nitrogen, leading to the formation of amines compounds that
subsequently react to form NO.
2.4 Particulate Matter
As per the emission regulating bodies such as Environmental Protection Agency,
particulate-matter (PM) is defined as any matter in the exhaust of an internal combustion
engine that can be trapped on a sampling filter medium at 125°F (52°C) or less. The
diesel PM is not considered a well defined physical species. Instead, it is treated as a
complex emission, including a number of components. PM is traditionally divided into
three main fractions as listed in Table 2-1 [18]:
Table 2-1: Particulate-matter constituent characterization
Category
Solid fraction
Soluble organic fraction(SOF)
Sulfate Particulates (S04)
Main Constituents
Elemental carbon and ash
Organic material derived from engine lubricating oil and fuel
2.5 Un-burnt-Hydrocarbons
The sources of HC in DI diesel engines have been attributed mainly to over/under-mixing
of fuel-air mixture and flame-quenching during the combustion process [4]. The fuel
injected during the ignition delay period (premixed portion) mixes with air and produces
a wide range of equivalence ratios. Based on the air-fuel ratios the cylinder-charge
mixture can be classified as follows (Figure 2-3):
Lean mixture -A mixture that is too lean to support a stabilized combustion
Stoichiometric -A mixture that is close to the stoichiometric ratio and ready to combust
Rich mixture -A mixture that is too rich and still need to evaporate and mix with air
before it can engage in the combustion process
Combustion is initiated at close to stoichiometric regions and the combustion continues
till the localized air-fuel ratio decreases rapidly due to over-mixing with the surrounding
air or if the flame is quenched at the thermal boundary layer. This over-mixing/quenching
can result in the formation of HC. The lean mixture may engage in the combustion
process, if it mixes with the additional evaporated fuel during the combustion process or
during the expansion-stroke. Similarly, the rich mixture will engage in the combustion
process if it mixes with enough oxygen and can form a flammable mixture. However, if
the lean mixture fails to find the necessary fuel or the rich mixture fails to find the air,
then both the rich and the lean mixture have a tendency to form HC. It may be noted that
that the HC characteristics due to the incomplete combustion of the rich mixture would
be significantly different from that of the lean mixture. The HC formed due to the
incomplete combustion of the rich mixture may consist of lower hydrocarbon chains as
Pyrolysis-Products of Pyrolysis
Fuel
X
I —
Slow mixing or lack of oxygenLocally Over-rich Mixture
HC Pathway
Complete Combustion
Slow reaction No ignition
Air
Desirable HCfor After-treatment
Locally Flammable Mixture
I
H
Over-mixing
Locally Over-lean Mixture
Combustible Mixture
Quenching
Products ( Complete combustion
i O f ] ibustion J
Products ( Incomplete combustion
i o f | nbustion J
Figure 2-3: Hydrocarbon formation in diesel engine [4].
2.6 Exhaust Emissions Regulation
The diesel engines have been used in large heavy-duty trucks, buses and non-road
equipment due to their fuel economy and durability advantages. However, they emit
significant amounts of NOx, PM, and HC as pollutants that have a harmful effect on the
environment and our health. Therefore, the government organizations are implementing
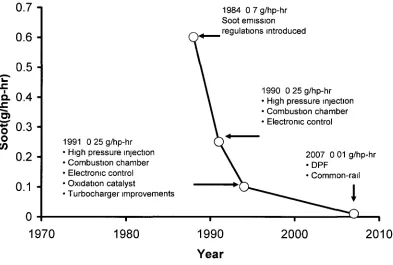
increasingly stringent emission norms to regulate the diesel engine emissions. Figure 2-4
and Figure 2-5 show the important emission control features that were introduced or have
evolved over time with the implementation of increasingly stringent emission norms.
Currently, most of the diesel engine research is focused on meeting the forthcoming
stringent emission norms. An important consideration for the emission regulation is how
these emissions regulations are applied to various vehicle categories and are implemented
gradually over a period of time. Some details about vehicle categories have been included
aspect of the emission regulation has been its significant impact on the engine oil
development. More details about the evolution of engine oil needs with time as the
12-i
1 0
i 8
-% 6H
x
o
42
-0
1984 10 7g/hp-hr Independent NOx emission regulations introduced
1991 5 0g/hp-hr
1998 4 0g/hp-hr • Injection rate shaping • Unit injector
1990 6 0g/hp-hr
• Turbocharging improvements • Retarded fuel injection timing • Improved piston bowl design
2004 2 5 g/hp-hr • E G R
• Common-rail
2010 0 2 g/hp-hr • L T C
• NOx-after treatment
2007 1 2 g/hp-hr • E G R
• Common-rail
1970 1980 1990 2000
Year
2010 2020
Figure 2-4: Evolution of NOx emission standards and control techniques.
0.7 i
0.6-
0.5-Q. 0.4 H .c
"5)
f 0 . 3 H o
</)
0.2 H 0.1
-1991 0 25 g/hp-hr • High pressure injection • Combustion chamber • Electronic control • Oxidation catalyst
• Turbocharger improvements
1970
1984 0 7 g/hp-hr Soot emission regulations introduced
1980
1990 0 25 g/hp-hr • High pressure injection • Combustion chamber • Electronic control
2007 0 01 g/hp-hr • D P F
• Common-rail
2010
2.7 NOx-PM trade-off
As discussed in the previous section most of the diesel combustion research is being
conducted to formulate solutions for the emission regulations. A serious obstacle towards
using in-cylinder emission control measures to meet the emission regulation requirements
is the presence of NOx-PM trade-off. The NOx-PM trade-off means that if a particular
emission control technique resulted in a lower NOx, it has a tendency to increase PM or
vice-versa. For instance, the use of EGR reduced NOx by lowering the combustion flame
temperature and oxygen concentration [4,20-25]. However, the use of EGR led to
increased PM emissions due to lowered oxygen concentration. Other emission control
techniques such as retarding the injection timing or using oxygenated fuels had shown a
similar NOx-PM trade-off. Figure 2-6 shows the NOx-PM trade-off with the use of EGR
for classical low-injection pressure diesel combustion and diesel engines with modern
common-rail injection. Note that the use of higher injection pressure had a tendency to
suppress the soot formation but had a higher NOx for a given EGR value. Therefore, it is
considered very challenging to reduce NOx and PM simultaneously to meet the future
stringent emission norms, while retaining the power-density levels of the modern diesel
engine. X O CD .*: CD CD
H i g h
L o w
Ultra I
L o w
C
Engine Type No oflnjections B M E P [bar] Fuel Pressure [bar] Intake Pressure [bar] (abs)
\ NOx (A) Classical / / / A Classical Diesel 1 3 4 NOP 200 1 NOx (C)
\ C-R Diesel
V
\
NOx(B) ^
C-R Diesel ^
V \ \ 3 K ,
) 20
B Common-Rail 1 4 4 Rail 1200 2 75 c Common-Rail 2 6 1 Rail 1200 2 0 Soot (A) Classical
7
40 EGR Ratio [%]D Common-Rail 6 3 6 Rail 1200 2 7
Soot (C) S o o t (B) C-R Diesel C"R D |esel
/ Q
/
Am /
60
/ N O x & Soot
/ (D) / C-R Diesel
/ / > /
-\ 8
Low NOx & low so (Low Temperature C
High o o w CD i TO LOW Jrr CD Ultra Low 0 3t region ^mbustion)
C H A P T E R III
3 L I T E R A T U R E R E V I E W
3.1 Mechanism of particulate matter and NOx reduction
Clean diesel combustion strategies are being pursued to overcome the classical NOx-soot
trade-off and to reduce the engine-out NOx and soot emissions simultaneously. In order
to accomplish this, researchers have tried to understand the mechanisms of soot and NOx
formation and based on this fundamental study, they have tried to formulate the pathways
for simultaneous low NOx and soot combustion.
Some of the studies were performed on a diesel engine, while others were performed in
apparatus such as a rapid compression machine or a shock-tube. Aoyagi et al. studied the soot formation in a diesel engine using in-cylinder sampling studies and observed that the
soot formation was significant when the maximum combustion temperature ranged from
2100 to 2300K and the maximum equivalence ratio ranged from 1.5 to 3.5 [5]. Kamimoto
et al. studied the soot formation phenomenon in a rapid compression machine using laser
schrielen photograph. Based on their measurements of equivalence ratio and flame
temperatures, they concluded that the soot was formed in a region in the flame where the
average equivalence ratio was rich and the flame temperature was high enough to
promote fuel pyrolysis of the evaporated fuel [10]. Similarly, Uyehara observed that the
soot was formed in the temperature ranges from 2000 to 2400K in diffusion flames [12].
The effect of temperature and pressure on soot formation due to pyrolysis was studied in
shock tubes by Frenklach et al. and their study showed that the soot yield became
significant at 1800K and no soot was generated below 1500K or above 2300K [13].
Kamimoto et al. advanced their previous work with in-cylinder sampling studies in the
actual diesel engine and combined it with their NOx modeling work and produced the
"<|)-T" diagram or local-equivalence-ratio versus local-temperature [11]. This work is widely
considered as the one of the first attempts to formulate the pathway for simultaneous
Oodation / N Q x f o r m a t i o n
0 i — i i • i i I i i i i i i i i i I
1.5 2.0 2.5 3.0
T K xlO3
Figure 3-1: Pathway for simultaneous NOx and soot reduction [11].
Recently, Kitamura et al. (Figure 3-2) have revisited the soot formation characteristics on
the (|)-T map based on computational fluid dynamic analysis. They have also identified
three different regions on their (|)-T map for the soot formation. There was no soot below
1500K regardless of equivalence ratio. Similarly, for an equivalence ratio below 2 no
soot was formed regardless of temperature. The maximum sooting tendency was around
1800 - 2000K and as temperature gets higher than that, the sooting tendency was reduced
for a given equivalence ratio. Based on all the mentioned analysis there was a general
consensus that a lean-homogenous cylinder charge during diesel combustion would have
very little sooting tendency. The lean-homogenous cylinder charge also produces a low
flame temperature which results in low-NOx simultaneously. Thus, the preparation of a
lean-homogenous mixture before the combustion was considered as the primary
] 1% aoot formation
limilf-J 1 t 1 t ' ' ' 1 '
i>oo isoo i7oo i w o 2100 2300 2 w o
Temperature |K|
Figure 3-2: Mechanism of the soot formation for surrogate diesel fuel, n-heptane [14].
3.2 Simultaneous NOx and particulate-matter reduction in diesel engine
Diesel engine researchers have tried to translate the above knowledge to actual diesel
operation. They have tried to prepare the lean-homogenous charge before the combustion
process to achieve simultaneous low-NOx and low-soot during the diesel engine
combustion. This simultaneous low-NOx and low-soot combustion has been called under
different names by various authors such as homogenous-charge-compression-ignition
(HCCI), smoke-less rich combustion, premixed lean diesel combustion (PREDIC) and
modulated-kinetics (MK) and low-temperature-combustion (LTC), depending on the
methodology adopted.
HCCI: HCCI type of combustion has been achieved by compression ignition of a mixture
of air, fuel and EGR of appropriate equivalence ratio. The mixture equivalence ratio has a
significant effect on the combustion process. If the mixture was too rich, the rate of
combustion became too rapid and resulted in knock-related problems. A very lean
mixture resulted in incomplete combustion or misfire. Thus a close-control on the air-fuel
ratio within a narrow band is a strongly desired attribute for the HCCI type of combustion.
Another characteristic for the HCCI type of combustion is the lack of a discernible flame
The first studies on HCCI were performed on a two stroke engine by Onishi et al. in 1979
and they called it Active-Thermo Atmosphere Combustion (ATAC) [26]. Their studies
showed the lack of flame propagation, and the near instantaneous combustion of the
entire cylinder charge mixture. Noguchi et al. demonstrated the same combustion process
in an opposed-piston two stroke engine [27]. They also conducted measurements of
radical concentration during combustion and highlighted the significance of chemical
kinetics during HCCI type of combustion. In 1994, Iida used methanol as a fuel to extend
the load limits of the stable stroke HCCI combustion [28]. HCCI was used in
two-stroke engines to improve combustion stability, reduce HC emissions and improve fuel economy at part load conditions. In 1983, Najt and Foster showed HCCI type of
combustion in a four-stroke engine with iso-octane and n-heptane as fuel [29]. Thring
used both gasoline and diesel fuel, and investigated possible combinations of intake
temperature, equivalence-ratio and EGR for a given load [30]. This work was later
continued by Ryan and Callahan, and they showed that a low compression ratio (8:1),
45-50% EGR rates, and operation from lean to stoichiometric fresh-air-to-fuel ratios was
needed for HCCI type of combustion in diesels [31]. Christensen et al. were the first ones
to demonstrate HCCI type of combustion at high loads with natural gas as fuel [32-33].
A detailed review of the benefits and the disadvantages for HCCI type of combustion has
been provided by Stanglmaier and Roberts [34]. The evolution of the HCCI combustion
Table 3-1: History of HCCI combustion
(A) HCCI-Port Injection
SAE-790501
(First HCCI in 2-stroke)
SAE-830264
(First HCCI in 4-stroke)
SAE-892068
SAE-961160
(Low CR, EGR Guidelines)
SAE-980787 (IMEP-12bar)
SAE-1999-01-0192
SAE 1999-01-3679
SAE 2000-01-1835
SAE 2001-01-1894
Gasoline
Iso-octane ,n-heptane, isopropyl-benzene
Gasoline
Diesel Fuel
Iso-octane, Ethanol, Natural Gas
Iso-octane, Natural Gas and Ethanol
Gasoline, Diesel, Iso-octane, n-heptane
Natural Gas, Iso-Octane
Propane, Butane
Compression Ratio
7.5:1
15:1
7.5:1-17:1
17:1,19:1
18:1
9.6:1,22.5:1
16:1,24:1
(B) Premixed Combustion
SAE-961163
SAE 1999-01-0185
SAE 1999-01-3681
SAE 2005-01-0117 (multiple early injection)
SAE 2005-01-09515
Diesel
Diesel
Diesel
Diesel
Diesel
16.5:1
12:1
17.5:1,16:1
Not available
Not available
(C) Late Injection with Heavy EGR
SAE 1999-01-3681
SAE 2001-01-0200
Diesel
Diesel
18:1
18:1
(D) Fuel Reforming
SAE 2007-01-2044 Diesel + Hydrogen *
SAE 2007-01-1083 Diesel + Hydrogen 18.45:1
Based on the method of homogenous-mixture preparation, the diesel HCCI research can
be divided into port-injection, single or multiple early cylinder injection and late
in-cylinder injection. The port-injection was used by several researchers initially as a means
of mixture preparation due to its simplicity [30,31]. However, a significant disadvantage
for the port-injection strategy was the lack of combustion phasing control by
emissions and was associated with the problems of oil-dilution. Figure 3-3 and Figure 3-4
show the test results for the port injection experiments at the University of Windsor. It
can be seen that for similar load levels port injection HCCI had lower NOx and soot
compared to the conventional diesel combustion. However, the CO and HC emission was
significantly higher in comparison to the conventional diesel combustion. The dilution of
engine-oil with fuel was another significant drawback noticed during the port-injection
experiments.
80 -I
7 0
-
¥60-S> 5 0
-Z J CO
to 2> 4 0 -Q_
I
30-
520-
10-n
Diesel Experiments Speed 1400rpm BMEP 3 4bar
Cool flame r e a c t i o n s ^
300 320 340
»
1 / \ »
' / V 1 \ I P V 1
'/
" 1 '
• • 1 A • M
III '(.I 1 1 l\ ' 1 '1
' 1 ' \
> 1 * V
1 * ^ ^ \
-• 1
/ 1
•
360
Conventional Dl - - Multi-pulse Sequential PI
MSPI ^ - B M E P 3 47bar
Tintake 65 C „ Intake 02 11 16%
dP/deMax 7 2bar/°CA \ HRRCA50 361 CAD
I
380
Conventional Dl \ ^ ^ BMEP 3 42bar
Tintake 60 C Intake 02 12 82% dP/d9Max 4 4bar/°CA
^ HRRCA50 378CAD
I I I
-0.24
< - 0.19 p
CD
-0.14 w
0 CO CO
• 0.09 |
01
1
•4—<
CO CD
- 0.04 x
n r\-i r -U.U1
400 420 440 460 Crank Angle Degrees
10n
I
8
.0)
CO
CD D
Q. CO
o
'8 4
Q. CO
<D A—»
CO
o
T3 C
2
-0
Diesel Experiments Speed: 1400rpm Bore: 102mm Stroke: 105mm CR: 17.8 Torque: 23Nm
i 0 15
0
1 01 i
0 Single Shot Dl
D Multi-pulse Sequential PI
-NOx Soot CO THC
Figure 3-4: Emission results for port injection experiments [35].
PREDIC: PREDIC stands for PREmixed lean Diesel Combustion (PREDIC) and in this
method, in-cylinder fuel injection strategy was implemented. The fuel injection timing
was advanced very early to promote the preparation of a lean homogenous charge
necessary for simultaneous low NOx and low-soot. For this method fuel impingement on
the cylinder wall was a significant hindrance because of low cylinder charge densities at
the time of fuel-injection [36~38].
Recently, multiple-injection strategies along with heavy EGR have also been reported by
various authors as a means to prepare the lean-premixed cylinder charge for HCCI type
of combustion. This has partly helped to alleviate the problem of high hydrocarbons due
to cylinder wall-impingement. This technique has particularly helped to promote
homogenous mixture preparation at high loads [39-45].
MK-combustion: MK combustion or modulated-kinetic combustion was characterized by
low-temperature, premixed combustion system to simultaneously reduce NOx and PM
emissions. Typically, a single injection strategy close to TDC was used, therefore, direct
![Figure 2-2: Mechanism of emission formation in diesel engines [6].](https://thumb-us.123doks.com/thumbv2/123dok_us/1468114.1179877/31.600.107.346.125.405/figure-mechanism-emission-formation-diesel-engines.webp)