1 Classification of playing position in elite junior Australian football using technical skill indicators 1
2
Woods T. Carla*, Veale Jamesb, Fransen Jobc, Robertson Samd, Collier Neile 3
4
aDiscipline of Sport and Exercise Science, James Cook University, Queensland, Australia
5
bAustralian Football League, Melbourne, Victoria
6
cFaculty of Health, University of Technology Sydney, New South Wales, Australia
7
dInstitute of Sport, Exercise & Active Living (ISEAL), Victoria University, Melbourne, Australia
8
eFaculty of Sustainability, Leuphana University Luneburg, Germany
9 10
*Corresponding Author 11
Carl Woods, Discipline of Sport and Exercise Science, James Cook University, Townsville, 12
Queensland, Australia. 13
2 Abstract
15
In team sport, classifying playing position based on a players’ expressed skill sets can provide a guide 16
to talent identification by enabling the recognition of performance attributes relative to playing position. 17
Here, elite junior Australian football (AF) players were a priori classified as one of four common 18
playing positions; forward, midfield, defence, and ruck. Three analysis approaches were used to assess 19
the extent to which 12 in-game skill performance indicators could classify playing position. These were 20
a linear discriminant analysis (LDA), random forest, and a PART decision list. The LDA produced 21
classification accuracy of 56.8%, with class errors ranging from 19.6% (midfielders) to 75.0% (ruck). 22
The random forest model performed at a slightly worse level (51.62%), with class errors ranging from 23
27.8% (midfielders) to 100% (ruck). The decision list revealed six rules capable of classifying playing 24
position at accuracy of 70.1%, with class errors ranging from 14.4% (midfielders) to 100% (ruck). 25
Although the PART decision list produced the greatest relative classification accuracy, the technical 26
skill indicators reported were generally unable to accurately classify players according to their position 27
using the three analysis approaches. This homogeneity of player type may complicate recruitment by 28
constraining talent recruiter’s ability to objectively recognise distinctive positional attributes. 29
30
Keywords: Performance analysis; machine learning; discriminant analysis; random forest; rule 31
3 Introduction
33
Talent identification is an increasingly prominent area of research within the sport sciences (Robertson, 34
Woods, & Gastin, 2015; Rowat, Fenner, & Unnithan, in-press). This emergence may owe to the 35
influence effective talent identification (and subsequent development) programs have toward the 36
attainment of sporting excellence (Vaeyens, Lenoir, Williams, & Philippaerts, 2008). Specifically, the 37
on-field success of professional sporting teams could be linked to their ability to identify, and then 38
recruit, the best available talent, all while working within the various confines imposed by their 39
governing sporting body (e.g. salary caps and draft restrictions). Given these various confines, 40
professional sporting organisations are increasingly turning toward machine learning to assist with the 41
identification of players who possess unique attributes that may offer a competitive advantage (Pion, 42
Hohmann, Liu, Lenoir, & Segers, in-press). These non-linear analysis approaches are often used to 43
predict a junior’s future prospects based on a set of defined explanatory variables collected at specific 44
time points during their development (Pion et al., in-press). To assist with this identification process, it 45
may be beneficial to understand whether a players’ skill profile generated during game-play enables 46
their successful classification into playing positions; especially in team sports where players often 47
perform mixed or multiple roles. This could facilitate the recognition of performance relative to playing 48
position, which would be of assistance to teams who explicitly require a certain type of player (i.e., 49
defender or forward) to fill a structural weakness on their current playing roster. 50
Australian football (AF) is a dynamic team invasion sport that requires players to possess a unique 51
combination of multidimensional performance qualities (Woods, Raynor, Bruce, McDonald, & 52
Robertson, 2016). Its rules do not constrain players to field zones, nor do they enforce an off-side ruling, 53
which consequently allows players to roam across the full playing area. Nonetheless, players are 54
generally classified as four player types; defence, forward, midfield, or ruck, with this partition being 55
further pronounced at the elite senior level (i.e., within the Australian Football League; AFL). Generally 56
however, players often perform idiosyncratic task sets in each of these positions during game-play. For 57
instance, midfielders usually follow the ball around the field in a somewhat nomadic manner, competing 58
4 ‘throw ins’). Their more important technical skills are oriented around obtaining ball possession and 60
providing linkage between the defensive and forward zones. Comparatively, key position players 61
(defenders or forwards) are typically required to ‘mark’ or ‘spoil’ the ball in order to score or defend a 62
goal, respectively. Despite players requiring a minimum level of technical skill (e.g. kicking and 63
handballing) (Woods, Raynor, Bruce, & McDonald, 2015), these unique positional requirements may 64
enable the classification of distinctive player types. However, it is currently unknown whether technical 65
skill involvements acquired during game-play can be used to categorise a player’s subsequent playing 66
position in elite junior AF. The practical benefits of objectively elucidating player types are vast, with 67
the more prominent likely to implicate talent recruitment practices, training specificity (i.e., tailoring 68
practice conditions that target position specific task sets), and/or the recognition of players who can 69
play mixed or multiple positions based on their expressed skill sets. 70
In an attempt to equalise competitive advantages, the AFL annually implements a national draft. This 71
generates a competitive environment whereby AFL talent recruiters attempt to identify juniors who 72
possess uniquely distinguishable performance attributes. To help facilitate this identification process, 73
the AFL, in conjunction with state-based leagues, has established an elite Under 18 years (U18) 74
competition, referred to as the AFL national U18 championships. This four to six week tournament 75
provides talent recruiters with an opportunity to subjectively evaluate potential draftees. In addition to 76
this subjective process, commercial statistical providers; namely Champion Data© (Champion Data©,
77
Melbourne, Australia), provide talent recruiters with objective reports surrounding a players technical 78
skill involvements. These notations often orient around discrete indicators such as the total count of 79
skill involvements (total possessions), inside 50’s (attacking passages of play), tackles, and contested 80
possessions. 81
Partially explaining the subjective recruitment process, Woods, Joyce and Robertson (2016) compared 82
the technical skill involvements of players within this tournament relative to their draft status (drafted 83
or non-drafted). Results indicated distinctive differences in the technical skill involvements of these 84
players, with drafted players accruing a greater count of contested possessions and inside 50’s relative 85
5 delineate the use of technical skill indicators to classify players of differing field positions. This is an 87
important oversight, as it is likely that AFL talent recruiters base their draft choices on structural 88
weaknesses at their club (Woods, Veale, Collier, & Robertson, in-press). For example, an AFL team 89
explicitly requiring a defender may use the national U18 championships to identify a suitable draft 90
candidate. However, this process of objectively identifying (and then ultimately recruiting) talent is 91
based on the assumption that the playing conditions within the national U18 championships, coupled 92
with the technical skill performance indicators provided to talent recruiters, enables the recognition of 93
positional-specific player attributes. Rather contrarily, it is hypothesised that a high level of 94
homogeneity will be present between players of differing field positions given the discrete and broad 95
nature of the technical skill indicators provided to talent recruiters. If demonstrated, this may lead AFL 96
clubs to develop and integrate their own positional-specific performance indicators to assist with the 97
objective recognition of prospective draftees within the AFL national U18 championships. 98
This study aimed to determine whether elite junior AF players could be accurately classified according 99
to their designated playing positions using commonly reported technical skill indicators generated 100
during game-play. To achieve this aim, this study compared the performance of three linear and non-101
linear classification techniques. The subsequent results of this work are likely to implicate both 102
performance analyses and player recruitment processes implemented within the AFL national U18 103
championships. 104
105
Methods 106
Data
107
Technical skill data were acquired from Champion Data© (Champion Data©, Melbourne, Australia).
108
Ethics approval was granted by the relevant Human Research Ethics Committee. The technical 109
indicators reported by this provider are reliable to 99% when analysing the match activities of players 110
within the AFL (O’Shaughnessy, 2006). The dataset contained counts for 12 technical indicators, each 111
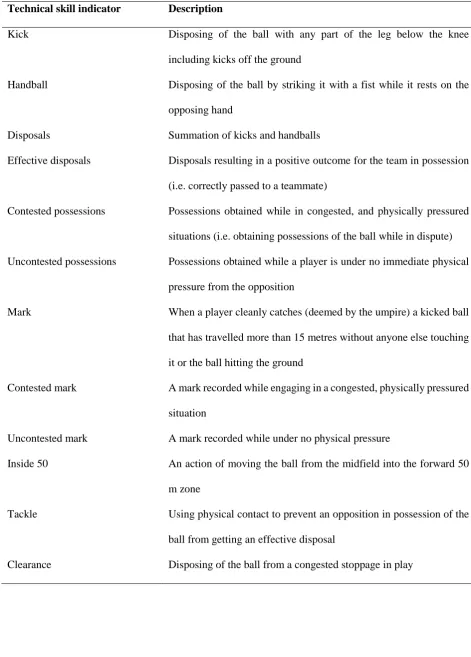
of which are described in Table 1. 112
6 ****INSERT TABLE ONE ABOUT HERE****
114 115
All players (n = 244; 17.6 ± 0.6 y) included in this study competed within the same national U18 116
championships. Players represented teams from each of the eight State Academies. The data were 117
collected from all 16 championship games; resulting in a total of 680 player observations. Although 118
game time durations may have different slightly between players given in-game rotations, each player 119
completed no less than 70% of the total game time in each match. All players were a priori classified 120
into one of four positions: midfield (n = 300 observations), defence (n = 168 observations), forward (n
121
= 171 observations), or ruck (n = 41 observations). The definition of each playing position used here 122
was in accordance with previous research in AF (Veale & Pearce, 2009; Dawson, Hopkinson, Appleby, 123
Stewart, & Roberts, 2004); with a brief description of each position being presented in Table 2. Player 124
position classifications were provided by each State Academy high performance manager prior to the 125
beginning of each game, being matched to the official AFL records provided to talent recruiters. As 126
such, within game positional changes implemented in response to team tactics or other external factors 127
(e.g. injury) were somewhat uncontrollable. The uneven spread in observations stemmed from the 128
nature of positional allocations in AF (i.e., fewer key position players and ruckman are selected in a 129
typical team compared to midfielders). 130
131
****INSERT TABLE TWO ABOUT HERE**** 132
133
Statistical Analysis
134
All analyses were undertaken using R version 3.2.2 (R Core Team, 2015). Descriptive statistics (mean 135
and standard deviation; SD) for each indicator were calculated for each playing position. These 136
indicators were visualised using a basic scatterplot overlaid within a violin plot to show the underlying 137
distribution of the data. The violin plot functions by showing the probability density distributions of the 138
data. In doing so, it provides an in-depth visualisation of the data with respect to properties such as 139
skewness and modality when compared to other forms of visualisations (Spitzer, Wilderhain, 140
7 Prior to classification analyses being performed, the mean of repeated observations were calculated, 142
with the final dataset containing observations from 211 players: 52 defenders, 50 forwards, 97 143
midfielders, and 12 ruckmen. The first classification technique used was a linear discriminant analysis 144
(LDA), classifying players in the dataset using the lda function in the ‘MASS’ package (Venables & 145
Ripley, 2002). An LDA can be used to classify a target sample of predictors against a priori classes by 146
minimising the probability of a posteriori misclassification. The technical skill indicators were coded 147
as the explanatory variables, while a priori playing position was coded as the categorical response 148
variable (class label). Results of this analysis were reported in the form of overall classification 149
accuracy, as well as a confusion matrix. 150
Secondly, the random forest algorithm was used to classify the players in the dataset using the 151
‘randomForest’ package (Liaw & Wiener, 2002). The random forest algorithm is a non-linear machine 152
learning technique used for classification and regression. It functions by growing a collection of 153
decision trees, and using a random sample generated from a larger training sample, calculates the mode 154
of the classes of the individual trees and ranking of all classifiers. From the output of the random forest 155
model, dissimilarities of the data were plotted using classic multidimensional scaling using the cmdscale
156
function in the ‘stats’ package (R Core Team, 2015). The distance matrix used in this analysis was 157
derived from the proximity values of the random forest analysis. The dissimilarities for each player 158
were calculated as one minus the proximity values (Liaw & Wiener, 2002). These data were visualised 159
using ‘ggplot2’ (Wickham, 2009). Additionally, the mean decrease in accuracy of each indicator was 160
calculated and plotted. This measure is one way to estimate the importance of each indicator for the 161
classification. The mean decrease in accuracy is determined during the out of bag (OOB) error 162
calculation phase, which is a method to measure the classification error of the random forest algorithm. 163
In this case, the more the accuracy of the random forest decreases due to the exclusion of a single 164
indicator, the more important that indicator is for the classification. It follows that indicators with larger 165
decreases in mean accuracy are more important than other indicators in the set which have lower scores. 166
Lastly, a PART decision list (Frank & Witten, 1998) was used to generate a set of rules that best 167
8 each rule, with five-fold cross validation also undertaken in order to prevent overfitting. Results were 169
reported in the form of overall classification accuracy, as well as a confusion matrix, with corresponding 170
rules describing the dataset also presented. 171
172
Results 173
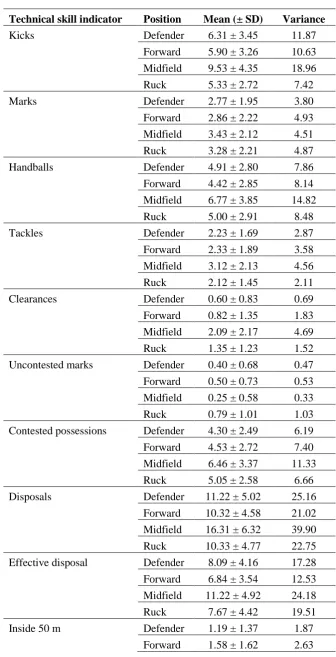
Players recorded a mean of 61.84 ± 27.53 technical skill involvements during game-play. The midfield 174
players had the highest mean values in 11 of the 12 technical skill indicators (Table 3; Figure 1). 175
Midfield players also had the highest variance in ten of the 12 indicators (Table 3). 176
177
****INSERT TABLE 3 ABOUT HERE**** 178
179
****INSERT FIGURE 1 ABOUT HERE**** 180
181
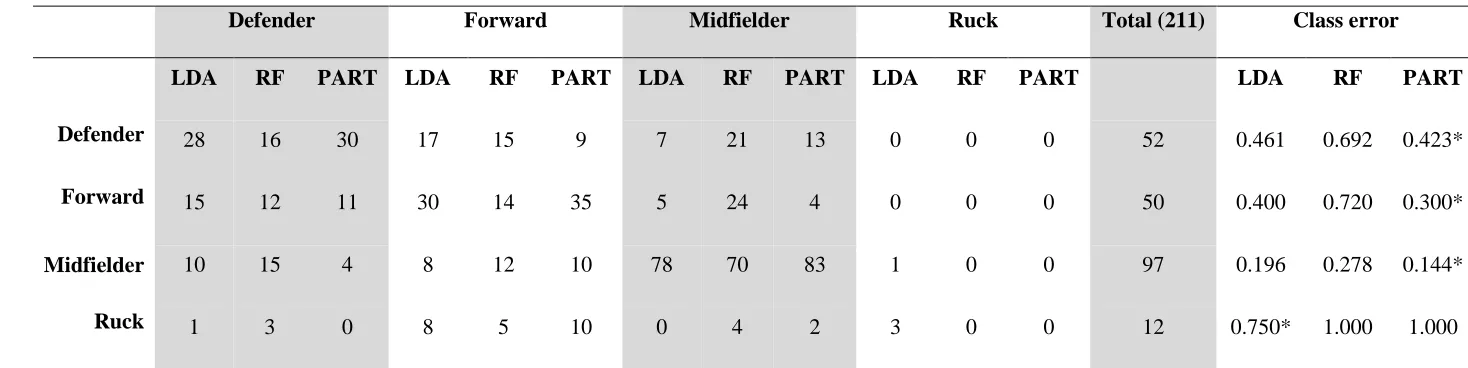
As shown in the Table 4, the LDA classified most players as midfielders, less than in the a priori case. 182
The classification accuracy for the LDA was 56.8%, with the class error rate being lowest for the 183
midfield players (19.6%), and highest for the ruckmen (75.0%). The class error was similar for both 184
forwards (40.0%) and defenders (46.1%). 185
186
****INSERT TABLE 4 ABOUT HERE**** 187
188
Comparatively, the OOB error rate for the random forest model was 52.61%. The class error rate was 189
lowest for the midfield players (27.8%), and highest for the ruckmen (100%; Table 4). The class error 190
rates for defenders and forwards were similar (69.2% and 72%, respectively). No ruckmen were 191
classified according to their a priori classification; with three being classified as defenders, five as 192
forwards, and four as midfielders. 193
The variable importance plot shows three groups of indicators that had similar effects on the mean 194
9 the players into a field position; uncontested possessions, clearances, disposals, kicks, and inside 50’s 196
(midfield task set). The second group included contested marks, effective disposals, contested 197
possessions, and tackles (defender task set). The third group included uncontested marks, marks, 198
handballs and the State Academy that a player represented. The classic multidimensional scaling of the 199
proximity values shows the strong clustering of defender and forward players, and the high variance 200
within the midfield set (Figure 3). This plot shows the same data (from the random forest model) but 201
the left panel shows the a priori classification and the right shows the random forest classification. 202
203
****INSERT FIGURE 2 ABOUT HERE**** 204
205
****INSERT FIGURE 3 ABOUT HERE**** 206
207
Results from the PART decision list revealed six rules capable of classifying playing position at 208
accuracy of 70.1% (148 of 211 players). The rules were as presented below, with the values in the 209
parentheses representing the true and false positive frequencies respectively for each rule as noted in 210
the database: 211
• Rule 1: Disposals > 14.4 AND contested mark ≤ 0.4 THEN: Midfielder (53.0 / 3.0) 212
• Rule 2: Uncontested possession ≤ 10 AND inside 50 ≤ 1.2 AND contested mark ≤ 0.4 AND 213
uncontested mark ≤ 2.4 AND uncontested possession > 4.3 THEN: Defender (20.0 / 6.0) 214
• Rule 3: Uncontested possession ≤ 10 AND kick > 5.3 AND inside 50 > 1 AND effective 215
disposals ≤ 10 AND contested mark > 0.2 THEN: Forward (33.0 / 15.0) 216
• Rule 4: Kick > 5.3 AND inside 50 > 1: Midfielder (53.0 / 3.0) 217
• Rule 5: Kick ≤ 5.4: Forward (31.0 / 14.0) 218
• Rule 6: ELSE: Defender (25.0 / 9.0) 219
As shown in Table 4, the class error rates for each playing position ranged from 14.4% (midfielders) to 220
100% (ruck). Cross-validation results revealed a decrease in overall classification accuracy of 11.3% to 221
10 223
Discussion 224
The aim of this study was to investigate whether talent identified junior AF players could be accurately 225
classified into their designated playing positions based upon technical skill indicators acquired from the 226
AFL national U18 championships. Despite the idiosyncratic requirements of each playing position, a 227
high level of player homogeneity was hypothesised given the discrete and broad nature of the technical 228
skill indicators. Results partially supported this hypothesis, with the LDA (56.8%) and random forest 229
model (52.61%) reflecting poor a priori classification accuracy when compared to the PART decision 230
list (70.1%). Thus, relative to the LDA and random forest, sport scientists may wish to consider using 231
rule induction (PART decision list) when classifying player types in other team sports, as it may offer 232
a more granular insight into positional characteristics relative to other linear and/or non-linear 233
approaches. From the identified classes for each model, the midfielders demonstrated the smallest 234
classification error, being followed by defenders and forwards. Generally however, these results 235
demonstrate an inability to accurately classify playing position when using the technical skill indicators 236
provided to talent recruiters following the AFL national U18 championships. Subsequently, AFL talent 237
recruiters may consider the use of tailored technical indicators specific to positional requirements. This 238
may increase the likelihood of recognising unique player attributes relative to playing position when 239
coupled with results stemming from supplementary talent identification practices (i.e., combine testing) 240
(Robertson et al., 2015). 241
The homogeneity across playing positions suggests that AFL talent recruiters may encounter difficulties 242
when using the technical skill indicators described here to objectively identify juniors capable of playing 243
a specialised field position. More directly, an AFL talent recruiter looking to draft a defender who 244
possesses unique attributes relative to their player type may not be able to rely upon the objective data 245
stemming from the commercial performance analyses. Thus, they may have to rely upon subjective 246
evaluations and/or measurements recorded external to game-play (i.e., combine testing results). This 247
may be problematic, particularly for less experienced talent recruiters, as reliance upon subjectivity for 248
11 investments (Meylan, Cronin, Oliver, & Hughes, 2010). It is recommended that AFL clubs conduct 250
their own performance analyses during the national U18 championships using tailored technical skill 251
indicators specific to player and positional types. Conversely, commercial statistical providers may look 252
to increase the depth of indicators they report upon within this elite junior tournament. For example, 253
counts surrounding goal ‘conversion percentage’, ‘chop-out marks’, ‘spoils’, or ‘tackles inside 50’ may 254
increase the distinction between player types / positions. 255
Beyond the addition of tailored technical skill indicators, these results yield implications for coaching 256
strategies used with the AFL national U18 championships. In its current state, this elite junior 257
tournament may not facilitate an optimal environment to enable key position defenders and forwards to 258
exhibit position specific attributes. In light of this, it is suggested that a greater emphasis should be 259
directed toward showcasing a key defenders and forwards positional skill sets through the design of 260
coaching strategies that enable the aforementioned to occur. Further, ‘flooding’ (i.e., players being 261
instructed to crowd an oppositions forward zone to limit space) should be avoided in this elite junior 262
competition, as such a team strategy may exacerbate the already apparent homogeneity evident across 263
playing positions; further complicating the objective identification process facing AFL talent recruiters. 264
These results (somewhat) complement those presented by Veale and Pearce (2009) who profiled the 265
physical characteristics of U18 AF players according to their playing positions. In their study, midfield 266
players were characterised by a greater total distance run during game-play when compared to key 267
position forwards and defenders. However, key position forwards and defenders generated similar 268
physical activity profiles, demonstrating a clear difference in running requirements between midfielders 269
and key position forwards and defenders (Veale & Pearce, 2009). When coupled with the current 270
findings, it can be postulated that the physical and technical skill activity profiles of key position 271
forward and defenders are difficult to differentiate; likely due to the fact that the defenders’ movement 272
patterns and skill involvements would be partly controlled by the forward they are attempting to defend. 273
However, differing to the physical results presented by Veale and Pearce (2009), the present work found 274
that a subset of players classified a priori as defenders and forwards were respectively classified as 275
12 running characteristics, certain midfielders and defenders and forwards may possess similar technical 277
skill characteristics manifested via the indictors reported in this study. 278
Despite the practical utility of this work, it is not without limitations that require acknowledgement. It 279
is not uncommon for AF coaches to rotate players through the midfield from forward or defensive 280
positions. Acknowledging this, it is possible that players within the misclassified subsets were included 281
within regular midfield rotations. Given that we were unable to control for this in-game rotation, it is 282
possible that the misclassified subset of forwards and defenders were positioned in the midfield at some 283
stage during game-play; diluting their technical skill profiles. To account for in-game rotations or 284
unique team strategies, future work may wish to consider classifying player positions at the beginning 285
of each quarter to enable ‘real-time’ classification. Further, given the primary focus of this elite junior 286
tournament is to showcase prospective talent, it is possible that coaches actively placed players in 287
different positions to showcase their potential versatility to AFL talent recruiters. This versatility 288
strategy could have therefore diluted the idiosyncratic positional characteristics, as players may have 289
reverted back to the task sets they are more suited regardless of playing position, incurring the high 290
levels of misclassification observed here. Thus, future work is encouraged to extend these observations 291
by investigating the classification of playing positions in the AFL, where such versatility strategies may 292
not be as apparent given the speculated need for position specificity. Lastly, future work may look to 293
extend the skill indicators described in this study to include ‘goal conversion percentage’, ‘chop-out 294
marks’, ‘spoils’ and/or ‘tackles inside 50’ (non-exhaustive suggestions) in addition to quantifying the 295
physical movement patterns of players in differing positions. This may offer a more granular insight 296
into the positional idiosyncrasies with regards to player skill and physical profiles. 297
Conclusion 298
This study shows a high level of homogeneity across playing positions when using technical skill 299
indicators acquired within the AFL national U18 championships, delineated using three linear and non-300
linear statistical techniques. Given this, AFL talent recruiters may encounter difficulties when solely 301
13 distinctive positional attributes. These results present clear practical implications for AFL talent 303
recruiters and performance analysts, which are discussed below. 304
Practical Implications 305
Firstly, coaches may wish promote strategies that enable players in the AFL national U18 championship 306
to showcase position-specific attributes, while avoiding strategies that exacerbate player homogeneity 307
(e.g. ‘flooding’). Secondly, commercial data providers and/or AFL clubs should look to increase the 308
specificity of technical skill indicators to optimise the objective recognition of position-specific 309
attributes. By addressing these two points, AFL talent recruiters may be provided with more insightful 310
data of use for the identification, and subsequent drafting, of juniors capable of adding competitive 311
value to their current playing roster. 312
Acknowledgements 313
The authors would like to thank the Australian Football League Talent Pathway for assistance during 314
data collection. No financial support was required or provided for this study. 315
References 316
Dawson, B., Hopkinson, R., Appleby, B., Stewart, G., & Roberts, C. (2004). Player movement 317
patterns and game activities in the Australian Football League. Journal of Science and Medicine in
318
Sport, 7, 278-291 319
Frank, E., & Witten, I. H. (1998). Generating accurate rule sets without global optimization. In: 320
Fifteenth International Conference on Machine Learning, 144-151. 321
Liaw, A., & Wiener, M. (2002). Classification and regression by randonForest. R News, 2, 18-22. 322
Meylan, C., Cronin, J., Oliver, J., & Hughes, M. (2010). Talent identification in soccer: the role of 323
maturity status on physical, physiological and technical characteristics. International Journal of
324
Sports Science and Coaching, 5, 571-592. 325
O’Shaughnessy D. M. (2006). Possessions versus position: strategic evaluation in AFL. Journal of
326
14 Pion, J., Hohmann, A., Liu, T., Lenoir, M., & Segers, V. (in-press). Predictive models reduce talent 328
development costs in female gymnastics. Journal of Sport Sciences [Epub ahead of print]. 329
R Core Team. (2015). R: a language and environment for statistical computing. R Foundation for 330
Statistical Computing, Vienna, Austria. 331
Robertson, S., Woods, C., & Gastin, P. (2015). Predicting higher selection in elite junior Australian 332
rules football: the influence of physical performance anthropometric attributes. Journal of Science
333
and Medicine in Sport, 18, 601-606. 334
Rowat, O., Fenner, J., & Unnithan, V. (in-press). Technical and physical determinants of soccer 335
match-play performance in elite youth soccer players. Journal of Sports Medicine and Physical
336
Fitness [Epub ahead of print]. 337
Spitzer, M., Wilderhain, J., Rappsilber, J., & Tyers, M. (2014). BoxPlotR: a web tool for generation 338
of box plots. Nature Methods, 11, 121-122. 339
Vaeyens, R., Lenoir, M., Williams, M. A., & Philippaerts, R. M. (2008). Talent identification and 340
development programs in sport: current models and future directions. Sports Medicine, 38, 703-717. 341
Veale, J. P., & Pearce, A., J. (2009). Physiological Responses of Elite Junior Australian Rules 342
Footballers During Match-Play. Journal of Sports Science & Medicine, 8, 314-319. 343
Venbles, W. N., & Ripley B. D. (2002). Modern Applied Statistics with S, 2nd ed., New York, 344
Springer-Verlag. 345
Wickham, H. (2009). ggplot2: elegant graphics for data analysis, New York, Springer. 346
Woods, C. T., Joyce, C., & Robertson, S. (2016a). What are talent scouts actually identifying? 347
Investigating the physical and technical skill match activity profiles of drafted and non-drafted U18 348
Australian footballers. Journal of Science and Medicine in Sport, (in-press), doi: 349
15 Woods, C. T., Raynor, A. J., Bruce, L. McDonald, Z. & Robertson, S. (2016b). The application of a 351
multi-dimensional assessment approach to talent identification in Australian football. Journal of
352
Sports Sciences, (in-press), doi: 10.1080/02640414.2016.1142668 353
Woods, C. T., Raynor, A. J., Bruce, L., & McDonald, Z. (2015). The use of skill tests to predict 354
status in junior Australian football. Journal of Sports Sciences, 33, 1132-1140 355
Woods, C. T., Veale, J., Collier, N., & Robertson, S. (in-press). The use of player physical and 356
technical skill match activity profiles to predict position in the Australian football league draft. 357
16 Figure 1. Technical skill indicators across the four player classification types (positions)
359
Note: The points represent observations of players. The points are horizontally ‘jittered’ to show the 360
reader where most points are distributed. The solid line represents a violin plot of the same data. A 361
violin plot represents the probability density of the data within each position class: defender (D), 362
forward (F), midfield (M), and ruck (R). “Un. mark” uncontested marks; “Con. possession” contested 363
possessions; “Eff. disposal” effective disposal; “Un. marks” uncontested marks; “Un. possession” 364
uncontested possession. 365
366
Figure 2. Type I variable importance plot showing the mean decrease in accuracy for each predictor 367
(technical skill indicator) when it is excluded from the model 368
Note: “Un. mark” uncontested marks; “Cont. possession” contested possessions; “Eff. disposal” 369
effective disposal; “Un. marks” uncontested marks; “Un. possession” uncontested possession. 370
371
Figure 3. Multidimensional scaling plot (MDS) of the proximity matrix produced by the random forests 372
model 373
Note. The left panel shows the result of the random forest model with each player labelled with their a
374
priori position classification. The right panel shows result of the random forest model with each player 375
labelled with their classification derived from the model. “D” defender; “F” forward; “M: midfielder; 376
17 Table 1. The technical skill indicators and corresponding description as used within this study
378
Technical skill indicator Description
Kick Disposing of the ball with any part of the leg below the knee
including kicks off the ground
Handball Disposing of the ball by striking it with a fist while it rests on the
opposing hand
Disposals Summation of kicks and handballs
Effective disposals Disposals resulting in a positive outcome for the team in possession
(i.e. correctly passed to a teammate)
Contested possessions Possessions obtained while in congested, and physically pressured
situations (i.e. obtaining possessions of the ball while in dispute)
Uncontested possessions Possessions obtained while a player is under no immediate physical
pressure from the opposition
Mark When a player cleanly catches (deemed by the umpire) a kicked ball
that has travelled more than 15 metres without anyone else touching
it or the ball hitting the ground
Contested mark A mark recorded while engaging in a congested, physically pressured
situation
Uncontested mark A mark recorded while under no physical pressure
Inside 50 An action of moving the ball from the midfield into the forward 50
m zone
Tackle Using physical contact to prevent an opposition in possession of the
ball from getting an effective disposal
Clearance Disposing of the ball from a congested stoppage in play
379 380
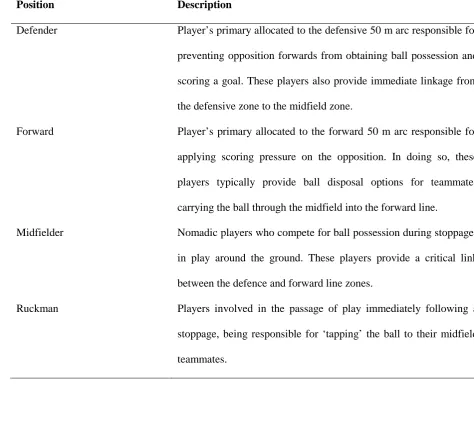
18 Table 2. Description of each playing position used within this study
382
Position Description
Defender Player’s primary allocated to the defensive 50 m arc responsible for
preventing opposition forwards from obtaining ball possession and
scoring a goal. These players also provide immediate linkage from
the defensive zone to the midfield zone.
Forward Player’s primary allocated to the forward 50 m arc responsible for
applying scoring pressure on the opposition. In doing so, these
players typically provide ball disposal options for teammates
carrying the ball through the midfield into the forward line.
Midfielder Nomadic players who compete for ball possession during stoppages
in play around the ground. These players provide a critical link
between the defence and forward line zones.
Ruckman Players involved in the passage of play immediately following a
stoppage, being responsible for ‘tapping’ the ball to their midfield
teammates.
19 Table 3. Descriptive statistics (mean ± SD, variance) for each a priori position classification and 384
technical skill indicator 385
Technical skill indicator Position Mean (± SD) Variance
Kicks Defender 6.31 ± 3.45 11.87
Forward 5.90 ± 3.26 10.63 Midfield 9.53 ± 4.35 18.96
Ruck 5.33 ± 2.72 7.42
Marks Defender 2.77 ± 1.95 3.80
Forward 2.86 ± 2.22 4.93
Midfield 3.43 ± 2.12 4.51 Ruck 3.28 ± 2.21 4.87
Handballs Defender 4.91 ± 2.80 7.86
Forward 4.42 ± 2.85 8.14 Midfield 6.77 ± 3.85 14.82
Ruck 5.00 ± 2.91 8.48
Tackles Defender 2.23 ± 1.69 2.87
Forward 2.33 ± 1.89 3.58
Midfield 3.12 ± 2.13 4.56 Ruck 2.12 ± 1.45 2.11
Clearances Defender 0.60 ± 0.83 0.69
Forward 0.82 ± 1.35 1.83
Midfield 2.09 ± 2.17 4.69 Ruck 1.35 ± 1.23 1.52 Uncontested marks Defender 0.40 ± 0.68 0.47
Forward 0.50 ± 0.73 0.53
Midfield 0.25 ± 0.58 0.33 Ruck 0.79 ± 1.01 1.03 Contested possessions Defender 4.30 ± 2.49 6.19
Forward 4.53 ± 2.72 7.40
Midfield 6.46 ± 3.37 11.33 Ruck 5.05 ± 2.58 6.66
Disposals Defender 11.22 ± 5.02 25.16
Forward 10.32 ± 4.58 21.02
Midfield 16.31 ± 6.32 39.90 Ruck 10.33 ± 4.77 22.75 Effective disposal Defender 8.09 ± 4.16 17.28
Forward 6.84 ± 3.54 12.53
Midfield 11.22 ± 4.92 24.18 Ruck 7.67 ± 4.42 19.51
Inside 50 m Defender 1.19 ± 1.37 1.87
20 Midfield 2.65 ± 1.93 3.71
Ruck 1.47 ± 1.28 1.64 Uncontested marks Defender 2.37 ± 1.70 2.90
Forward 2.35 ± 1.92 3.70
Midfield 3.18 ± 2.03 4.13 Ruck 2.49 ± 2.00 4.02 Uncontested possession Defender 6.78 ± 3.78 14.28
Forward 5.67 ± 3.30 10.91
21 Table 4. Confusion matrices for the LDA, random forest (RF) and PART decision list classifying players using technical skill indicators
387
Defender Forward Midfielder Ruck Total (211) Class error
LDA RF PART LDA RF PART LDA RF PART LDA RF PART LDA RF PART
Defender 28 16 30 17 15 9 7 21 13 0 0 0 52 0.461 0.692 0.423*
Forward 15 12 11 30 14 35 5 24 4 0 0 0 50 0.400 0.720 0.300*
Midfielder 10 15 4 8 12 10 78 70 83 1 0 0 97 0.196 0.278 0.144*
Ruck 1 3 0 8 5 10 0 4 2 3 0 0 12 0.750* 1.000 1.000