Article
Central and Peripheral Fatigue Related to the Type of
Exercise
José Trinidad Quezada Chacón 1, Edson Francisco Estrada Meneses 2 Gustavo Sierra Muñiz 2 Arnulfo Ramos-Jimenez 2, * Felipe Reynoso Sánchez 3 Janeth Miranda Mendoza 2 and Germán Hernánez Cruz 2
1 Instituto de Ciencias Biomédicas, Universidad Autónoma de Ciudad Juárez, Chihuahua, Mexico, PC 32310; jose.quezada@uacj.mx (J.T.Q.CH.); eestrada@uacj.mx (E.F.E.M.); gusierra@uacj.mx (G.S.M.);
aramos@uacj.mx (A.R.-J.).
2 Laboratorio de Rendimiento Humano, Facultad de Organización Deportiva, Universidad Autónoma de Nuevo León, Monterrey, Nuevo León, México, PC 66455; german.hernandezcrz@uanl.edu.mx (G.H.C.); flor.mirandamn@uanl.edu.mx (F.M.M.).
3 Departamento de Ciencias Sociales y Humanidades, Universidad Autónoma de Occidente, Unidad los Mochis, Sinaloa, México, PC 81223; felipe.reynoso@udo.mx (F.R.S.)
* Correspondence: aramos@uacj.mx; Tel.: +52-656-167-9309.
Abstract: Athletes are exposed to high-intensity loads to promote athletic performance, however without appropriate evaluation for its effects. This study investigates the effects of four types of exhaustion exercises on Heart Rate Variability (HRV) and Poincaré features as markers of central fatigue; Creatine Kinase (CK) and blood lactate concentrations ([LA-]b) as biomarkers of peripheral fatigue. To achieve this purpose, ten healthy volunteers were exposed to exhaustive exercise using isotonic-, isometric-, aerobic-, and anaerobic-fatigue protocols. HRV Poincaré features, standard deviation of instantaneous beat-to-beat R-R interval variability (SD1) and standard deviation of continuous long-term R-R interval variability (SD2) variables were collected. Central fatigue was tested through the sympathetic stress index (SS) and the sympathetic and parasympathetic index (SS/SD1). Blood samples were collected at the beginning and at the end of the exercises to determine CK and [LA-]b. The SD1 decreased in each exercise protocol, while the SS and SS/SD1 increased. [LA-]b and CK increased at the end of each protocol and correlated with SD1 and SS/SD1. HRV, CK, and [LA-]b are acute markers to detect, both central and peripheral fatigue; sensitive to the type, duration, and intensity of exercise, being HRV a novel noninvasive marker, simple and useful for sports coaches and athletes.
Keywords: Acute Physical Stress; Sports Performance; Heart Rate Variability; Physical Exhaustion.
1. Introduction
Athletes are exposed continuously to systematic and high-intensity loads to promote physical development and high athletic performance, however, most of the time, without scientific
support for its effects, relying exclusively by empirical experience [1]. Isotonic, isometric and isokinetic loads applied for the development of muscle mass, muscle resistance, power or maximal
strength are used in a daily basis. However, there is still a lack of knowledge to understand if exercise loads are efficiently applied and correctly assimilated by the athlete, avoiding excessive fatigue and
overtraining [2]. Nowadays, several physiological and biochemical markers of acute and chronic physical fatigue have been independently tested, among them, heart rate (HR), its variability (HRV:
time series between heartbeat and beat), blood concentrations of Creatine Kinase (CK) and lactate ([LA-]b) [3-5] that have been used to analyze the physiological components of the fatigue process.
Being HRV a novel, easy and non-invasive tool to measure the autonomic nervous system (ANS) and central fatigue [6].
Recent studies show the capability of HRV to provide insights about the ability of the ANS to adapt to the physical and psychological stress of the environment [7]. Currently the literature reports a large number of HRV indicators to assess the autonomic balance, and includes them in three
dimensions, lineal and no lineal analysis: Time domain (Mean NN, SDNN, rMSSD, PNN50, among others) [8,9], frequency domain (VLF, LF, HF, among others) [9], Poincaré diagram (SD1, SD2 and
ratio SD2/SD1) [9], non-lineal and multiscale analysis (DFA, ApEn, SampEn, among others). Orellana, et al., in 2015 [6] also established two new simple indicators to interpret HRV, showing high
sensitivity for the autonomic balance in athletes: Stress score (SS) and sympathetic-parasympathetic ratio (SS/SD1).
Peripheral fatigue can be analyzed by biological markers such as CK and [LA-]b. CK is an intracellular protein (cytosol and mitochondria) commonly used to determine cardiac and skeletal tissue damage, increasing in blood post-intense exercise [3,10]. In other hand, [LA-]b, is the
biochemical marker most commonly used in sport practice to determine fatigue, it increases in a linear relationship as the exercise intensity increases and more fast twitch fibers are recruited [11].
As noted above, HR, HRV, CK, and [LA-]b have been studied independently to diagnose acute physical stress, fatigue, as well as the degree of recovery after different intensity loads and
types of exercise. However, we do not know how these markers are related to each other, and if all of them provide us with reliable acute information during high-intensity loads, so that the athletes
and coaches can benefit from them during sports practice, especially from the non-invasive procedures.
The purpose of this study was to investigate the effects of four different types of exhaustion exercises on HRV and Poincaré features as markers of central fatigue, and CK and [LA-]b as biomarkers of peripheral fatigue.
2. Materials and Methods
2.1. Participants
Ten apparently healthy volunteers males participated in the study (age = 21.1 ± 1.72 years,
height = 1.73 ± 0.05 m, weight = 81.1 ± 16.75 kg), being handball university-level players. The inclusion criteria were: age 18 years, no smoking, no alcohol (100 ml/week) or other drugs, not being under hormonal or dietary treatments to gain or lose weight or having physical impediments and injuries
that make it impossible to perform maximum exercise tests. As indicated in Figure 1, in the first session the protocol procedures were explained at the participants, and if they agreed to participate,
they were asked to sign the informed consent letter. Subsequently, to know their health status they were asked to answer a general health questionnaire, as well as the Physical Activity Readiness
Figure 1. Protocol design.
2.2. Experimental design
Participants visit the lab in six different days (Figure 1); the first visit was for filled
questionnaires (PAR-Q+, general health questionnaire, and letter of informed consent), and anthropometric measurements, requesting them not to perform any exercise during the study or drinking alcohol, coffee or tea. In the second session, the participants perform an incremental exercise
test (9-15 min). Subsequently, under a block design, the participants were randomly placed into four different maximum exercise tests (MET: sessions 3-6), and for its own characteristics with different
duration: aerobic test (5-9 min), anaerobic test (2-3 min), isometric strength test (0.7-2.3 min), and isotonic strength test (2-7 min). The participants attended the laboratory to perform any MET
separated by at least 72 h each. In each of the four MET HR, HRV, as well as [LA-]b and CK concentrations were recorded. Laboratory temperature was controlled between 23-24 °C.
2.3. Incremental exercise test
The incremental exercise test was carried out according to ACSM´s guidelines for exercise testing and prescription [12] to determine the maximum workload and the maximum O2 consumption (VO2max), using an ergometric bicycle (Monark ergomedic 828 E, Monark exercise AB, 105 Vansbro, Sweden). The workload started at a resistance of 1 kp (kilopond) with increments of 1 kp every 3
minutes until voluntary exhaustion. The cadence on the bicycle was maintained at 60-70 rpm. The VO2max was measured with a gas analyzer (Cortex MetaLyzer® 3B, Germany), before calibration of the flow sensor and the concentrations of O2 and CO2, as dictated by the manufacturer's manual [13].
The test was considered maximum when at least three of the following parameters were met: voluntary fatigue (could not maintain the cadence 60 rpm for more than 15 seconds), Respiratory
exchange ratio (RER) greater than 1.1, [LA-]b greater than 4.0 mM, perception of effort 8 (Borg CR-10 Scale), HR 90% of the theoretical for their age, and plateau in the VO2max (increments lower than
150 ml/min despite an increment in workload).
2.4. Aerobic test
A VIAsprint 150 P cycle ergometer (Franklin Lakes, NJ, US) was used for this test. The test started with a resistance of 100 watts during the first two minutes, with increments of 25 watts every minute and a cadence of 60-70 rpm. The test ended when the participant could not keep the cadence
60 rpm for more than 15 seconds.
2.5. Anaerobic test
was 60-70 rpm. The test was finished when the participant could not maintain the cadence 60 rpm for more than 15 seconds.
2.6. Isotonic test
Participants were placed in a sitting position with his dominant leg next to the equipment to measure muscle strength (Primus RS, Maryland, US), the dynamo of the equipment placed at knee
height. Before the isotonic or isometric test, a maximal voluntary contraction (MVC) of the quadriceps was performed for five seconds at a 45º angle, establishing during this procedure the maximum peak
of the MVC. Subsequently, the equipment was programmed with 30% of the MVC registered above, so that the participant could develop repeated contractions until fatigue, with a frequency of 30 rpm,
registered with a digital metronome (Korg MA-1, UK), and with a 90º range of motion. The test was finished when the participant could not maintain the cadence 30 rpm for more than 5 seconds.
2.7. Isometric test
The equipment was programmed at the 100% of the MVC indicated above, then a single isometric contraction was performed at a 45º angle until the participant was unable to sustain the
maximum programmed load for more than 5 seconds.
2.8. Anthropometric, [LA-]b, CK, HR and HRV determinations
The body weight was recorded with an electronic scale (SECA 656 digital scale, Hamburg,
Germany), and the stature with a wall stadiometer (Portable SECA 206 stadiometer, Hamburg, Germany), both of them with subjects lightly dressed and barefoot. To analyze the [LA-]b
concentrations, capillary blood samples (25 µL from fingertip) were obtained before and immediately after the tests with a heparinized capillary glass tube and analyzed immediately with a lactate
analyzer (YSI Model 1500, YSI incorporated, Yellow Springs, OH). To analyze the CK concentrations, capillary blood samples (500 µL from fingertip) were obtained in recumbent position before the exercise, and 10 minutes after the test was completed [14] and analyzed immediately using the
Reflotron equipment (Boehringer Mannheim GmbH, Mannheim, Germany).
The HR and HRV were recorded with a short-range radio telemetry device (POLAR TEAM2,
Kempele, Finland) at three times; before, during and after the test: for 5 minutes at basal condition (supine position), during the exercise test, and 5 minutes post recovery (supine position). To analyze
the degree of participation of the autonomic nervous system on HRV, standard deviation of instantaneous beat-to-beat R-R interval variability (SD1), and standard deviation of continuous
long-term R-R interval variability (SD2) were considered, according to the Poincaré diagram [7]: SD1, which is indicator of the participation of the parasympathetic nervous system (PNS), the inverse of
SD2 called stress score (SS: 1000 x 1/SD2) [6], which is indicative of the participation of the sympathetic nervous system (SNS), and the quotient between SS and SD1 (SS/SD1) which dictates
the relationship between the SNS and PNS [6]. The raw data of the HRV were manually analyzed to eliminate non-physiological values, then SD1, SD2 and the Poincaré model were obtained with the Kubios HRV software version 3.1 (University of Kuopio, Kuopio, Finland) using a low threshold
2.9. Statistical analysis
The Z Kolmogorov-Smirnov was used to analyze the data distribution. Once the normal distribution was verified, the parametric analyzes were carried out. To analyze the possible effect of the nutritional status measured by the Body Mass Index (BMI: kg/m2), and the aerobic capacity measured by the VO2max, on the dependent variables (SD1, SD2, SS, SS/SP, [LA-]b and CK), a multivariate analysis was carried out, including in the model the BMI and VO2max as covariables. Subsequently, to analyze the effect of time (baseline, exercise, and recovery) between treatments (exercise protocols), the general linear model (GLM) of repeated measures was used, time as intra-subject variable and protocols as internal factors. The differences between times were analyzed by the Bonferroni test. Additionally, a one-way ANOVA was performed to analyze the differences between treatments independently. When the variances between the treatments were different, the post hoc tests were performed by Tamhane T2, otherwise by Tukey. Finally, a bivariate Pearson correlation between the different variables was performed. The data in Tables are presented in means ± SD (CI 95%). The analyzes were performed with the statistical software SPSS v21 (SPSS Inc, Chicago, IL).
3. Results
3.1. Heart rate variability
Through the multivariate analysis we observed that the BMI (26.5 ± 4.0 kg/m2) and VO2max (47.8 ± 6.42 mL/kg/min) did not influence the differences in SD1, SS and SS/SD1 between protocols
and times; however, in the anaerobic test it was observed that the higher the VO2max of the participants, the lower the CK plasma concentrations (r = – 0.72, p <0.05). As observed in Table 1, the
SD1 of the aerobic protocol during recovery was different to the isotonic and isometric (p <0.05). There were no significant statistical differences between the SS protocols at any time: baseline, exercise, and
recovery. The SS/SD1 index was different only during the anaerobic exercise compared to the isotonic and isometric (p <0.05).
Table 1. Differences in autonomic nervous system activation between exercise protocols.
a) Isotonic b) Isometric c) Anaerobic d) Aerobic Partial
2
SD1
Basal 49±22 (33-64) 59±33 (35-83) 78±68 (29-126) 56±17 (43-68) 0.07
Exercise 13±19 (0-27) 13±9 (7-20) 13±30 (-8-34) 5±4 (2-8) 0.04
Recovery 39±25 (21-57) 54±37 (27-81) 18±32 (-5-40) 10±11 (2-18)ª,b 0.30 SS
Basal 10±3 (8-12) 11±4 (8-13) 8±4 (6-11) 8±2 (6-9) 0.13
Exercise 13±5 (9-16) 11±6 (7-15) 17±10 (10-24) 12±8 (6-18) 0.10
Recovery 13±5 (9-17) 13±12 (4-21) 22±17 (10-34) 22±11 (14-30) 0.14 SS/SD1
Basal 0.3±0.3 (0.1-0.5) 0.3±0.4 (0.1-0.6) 0.2 ± 0.2 (0.1-0.4) 0.1±0.1 (0.1-0.2) 0.13 Exercise 2.3±1.8 (1.1-3.6) 1.6±1.6 (0.4-2.7) 6.9±5.7 (2.8-10.9)ª,b 4.1±4.0 (1.2-6.9) 0.10 Recovery 0.7±0.9 (0.1-1.3) 2.0±5.3 (-1.8-5.7) 6.4±9.2 (-0.1-13.0) 5.2±4.4 (2.0-8.3) 0.14
Values in means ± SD (CI 95%). SD1 = Standard deviation 1 of the Poincaré model, SS = stress score (inverse of SD2 of the Poincaré model). SS/SD1 = Sympathetic and parasympathetic index.
As shown in Figure 2, by the Poincaré model, HRV, especially in its parasympathetic
component (SD1), is different in each MET and decreases during all exercise protocols, without complete recovering within the first 5 minutes; In addition, during recovery, the parasympathetic component was lower in the aerobic protocol, followed by the anaerobic, isotonic and isometric
(Table 1, Figure 2).
Figure 2. Qualitative Poincaré model among different tests and times.
Figure 3 (a, b and c) confirms part of what is observed in Table 1 and Figure 2, that is, the
differences were observed between baseline vs. exercise and recovery times in SS and SS/SD1 (p <0.01). For SD1, the differences were between the three times (p <0.001).
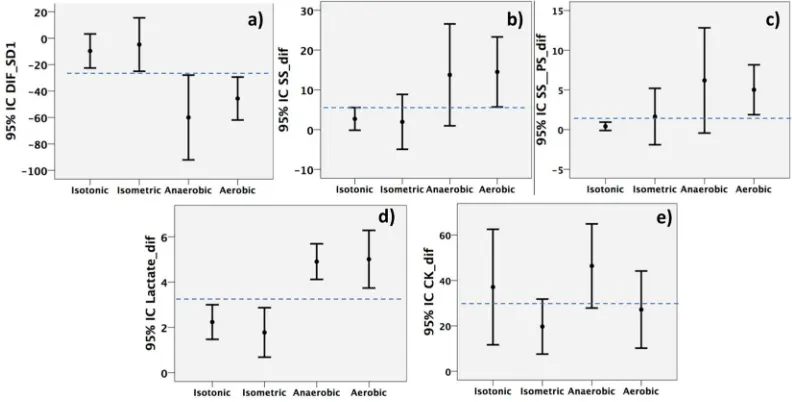
Figure 3. Differences presented on recovery values vs. baseline (a, b, c), and final vs. basal (d, e) for
each of the analyzed variables: a) SD1, b) SS, c) S/PS, d) Blood lactate, e) Creatine Kinase (CK). When the confidence intervals (95%) do not cross, it means that there were differences at p <0.05.
3.2. Biochemistry markers
[LA-]b was elevated at the end of the four protocols (p <0.001), but in the isotonic and isometric protocols the concentrations were lower compared to aerobic and anaerobic (p <0.05) (Table 2, Figure
3 d). On the other hand, despite the short period between blood samples, there were differences in the basal and final CK concentrations (p <0.001), but not between protocols (Table 2, Figure 3 e).
Finally, we observed that at higher [LA-]b concentrations at the end of the aerobic protocol, lower SD1 during exercise (r = - 0.66, p <0.05) and in recovery (r = - 0.78, p <0.05); in addition, at higher
CK concentrations at the end of the anaerobic protocol, the S/PS index increased (r = 0.69, p <0.05).
4. Discussion
In sport, fatigue is considered an antagonist of physical performance, so it is constantly studied through various markers of acute and chronic response, either through invasive or non-invasive methods. [LA-]b, CK and HRV are clear markers of fatigue and acute physical stress
response, however, they have also been observed to be altered chronically [15,16], having few publications that have studied them together and comparing different types of exercise. This work
presents evidence about the differences and associations in these markers against four different types of exercise, observing an acute and different response between each one.
As noted above, when the human body is exposed to acute fatigue, the kinetics of HRV, CK, and [LA-]b is modified in a particular way. In athletes, the factors that determine the behavior of the markers are the physical fitness, the exercise modality and its intensity [3,6,17]. In this study all of
them were evaluated, their influence analyzed on the differences between the onset and the end of the exercise in the exercise modalities applied.
Regarding ANS and central fatigue, at resting and relaxation state the parasympathetic system predominates, and during the exercise, both systems (sympathetic and parasympathetic)
high-intensity exercise decreases the parasympathetic component SD1, slightly increasing the sympathetic SS component, without complete recovery after 10 minutes post-exercise compared to basal values.
In highly trained participants, and at exercise intensities below the anaerobic threshold, complete recoveries in HRV have been observed between 10-15 minutes post-exercise; at higher intensities, full recovery may exceed 30 min [20]. Similar to our results, other studies have observed differences in
SD1 and SD2 with different types of exercise [21], unlike our work, Leich et al., [21] using the high frequency (HF) and low (LF) domain to compare the degree of sympathetic and parasympathetic
stimulation; we did not observe any type of relationship between HF and LF (R2 0.02, data not shown), but between SD1 and SS as proposed by Naranjo Orellana et al., [6], since SD1 and SS show
a close and inverse relation between each other: R2 = 0.69 with Naranjo’s data et al., (2015), and R2 = 0.45 with our data. On the other hand, we observed that at higher intensity and duration of exercise,
the greater decrease in the PNS (lower SD1 and higher SS and S/PS), and longer recovery time; effects already observed in athletes of aerobic endurance in race protocols [22]. Naturally, HR oscillates spontaneously, mostly under resting conditions. A decrease in HRV, both at rest and during exercise,
is indicative of altered homeostasis, and is associated with fatigue, stress, and risk of mortality, conversely, a high variability is indicative of physical exercise adaptability and good health [7,23].
For the above mentioned, the training workloads produce stress and fatigue, the ANS responds immediately to them, stimulating in different ways its two branches: sympathetic and
parasympathetic. This work confirms that the measurement of time series between heartbeats, called HRV is a safe, simple, inexpensive and non-invasive way to know the changes in ANS produced by
training and fatigue; being a very useful tool to develop training programs in a more scientific and precise way the workloads; as well the athletes’ recovery process.
Regarding peripheral fatigue, the anaerobic metabolism increase in all MET, since [LA-]b was elevated above the anaerobic threshold (4 mM) [24]. Besides, anaerobic metabolism was greater in the aerobic and anaerobic protocols vs. isometric and isotonic protocols (p <0.05). [LA-]b it is a
by-product of the anaerobic activity of lactate dehydrogenase, from pyruvate and reduced nicotinamide adenine dinucleotide (NANH + H+), both products of glycolysis. Basal [LA-]b is <2 mM, and during
intense exercise it increases above 4 mM [17]. Although the increase in [LA-]b is not the only cause of peripheral fatigue, several biochemical markers have been found associated to it, among them the
increase of inorganic phosphate and H+, decrease in pH, ATP/ADP and PCr/Cr ratio, inactivation of enzymes and ion channels, among others. On the other hand, the inverse correlation here observed
between [LA-]b and PNS activation (SD1, r = – 0.72, p <0.05), confirming previous findings on the relationship between both variables, that indicate the existence of an anaerobic threshold measured
by HRV [25].
Finally, despite the short post-exercise recovery time, and low differences found, the CK plasma concentrations were significantly increased concerning resting ones, but without differences between protocols. CK´s basal values range between 195 IU/L [26], and as large as 10000 IU/L between 24-72 h post exercise [27], however, a low increase already found at 30 min post-exercise (~ 350 IU/L) [10], indicating an acute response to exercise. The CK blood concentration depends on age, gender,
race, muscle mass, physical activity (type, time, intensity and volume), or climatic condition [27,28].
high exercise intensity increases both, association already found in post-myocardial infarction patients [29], but not in athletes [30].
This work has some limitations, among them: The small differences found intra and intergroups (partial 2 <0.5) could be due to the following two reasons, the short time elapsed between the different evaluations and the low number of participants. Also, due to the experimental design, exercise times between protocols were very different, which could bias the observed results. The kubios software did not allow us to adjust the axes to the same magnitude, so the differences between protocols are difficult to appreciate, however these differences are observed in Table 1.
5. Conclusions
The results of the present study confirm that the HRV, CK, and [LA-]b are acute markers to detect, both central and peripheral fatigue; sensitive to the type, duration, and intensity of exercise, being HRV a novel and non-invasive marker; simple and useful for sports coaches and athletes. The higher the sympathetic activity, the lower the HRV, higher CK and lactate blood concentrations.
Supplementary Materials: The figures and data base are available online at www.mdpi.com/xxx/s1:
Author Contributions: All authors substantially contributed to the design of the study, the production, analysis, or interpretation of the results, and/or preparation of the manuscript. J.T.Q.CH, E.F.E.M., G.S.M. and H.C. conceived the experimental design; J.T.Q.CH., E.F.E.M. and G.S.M. supervised all experiments. A.R.J. performed data handling and statistical analyses; A.R.J., G.S.M., F.R. and H.C. drafted the manuscript and data interpretation. All authors read and approved the final manuscript.
Funding: This research was funded by Programa para el Desarrollo Profesional Docente en Educación Superior
(PRODEP).
Acknowledgments: We thank all the participants for their time and effort.
Conflicts of Interest: None of the authors declare competing financial or otherwise interests. The experiments
comply with the current laws of the country in which they were performed.
References
1. Erickson, K.; Côté, J.; Fraser-Thomas, J. Sport experiences, milestones, and educational activities
associated with high-performance coaches’ development. Sport Psychol. 2007, 21(3), 302-316.
doi.org/10.1123/tsp.21.3.302.
2. Riley, M.S.; O'Brien, C.J.; McCluskey, D.R.; Bell, N.P.; Nicholls, D.P. Aerobic work capacity in patients
with chronic fatigue syndrome. BMJ 1990, 301(6758), 953-956. PMCID: PMC1664147.
3. Nosaka, K.; Clarkson, P.M. Variability in serum creatine kinase response after eccentric exercise of the
elbow flexors. Int. J. Sports Med. 1996, 17(2), 120-127.
4. Ramos-Jiménez, A.; Hernández-Torres, R.P.; Wall-Medrano, A.; Juarez-Oropeza, M.A.; Vera-Elizalde,
M. Blood lactate kinetics on passive and active recovery. Gazz. Med. Ital. 2013, 172(5), 342-350.
5. Vernillo, G.; Agnello, L.; Barbuti, A.; Di Meco, S.; Lombardi, G.; Merati, G.; La Torre, A. Postexercise
autonomic function after repeated-sprints training. Eur. J. Appl. Physiol. 2015, 115(11), 2445-2455. doi:
10.1007/s00421-015-3226-5.
6. Orellana, J.N.; de la Cruz Torres, B.; Sarabia Cachadina, E.; de Hoyo, M.; Dominguez Cobo, S. Two
new indexes for the assessment of autonomic balance in elite soccer players. Int. J. Sports Physiol.
Perform. 2015, 10(4), 452-457. doi: 10.1123/ijspp.2014-0235
7. de la Cruz T.B.; López, C.L.; Orellana, J.N. Analysis of heart rate variability at rest and during aerobic
exercise: a study in healthy people and cardiac patients. Br. J. Sports Med. 2008, 42(9), 715-720. doi:
8. Zulfiqar, U.; Jurivich, D.A.; Gao, W.; Singer, D.H. Relation of high heart rate variability to healthy
longevity. Am. J. Cardiol. 2010, 105(8), 1181-1185. doi: 10.1016/j.amjcard.2009.12.022.
9. Corrales, M.M.; de la Cruz T.B.; Esquivel, A.G.; Salazar, M.A.G.; Orellana, J.N. Normal values of heart
rate variability at rest in a young, healthy and active Mexican population. Health 2012, 4(7), 377-385.
http://dx.doi.org/10.4236/health.2012.47060
10. Ascensao, A.; Rebelo, A.; Oliveira, E.; Marques, F.; Pereira, L.; Magalhaes, J. Biochemical impact of a
soccer match - analysis of oxidative stress and muscle damage markers throughout recovery. Clin.
Biochem. 2008, 41(10-11), 841-851. doi: 10.1016/j.clinbiochem.2008.04.008
11. Gladden, L.B. Lactate metabolism: a new paradigm for the third millennium. J. Physiol. 2004, 558(1),
5-30. doi: 10.1113/jphysiol.2003.058701
12. American College of Sport Medicine. ACSM´s Guidelines for Exercise Testing and Prescription, 10th ed.;
Lippincott Williams & Wilkins: Philadelphia, PA, USA, 2016; pp. 81-86. ISBN-10: 1-4963-3907-X.
13. Cortex. Operador’s Manual Metalyser 3B. Operation, calibration, maintenance. version ML3B 2.1.
2016, Available online:
https://www.procarebv.nl/wp-content/uploads/2016/11/Cortex-Metalyzer-3B_-Handleiding.pdf (Accessed on 31 October 2018).
14. Horder, M.; Jorgensen, P.J.; Hafkenscheid, J.C.; Carstensen, C.A.; Bachmann, C.; Bauer, K.; . . . Vogt,
W. Creatine kinase determination: a European evaluation of the creatine kinase determination in
serum, plasma and whole blood with the reflotron system. Eur. J. Clin. Chem. Clin. Biochem. 1991,
29(10), 691-696. PMID: 1764545
15. 15.Schubert, C.; Lambertz, M.; Nelesen, R.A.; Bardwell, W.; Choi, J.B.; Dimsdale, J.E. Effects of stress
on heart rate complexity-a comparison between short-term and chronic stress. Biol. Psychol. 2009,
80(3), 325-332. doi: 10.1016/j.biopsycho.2008.11.005
16. 16.Seifert, J.; Kroll, J.; Muller, E. The relationship of heart rate and lactate to cumulative muscle fatigue
during recreational alpine skiing. J. Strength Cond. Res. 2009, 23(3), 698-704. doi:
10.1519/JSC.0b013e3181a2b55e
17. 17.Ramos-Jimenez, A.; Hernandez-Torres, R.P.; Torres-Duran, P.V.; Romero-Gonzalez, J.; Mascher, D.;
Posadas-Romero, C.; Juarez-Oropeza, M.A. The respiratory exchange ratio is associated with fitness
indicators both in trained and untrained men: a possible application for people with reduced exercise
tolerance. Clin. Med. Circ. Respir. Pulm. Med. 2008, 2, 1–9. PMCID: PMC2990231
18. 18.Sarmiento, S.; García-Manso, J.M.; Martín-González, J.M.; Vaamonde, D.; Calderón, J.; Da
Silva-Grigoletto, M.E. Heart rate variability during high-intensity exercise. J. Syst. Sci. Complex. 2013, 26(1),
104-116.
19. 19.Sumi, K.; Suzuki, S.; Matsubara, M.; Ando, Y.; Kobayashi, F. Heart rate variability during
high-intensity field exercise in female distance runners. Scand. J. Med. Sci. Sports 2006, 16(5), 314-320. doi:
10.1111/j.1600-0838.2005.00492.x
20. 20.Seiler, S.; Haugen, O.; Kuffel, E. Autonomic recovery after exercise in trained athletes: intensity and
duration effects. Med. Sci. Sports Exerc. 2007, 39(8), 1366-1373. doi: 10.1249/mss.0b013e318060f17d
21. 21.Leicht, A.S.; Sinclair, W.H.; Spinks, W.L. Effect of exercise mode on heart rate variability during
steady state exercise. Eur. J. Appl. Physiol. 2008, 102(2), 195-204. doi: 10.1007/s00421-007-0574-9.
22. 22.Kaikkonen, P.; Hynynen, E.; Mann, T.; Rusko, H.; Nummela, A. Can HRV be used to evaluate
training load in constant load exercises? Eur. J. Appl. Physiol. 2010, 108(3), 435–442. doi:
23. 23.Thayer, J.F.; Yamamoto, S.S.; Brosschot, J.F. The relationship of autonomic imbalance, heart rate
variability and cardiovascular disease risk factors. Int. J. Cardiol. 2010, 141(2), 122-131. doi:
10.1016/j.ijcard.2009.09.543
24. 24.Ghosh, A. K. Anaerobic threshold: its concept and role in endurance sport. Malays. J. Med. Sci. 2004,
11(1), 24-36. PMCID: PMC3438148.
25. 25.Karapetian, G.K.; Engels, H.J.; Gretebeck, R. J. Use of heart rate variability to estimate LT and VT.
Int. J. Sports Med. 2008, 29(08), 652-657. doi: 10.1055/s-2007-989423.
26. 26.Prelle, A.; Tancredi, L.; Sciacco, M.; Chiveri, L.; Comi, G.P.; Battistel, A.; . . . Moggio, M.
Retrospective study of a large population of patients with asymptomatic or minimally symptomatic
raised serum creatine kinase levels. J. Neurol. 2002, 249(3), 305-311.
https://doi.org/10.1007/s004150200010
27. 27.Baird, M.F.; Graham, S.M.; Baker, J.S.; Bickerstaff, G.F. Creatine-kinase-and exercise-related muscle
damage implications for muscle performance and recovery. J. Nutr. Metab. 2012, 1-13. doi:
10.1155/2012/960363.
28. 28.Brancaccio, P.; Maffulli, N.; Limongelli, F.M. Creatine kinase monitoring in sport medicine. Br.
Med. Bull. 2007, 81(1), 209-230. PMID: 17569697
29. 29.Casolo, G.C.; Stroder, P.; Signorini, C.; Calzolari, F.; Zucchini, M.; Balli, E., . . . Lazzerini, S. Heart
rate variability during the acute phase of myocardial infarction. Circulation 1992, 85(6), 2073-2079. doi:
10.1161/01.CIR.85.6.2073
30. 30.Buchheit, M.; Voss, S.C.; Nybo, L.; Mohr, M.; Racinais, S. Physiological and performance
adaptations to an in-season soccer camp in the heat: associations with heart rate and heart rate


![Bis[hydrotris(1 pyrazolyl)borato κ3N,N′,N′′]iron(III) tetrachloroferrate(III) acetonitrile solvate](data:image/gif;base64,R0lGODlhAQABAIAAAP///wAAACH5BAEAAAAALAAAAAABAAEAAAICRAEAOw==)