CSEIT172677 | Received :10 June 2017 | Accepted : 23 June 2017 | May-June 2017 [(2)3: 933-937]
International Journal of Scientific Research in Computer Science, Engineering and Information Technology © 2017 IJSRCSEIT | Volume 2 | Issue 3 | ISSN : 2456-3307
933
Artificial Intelligence Using for Weather Forecasting
V. Ramesh
1, G. Raju
21CSE Department, Assistant Professor , Sri Indu College of Engineering & Technology, Hyderabad, Telengana, India 2CSE Department, Assistant Professor, Vaagdevi College of Engineering, Hyderabad, Telengana, India
ABSTRACT
Weather forecasting is very a statistical measure than a binary decision. We have a tendency to will develop an intelligent weather predicting module since this has become a necessary tool. This tool considers measures like most temperature, minimum temperature and rain for a sampled period of days and is analyzed. An intelligent prediction based on the obtainable data is accomplished using machine learning techniques. The analysis and prediction are supported linear regression that predicts consequent day’s weather with smart accuracy. An accuracy of over ninetieth is obtained, supported the data set. Recent studies have mirrored that machine-learning techniques achieved higher performance than traditional statistical methods. Machine learning, a branch of computing has been established to be a robust technique for predicting and analyzing a given data set. The module plays an important role in agricultural, industrial and supply fields wherever the weather outlook is a crucial criterion.
Keywords: Weather Forecasting, Machine Learning, Artificial Intelligence, Linear Regression
I.
INTRODUCTION
Weather prediction, in general, is a complicated method and difficult task. It needs various parameters to forecast the weather. Monitoring and predicting weather helps in numerous fields like agriculture, travel, pollution dispersion, communication, disaster management, etc. henceforward the foretelling of weather plays a significant role in on a daily basis today facet, utilizing the requirements of a standard man to analysis scientists. This explains why foretelling cannot be foretold with easier means that.
Within the gift times their area unit high definition satellite images to accurately predict the forecast of the future days; however, the method is neither straightforward nor economical. Here this module helps the United States to predict the weather using the past knowledge and analyze it with an honest rate of accuracy and proves to be an easy one. The module involves the utilization of ideas related to AI and machine learning tools. Among the assorted tools, we have chosen simple regression technique. One factor that is to be done obligatorily by the user is to update the previous day’s weather parameters alternatively the module fails to use linear regression to predict, as every
tool dealing with machine learning involves the constant renewal of past data.
II.
RELATED WORKS
III.
FUNCTIONS
A. Hypothesis
To describe a supervised learning problem, the output is predicted according to the given inputs. We are aware of how the output arrives for the particular input. In hypothesis function, the aim is to predict a hypothesis, which is as close as to the output... To be simply told the cost function renders hypothesis, which has the least distance or measure to the output.
h(x) = hθ(x) = θ0 + θ1X1 +…θn Xn (1)
Where h(X) is the hypothesis function, X is the input (in matrix) and theta (θ) is the parameter corresponding to X. Theta are set of values, which makes the mean square error minimum.
B. Cost function
Cost function is a mathematical function, which makes the above hypothesis to be closer to the output. Therefore, this function minimizes the mean square error. The cost function is explained as given in equation 2
Where J ( ) is the cost function(x) is the hypothesis function, m is the number of training examples and y is the output. The cost function should denote the minimum distance between the hypothesis curve and the output curve.
C. Gradient descent
Gradient descent is a differential equation which minimizes the theta ( ) value in order to minimize the cost function after repeated iterations. In mat lab, the following function represented by equation (3) is implemented to converge the value of the cost function. This can be made only by minimizing the theta value in consecutive steps.
Here j is the theta value of a particular iteration value and J ( ) is the cost function
D. Normal equation
The normal equation gives the best value of theta for the hypothesis without any need for Iterations as done in gradient descent.
The normal equation plays a vital role in predicting the probability of the forecasted day, (i.e.) whether it was a rainy, sunny, or cloudy day
E. multiclass classification
In the multi class classification the classified output values are more than two cases, i.e. more than the usual 0’s and 1’s. In this case, we need to predict one of the three classes, sunny, rainy, or cloudy. Hence we go for multi class classification which uses a the algorithm of logistic regression, except the fact that it can handle more than 2 classes
IV.
METHODOLOGY
Weather cannot be predicted with the good percentage of accuracy. It is an art to forecast the weather with terribly low deviations and creating it fetches sensible results. However, weather forecasting tends to deviate a lot of and has moderate accuracy.
curve. Similarly, constant procedure is completed for locating minimum temperature and rainfall. The values of foretold max, min temperatures and downfall are increased with theta to induce a price which can be within the vary of (1 to 3) because the sunny day drawn by one, cloudy drawn by two and rainy as three.
In the method finding a decent price of theta is that the major task for predicting the sort of the day. The worth of alphabetic character found may also be done using traditional equation. to find the worth of alphabetic character from the conventional equation the X and Y matrices are enforced within the equation(4).The obtained price of theta is then increased by the anticipated price of the max, min temperature and rainfall to induce the worth of the type of day.(Sunny or cloudy or rainy).
The error verification process is explained in the error verification and detection column
V.
WEATHER CLASSIFIER ANALYSIS
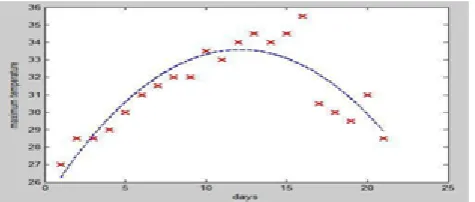
The plots in figure (Figure 1.3, Figure 1.4, and Figure 1.5) show the curves obtained by plotting max temperature (Celsius) Vs number of days, min temperature (Celsius) Vs number of days and rainfall (in mm) Vs number of days. The curves are obtained by evaluating the cost function along with gradient descent. The theta obtained is used for plotting the curve (hypothesis)... The curved plot is due to the polynomial function used in plotting the data.
Figure 1.3. Maximum temperature Vs Days
Figure 1.4. Minimum temperature Vs Days
Figure 1.5. Rainfall vs. Days
The following hypothesis in fig (1.3, 1.4, and 1.5) will be a curve, which has the least distance (perpendicular) between itself and the output points. the gradient descent undergoes numerous iteration to minimize the value of theta, which is gives, the shape of the curve (hypothesis).
ERRORS & THEIR DETECTIONS
The case of cross-validation error, the error plot is obtained by price perform values wherever the letter of the alphabet utilized in price perform is obtained by victimization all the values of Cross validation set knowledge through gradient descent, however, the thought stack is enforced with every cross-validation data loaded at a time to seek out price perform values. Note: Here the worth is obtained using the theta from gradient descent. Where the complete cross-validation set, knowledge was used while not the thought of the stack
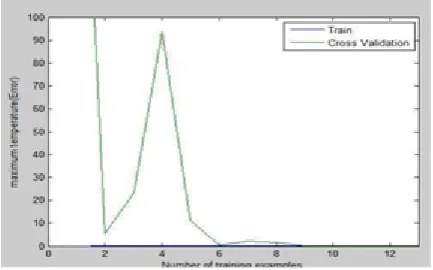
Figure 1.6. Error verification for Maximum temperature vs. days
Figure 1.7. Error verification for Minimum temperature Vs days
Figure. 1.8. Error verification for Rainfall Vs Days All the curves in the plot should have to tend towards x axis of the plot and should have to touch the x-axis as the number of training examples increases. The height of the curves edge at the end from the x-axis determines the value of error that occurs in prediction. However, in the plots we can observe that the curve
touches the x-axis showing that there will be no error in the prediction process. Page Layout
VI.
RESULTS
The prediction for the next day’s weather which follows maximum, minimum, rainfall and the type of the day (whether it is sunny or cloudy or rainy) is predicted with a good rate of accuracy using the plots obtained from fig(1.3,1.4,1.5) through hypothesis by getting the value of y-axis from the curve by substituting the x axis value
The margins must be set as follows:
Which is the date of the next day? On finding the forecast using the predicted values of maximum temperature, minimum temperature and rainfall we get the following output in the two forms:
For the 22nd day: Using Normal Equation: Theta computed from the normal equations:
Using linear Regression with Multiple variables: Theta computed from gradient descent
The Forecast is = 2.893347e+00
parameters of past days and comparing it with the data present in the dataset
VII.
CONCLUSION
The results can even be verified by multi-class classification using logistic regression and with artificial neural network. However, the disadvantage of using the artificial neural network and multi-classification is that they offer U.S.A. an output of the day and not the closest price likelihood of however the day goes to be. The support vector machine can even be utilized in predicting the information and works the best once there is an outsize range of options and classifications gift however redundant options should be avoided. The only effort that is to be taken by the user is to update the information set to indicate correct results. And it works well once the information set is significantly giant enough to supply a minimum of a seventh of the data to be forecast. For instance, if the data set has been taken for one year, the forecast weather is going to be correct for the primary fifty-two days. Once there square measure a lot of options and a lot of coaching examples (dataset) the forecast works best. The module helps in watching and predicting the weather with a good rate of accuracy, particularly in an efficient manner.
VIII.
REFERENCES
[1]. Y.Radhika., M.Shashi. Atmospheric Temperature Prediction using Support Vector Machines “Vol. 1, No. 1, April 2009
[2]. Durga L., Shrestha. Dimitri P. Solomatine. Machine learning approaches for estimation of prediction interval for the model output. Neural Networks 19 (2006) 225-235
[3]. Paniagua-Tineoa, S., Salcedo-Sanz a., C. Casanova-Mateoc., E.G. Ortiz-Garcíaa., M.A. Cony b., E. Hernández-Martínc.: Prediction of daily maximum temperature using a support
vector regression algorithm. Renewable Energy 36 (2011) 3054e3060.
[4]. Navin Sharma., Pranshu Sharma., David Irwin., and Prashant Shenoy.: Predicting Solar Generation from Weather Forecasts Using Machine Learning. (IEEE SmartGridComm)
[5]. N. Cristianini.,J.Shawe-Taylor.:An Introduction to Support Vector Machines and Other
[6]. Kernel-based Learning Methods.
CambridgeUniversity Press, 2000.
[7]. Jabir Rasouli, William W. Hsieh, Alex J. Can nondaily, stream flow forecasting by machine learning methods with weather and climate inputs. Journal of Hydrology 414-415 (2012) 284-293 [8]. Dr. S. Santos Baboo, I. Kadar ShereefAn: