CSEIT1836115 | Received : 10 August 2018 | Accepted : 28 August 2018 | July-August-2018 [ 3 (6) : 602-608 ]
© 2018 IJSRCSEIT | Volume 3 | Issue 6 | ISSN : 2456-3307
Smart Agriculture Implementation Planning To Increase Rice
Production And Reduce Greenhouse Gas Emissions Using
System Dynamics Approach
Trigati Widyandari L.W*1, Erma Suryani2*1,2Information Systems Department, Institut Teknologi Sepuluh Nopember, Surabaya, Indonesia
ABSTRACT
Smart Agriculture addresses the challenges of food safety and climate change that are interconnected and benefits farmer by improving input efficiencies such as labor, seed, and fertilizer. Smart Agriculture includes agricultural practices by adopting the internet of things (IoT), sensors and others, to improve agricultural productivity while reducing greenhouse gas emissions from rice farming activities. In this study, the increase of rice production is modeled using a system dynamics to analyze current conditions and evaluate existing problems and provide alternative problem-solving scenarios. The increase of rice production was carried out by applying the smart agriculture concept.
Keywords : Smart Agriculture, System Dynamics, Greenhouse Gas Emission, Productivity, Rice Production
I.
INTRODUCTIONRice is a staple food for most of Indonesia's population. East Java is the largest rice producer in Indonesia. Rice is one of the largest commodities in East Java, along with corn, sugar cane, coconut, and fruits (1).
The problem of rice consumption and its fulfillment will remain an important agenda. The agricultural sector should continue to be developed to remain a mainstay of establishing food security, increasing the income of farmers and rural populations, alleviating poverty, supplying qualified labor to non-agricultural sectors, spurring economic growth and healthful economy (2). However, many challenges will be faced to increase rice production, such as land convection which decreases every year, the decreasing of soil fertility level, and irrigation problem. In addition, climate change is one threat to
the agricultural sector as it can lead to crop failure, as well as productivity and production declines.
Increased productivity is the key to increasing rice production. According to East Java agricultural service, the level of land productivity is influenced by various factors, such as the use of balanced fertilizer, the availability of water or irrigation, the use of superior seeds, and pest control.
II.
FACTORS THAT INFLUENCE THE INCREASE IN RICE PRODUCTION AND DECREASE INGREENHOUSE GAS EMISSIONS
According to (3), rice production can be increased by increasing land productivity per hectare by implementing land revitalization using fertilizers and insecticides. Land productivity is influenced by the improvement of crop agro-input starting from the provision of balanced fertilizer according to soil nutrient requirements. In addition, the application of new technologies such as jajar legowo planting production suggesting the importance of government investment in irrigation systems to reduce the risk of water shortages that rice producers frequently face (6). Labor available and demand for the commodity (rice) has a strong positive relationship with the rice production volume. land size and technology is not an important factor that affecting any unit of differences in the rice production volume. However, these two factors still have a positive relationship or interpreted as contribution to the rice production level (7).
The agricultural sector is one of the sources of greenhouse gas emissions, especially methane. The area of rice fields in Indonesia which is more than 10.9 million hectares is thought to contribute about 1% of the total global methane. If total methane is thought to be directly proportional to the total production of rice, any attempt to increase rice production must be paid with environmental damage in the form of increased methane emissions. Greenhouse gas emissions from the agricultural sector are estimated from emissions: (1) methane (CH4) from lowland rice cultivation (2) carbon dioxide (CO2) due to the use of urea fertilizer, (3) nitrous oxide (N2O) from the soil, including N2O
emissions not directly from the addition of N to the soil due to evaporation / precipitation, and (4) non-CO2 from biomass burned in agricultural activities. This emission is influenced by the planting area, harvested area, soil type, and fertilizer dosage. Fertilizer is the biggest source of emissions (38%) for the agricultural sector (8). Soil releases N2O in the nitrification and denitrification processes. The use of both organic and inorganic fertilizers increases the levels of N2O released by the soil. Efforts to reduce the rate of increase in global warming due to GHG emissions from agricultural land are through several cultivation techniques such as the use of varieties, fertilization, water management, tillage, use of herbicides and nitrification inhibitors. Some varieties that have been studied to produce low GHG emissions are IR 64, Dodokan, Tukad Balian, Batanghari, Ciherang and Inpari 1. The use of urea and using inorganic fertilizers according to the needs of plants, also has the opportunity to reduce methane emissions (9).
III.
METHODS AND MATERIALAccording to (10), the model is a representation of the system in real life that becomes the focus of attention and becomes the subject matter. Modeling can be defined as the process of forming a model of the system using certain formal languages.
1. System Dynamics
used to analyze models and produce scenarios to improve system performance (11). The steps in system modeling according to (12) are:
a) Step 1 : Problem articulation
Problem articulation involves defining the problem. Problem articulation is the most important step in modeling. It is very important to have a clear purpose of the model. Since system dynamics modeling is usually a group effort, a clear purpose ensures that everyone in the group will think and stay focused on a single problem and that prevents the modeling process from going off the track. Also, the model should address a limited number of issues rather than representing the whole system.
b) Step 2 : Formulation of dynamics hypothesis The second step related to dynamic assumptions, leads to the development of an influence diagram. Influence diagrams make it possible to conceptualize the dynamics of a complex system, and to communicate assumed important feedback loops at the source of the problems. Such a diagram highlights both the variables of a system and the links between these variables.
c) Step 3 : Formulation of a simulation model Formulation of a simulation model is a level-rate diagram. Level-rate diagrams are quantitative models that represent a system with stock and flows.
d) Step 4 : Testing
The purpose of the test is to compare the behavior of the model simulation to the actual behavior of the system.
e) Step 5 : Policy design and evaluation.
The last step relates to the formulation of new potential strategies and the evaluation of simulation results. This step requires on the one hand the identification of scenarios, and on the other hand the analysis of the simulated results generated by the model for each scenario over time.
2. Model Validation
Validation is done to ensure the model has been made can already describe the real system condition. Validation system is done by two way of testing that is model validation with mean comparison test statistic or validation model with amplitude variation comparison test (% error variance). A model will be valid if the mean comparison is less than 5% and % error variance is less than 30% (13). Mean comparison and % error variance are defined in equation (1) and (2).
̅ ̅̅ (1)
(2)
Where:
S = the average rate of simulation
A = the average rate of data
Ss= the standard deviation of simulation Sa= the standard deviation of data
IV.
RESULTS AND DISCUSSIONFAO defines Smart Agriculture aims to address the challenges of food and climate security, consisting of three main pillars (14):
a. Increase rice farm productivity and sustainable farmer income
b. Building food security
c. Reduce greenhouse gas emissions, triggered by the agricultural sector.
The technology investment required in implementing Smart Agriculture, especially precision farming such as (Schimmelpfennig & Ebel, 2016): a. GPS (Global positioning system): to identify the
field location so that inputs (seeds, fertilizers, pesticides, herbicides and irrigation water) can be applied to each field, based on performance criteria and previous input applications
b. Sensor technology: used to measure humidity, vegetation, temperature, steam, air etc.
c. GIS (Geographic information system): provides information on soil type topography, surface drainage, subsurface drainage, soil testing, irrigation, chemical application rates and yields. d. VRT (Variable-rate technologies): regulates the
rate of shipment of agricultural inputs depending on the type of soil. Extrapolated information from GIS can control the process, such as fertilizer seeding and pesticide application in the right place at the right time.
e. Yield Monitor: provides data for yield maps that help farmers determine good input management, such as fertilizer, seeds, pesticides, soil treatment and irrigation
Several benefits related to the implementation of smart agriculture :
a) Precision farming can improve crop yields amounting to US$ 650 million in two years and reduce GHG emissions equivalent to 500 million kg (16).
a) Farm productivity is influenced by nitrogen fertilization rates, as it is one of the most significant parameters for increasing yield. Impact of VRNA on-farm productivity and economics, nitrogen VR fertilization showed
always better results than conventional application with nitrogen savings of 6–46%. VR fertilizer application (including manure spreading) allows for the optimum application of nitrogen according to the crop needs, reducing the final fertilizer (or manure) quantity and its associated GHG emissions both CO2 (17).
b) Water savings can be obtained by practicing precision farming of rice in lowland paddy fields. To improve irrigation management with variable irrigation supplies, GIS is an essential element for modern information techniques and acts as the interface with the user. To promote more efficient ways of managing water in irrigated areas, modern GIS technique can be employed to collect, store, and process enhanced information on water use for crops, and to disseminate reliable and validated procedures (18).
From several benefits related to the implementation of smart agriculture, especially precision agriculture in rice farming, a model will be created by implementing Smart Agriculture to increase rice production and reduce greenhouse gas emissions. Causal Loop Diagram (CLD) is a form of mapping that shows the causal relationship between variables with arrows from cause to effect. CLD is very good for (12) :
1. Quickly catch a hypothesis about the causes of dynamics.
2. Generate and capture models individually or in groups.
3. Important feedback communication that is trusted as responsibility for a problem.
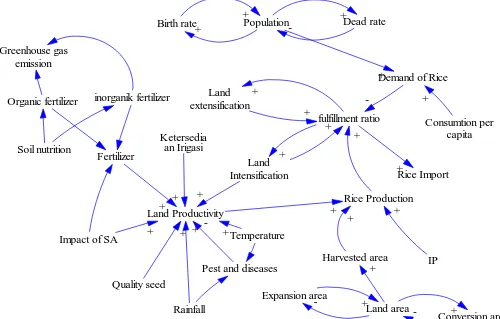
Figure 1. Causal Loop Diagram Increasing Rice Production
According to the figure 1, rice production is affected by productivity and land area, if there is an increase in the amount of productivity or land area, production can increase and otherwise. Internal factors that influence productivity improvement include balanced fertilizer provision, availability of irrigation water, use of superior seeds. While factors that reduce land productivity are pests and diseases. External factors that influence productivity are climate and weather impacts, including temperature and rainfall factors throughout the year. The level of productivity is obtained from the rate of increase in productivity minus the rate of decline in productivity. Fertilizer is the biggest source of emissions (38%) for the agricultural sector. So in this study, greenhouse gas emissions are only seen from the use of fertilizers, both organic and inorganic fertilizers. The use of urea and using inorganic fertilizers according to the needs of plants, also has the opportunity to reduce methane emissions.
With sensor technology, we can measure humidity, temperature, so that when nutrient conditions require agro-input, we can use VRT technology for fertilizer seeding and pesticide application in the right place at the right time, etc. Smart Agriculture offers sophistication and automatism, so IoT technology in Smart Agriculture is useful for the efficiency of giving agro-input according to the nutrient needs of rice plants, in the right and real time. So it can improve agricultural productivity while reducing greenhouse gas emissions from rice farming activities, because there is no more excess or lack of fertilizer, no more flooding, which can cause greenhouse gas emissions.
V.
CONCLUSION1. Smart Agriculture covers agricultural practices by adopting the internet of things (IoT), sensors and others, to improve agricultural productivity,
while reducing greenhouse gas emissions from rice farming activities.
2. Key of implementing precision agriculture techniques, including variable rate application of crop inputs, soil conditioning applications, and water management methods.
3. Rice production is affected by productivity and land area. Factors that influence productivity improvement include balanced fertilizer provision, availability of irrigation water, use of superior seeds.
4. To reduce greenhouse gas emissions in the agricultural sector can be done with the use of short-lived varieties, use of fertilizers according to nutrient requirements, and the efficiency of irrigation channels.
5. Make a model must understand the system to be created. Understanding the variables that have a significant effect. So the model can represent the real condition of a system.
VI.
REFERENCES[1]. Investasi Sektor Pertanian di Propinsi Jawa Timur. Nugroho, Iwan and Hanani, Nuhfil . Malang : ResearchGate, 2007.
[2]. Analisis Profitabilitas Usaha Tani Padi Pada Agroekosistem Lahan Sawah Irigasi Di Jawa Dan Luar Jawa Pedesaan Patanas. Nurasa, Tjetjep and Purwoto, Adreng. s.l. : Pusat Sosial Ekonomi dan Kebijakan Pertanian, 2011.
[3]. PENGEMBANGAN MODEL SISTEM
DINAMIK PEMENUHAN LOGISTIK BERAS UNTUK MENJAGA STABILITAS HARGA.
Suprianto, Joko and Suryani, Erma. 1, Surabaya : ResearchGate, 2014, Vol. V.
[4]. Pengembangan Model Rantai Pasok Produksi Beras Untuk Meningkatkan Ketahanan Pangan Dengan Menggunakan Sistem Dinamik.
Muhandhis, Isnaini and Suryani, Erma.
Surabaya : Prosiding Seminar Nasional Manajemen Teknologi XXIII, 2015.
[5]. Identifying Factors Influencing Production and Rice Farming Income with Approach of Path Analysis. Alam, Max Nur and Effendy. Palu : American Journal of Agricultural and Biological Sciences, 2017.
[6]. Sachchamarga , Kwinarajit and Williams, Gary
W. ECONOMIC FACTORS AFFECTING
RICE PRODUCTION IN THAILAND.
Thailand : TAMRC International Research, 2004.
[7]. A Study on Factors Affecting Rice Production in Malaysia. Amer, Afizan . Malaysia : International Conference on Arts, Social Sciences and Technology iCAST, 2010.
[8]. PENGELOLAAN SUMBERDAYA IKLIM
DAN AIR UNTUK ANTISIPASI
PERUBAHAN IKLIM. Subagyono, Kasdi and
Surmaini, Elsa. Bogor : JURNAL
METEOROLOGI DAN GEOFISIKA, 2014. [9]. Badan Litbang Pertanian. Teknologi Mitigasi
Gas Rumah Kaca (Grk) Dari Lahan Sawah. 21-27, 2011.
[10]. Suryani, Erma. Pemodelan dan Simulasi.
Surabaya : Graha Ilmu, 2006.
[11]. Air passenger demand forecasting and passeer terminal capacity expantion: A system dynamics framework. Suryani, Erma, Chou, Shuo-Yan and Chen, Chih-Hsien. 37, s.l. : Expert System With Application, 2010.
[12]. Sterman, John D. Business Dynamics Systems: Thinking and modeling for a complex world.
s.l. : McGraw-Hill, 2000.
[13]. Multiple tests for validation of system dynamics type of simulation models. Barlas, Yaman. 1, USA : European Journal of Operational Research, 1989, Vol. 42.
[14]. FOOD AND AGRICULTURE
ORGANIZATION OF THE UNITED
NATIONS (FAO). climate-smart agriculture.
United Nations (FAO). [Online] 2017. http://www.fao.org/3/a-an177e.pdf.
[15]. Sequential Adoption and Cost Savings from
Precision Agriculture. Schimmelpfennig,
David and Ebel, Robert . s.l. : Journal of Agricultural and Resource Economics, 2016. ISSN 1068-5502.
[16]. Role Of Precision Farming For Sustainability Of Rice-Wheat Cropping System In Western Indo Gangetic Plains. Naresh, R. K. , et al. 2012, International Journal of Life Sciences Biotechnology and Pharma Research.
[17]. Precision Agriculture Technologies Positively Contributing to GHG Emissions Mitigation, Farm Productivity and Economics. Balafoutis, Athanasios , Beck, Bert and Fount, Spyros . 2017, Sustainability.