The binomial cumulative distribution function, or,
is my system better than yours?
Barbara Di Eugenio , Michael Glass , Michael J. Scott
Department of Computer Science University of Illinois, Chicago, IL USA
bdieugen, mglass @cs.uic.edu
Department of Mechanical and Industrial Engineering University of Illinois, Chicago, IL USA
Abstract
In human language technology, it is becoming more and more common to run systematic evaluations in which two or more systems, or two or more versions of the same system, are pitted one against the other. We propose the binomial cumulative distribution function as a way to assess the cumulative effect of the measures collected in such evaluations. We present an application of this measure to the evaluation of the NL interface to an Intelligent Tutoring System. We conclude by discussing a few issues pertaining to this statistical measure.
1. Introduction
In human language technology, it is becoming more and more common to run systematic evaluations in which two or more systems, or two or more versions of the same sys-tem, are pitted one against the other (Young, 1997; Carenini and Moore, 2000; Reiter et al., 2001). Such evaluations are generally conducted by having each system run in the same condition: for example, different groups of users of com-parable size interact with each system following a prepared script. During the experiments, a number of measures are collected. Measures may concern performance (e.g., time on task), or usability (i.e., answers to questions such as, was the system friendly?). These measures are then assessed in a pairwise fashion (Young, 1997; Carenini and Moore, 2000; Reiter et al., 2001). For example, to show that sys-tem B is better than syssys-tem A, one could stipulate that there must be at least one statistically significant measure in favor of B and no significant measure in favor of A.
However, reality is often much murkier that the ideal re-sult just described. A typical rere-sult of an evaluation may be that out of ten measures eight favor B and two favor A, but only two show statistical significance and those two point to opposite conclusions. In these situations, the evaluation does not support any conclusion on whether B is better than A. However, because the vast majority of measures is in fa-vor of one of the evaluated systems, a legitimate question arises: does the cumulative effect of the measures in favor of system B warrant the conclusion that B is better than A? The binomial cumulative distribution function (or sign test (Siegel and Castellan, 1988)) is the statistical measure that can answer this question. To our knowledge, it is not used in Human Language Technology. To use it, each mea-sure must be labeled as a success for one of the evaluated systems. In the example above, we have 2 successes for A and 8 for B. The binomial cumulative distribution function (BCDF for short) answers the question: what is the proba-bility that successes out of independent measures are due to chance (in our example, 8 successes out of 10
mea-sures)?
We will illustrate the usage of the BCDF in an evalu-ation we ran to assess the improvement to the NL inter-face of an Intelligent Tutoring System (ITS). We pitted two versions of the same system one against the other; the two versions differ in that the first produces very repetitive feed-back, the second more fluent feedback by using aggregation strategies. We collected 10 measures pertaining to the stu-dent’s performance, the knowledge s/he acquired, and the usability of the system.
By using the conventional pairwise assessment of mea-sures, only one measure approaches, but does not reach, statistical significance in favor of the second version of the system. However, all measures but one show a moderate preference for the second version. The BCDF confirms that the cumulative effect of these measures is not due to chance, i.e., it shows that the second version of the system outperforms the first.
In the last part of the paper, we will address a few is-sues pertaining to the usage of the BCDF. They include how to deal with ties and with apparently contradictory results. The latter situation arises when one or two statistically sig-nificant measures favor system A, but the cumulative effect favors system B.
2. The binomial cumulative distribution
function
The BCDF is applied to the case of two related sam-ples when the experimenter wishes to assess whether the two conditions are different. The null hypothesis tested by means of the BCDF is
!
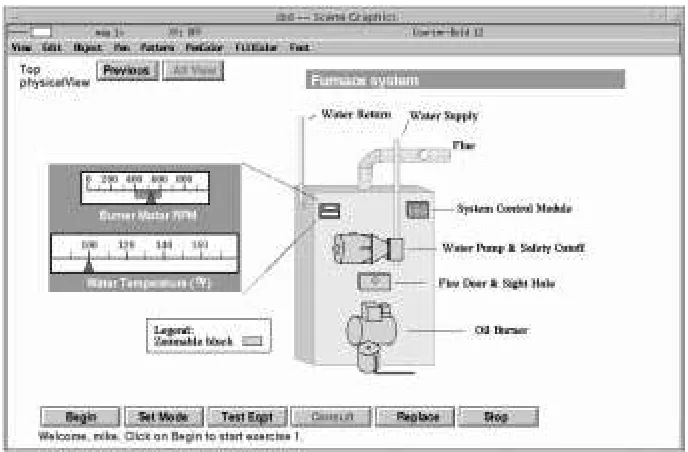
Figure 1: A screen from a DIAG application on home heating
trial run, then continued through the curriculum on his/her own. The curriculum consists of three problems of increas-ing difficulty. As there was no time limit, every student solved every problem. At the end of the experiment, each subject was administered a questionnaire.
A detailed log was collected for each subject. It in-cludes, for each problem: whether the problem was solved; total time, and time spent reading feedback; how many and which indicators and RUs the subject consults DIAG about; how many, and which RUs the subject replaces.
The questionnaire is divided into three parts. The first part tests the subject’s understanding of the domain. Be-cause the questions asked are fairly open ended, this part was scored as if grading an essay. The second part of the questionnaire asks the subject to rate the system’s feedback along four dimensions on a scale from 1 to 5 (see Table 3). The third part concerns the subjects’ remembering their ac-tions, specifically, the RUs they replaced. We quantify the subjects’ recollections in terms of precision and recall with respect to the log of the subject’s actions that the system collects. We also compute the F-measure, WX Y[Z]\_^a`Fb
X
Y
`KZcb , that smooths precision and recall off, withdfehg . In Table 2, we report the F-measure (precision and recall are .74 and .73 respectively forDIAG-orig, and .65 and .63 for DIAG-NLP).
DIAG-orig DIAG-NLP
Total Time 29.8’ 28.0’
Feedback Time 6.9’ 5.4’ Indicator consultations 11.4 5.9 RU consultations 19.2 18.1 Parts replaced 3.85 3.33
Table 1: Performance measures
Results. Tables 1, 2, and 3 show the results for the
cumu-lative measures across the three problems (individual prob-lems show the same trends).
DIAG-orig DIAG-NLP Essay score 81/100 83/100 RU recollection .72 .63
Table 2: Learning and recollection measures
DIAG-orig DIAG-NLP
Usefulness 4.35 4.47
Helped stay on right track 4.35 4.35 Not misleading 4.00 4.12
Conciseness 3.47 3.76
Table 3: Usability measures
Differences on individual measures are not statistically significant;indicator consultationscomes closest to statis-tical significance, as it exhibits a non-significant trend in favor ofDIAG-NLP(Mann-Whitney test, U=98, p=0.11). However, given that almost all individual measures are in favor of DIAG-NLP, we use the BCDF to assess whether
cumulativelythese measures show thatDIAG-NLP outper-formsDIAG-orig.
We consider only independent measures (total time and feedback time in Table 1 are not independent). For each measure, we decide for which system its value indicates a success — the magnitude of the difference is irrelevant.
Table 4 combines the independent measures from Ta-bles 1, 2 and 3 and shows whether they represent a success forDIAG-origorDIAG-NLP. BecauseHelped stay on right trackis a tie and can therefore be considered a success for either system, we will report two sets of statistics (see dis-cussion of ties below). The probability of 9 successes out of 10 measures is p = 0.011, of 8 successes out of 10 measures is p = 0.0545 (in the former case, we considerHelped stay on right track a success forDIAG-NLP, in the latter, for
Measure
1-bcdf(7,10,0.4) 0.0123 1-bcdf(5,10,0.35) 0.0949 1-bcdf(4,10,0.33) 0.2064 1-bcdf(3,10,0.3) 0.3504 1-bcdf(2,10,0.2) 0.3222 1-bcdf(1,10,0.1) 0.2639 1-bcdf(0,10,0.06) 0.4614
Table 5: for different subsets of measures
that B outperforms A overall; still, in this case it seems that it is worth considering individual performance measures.
The calculation of the -value in favor of A shows that it will not always be the case that the strongest significance will be obtained by considering the probability that all mea-sures in favor of one system exceed the weakest measure in favor of that system. For each system, one probability cal-culation can be made for each subset of measures in favor of that system, and the strongest significance should be con-sidered. We saw above which of two measures in favor of A was the stronger. For B, there are seven possible measures (not eight, because two measures have the same -value, 87 ), as illustrated in Table 5. Note that the signif-icance level is not monotonic in the number of measures considered.
5. Conclusions
We have proposed that the binomial cumulative distri-bution function (or sign test) can be used to assess the cu-mulative effect of the measures collected in systematic eval-uations that pit two systems, or two versions of the same system, one against the other. We have presented an appli-cation of the BCDF to the evaluation of the NL interface to an Intelligent Tutoring System. We have also discussed a few issues pertaining to the usage of the BCDF. They in-clude how to deal with ties, and with apparently contra-dictory results. The latter situation arises when one or two statistically significant measures favor system A, but the cu-mulative effect favors system B.
Acknowledgements. This work is supported by grants
N00014-99-1-0930 and N00014-00-1-0640 from the Office of Naval Research, Cognitive, Neural and Biomolecular S&T Di-vision. We are grateful to CoGenTex Inc., in particular to Mike White, for making EXEMPLARS available to us.
6. References
Giuseppe Carenini and Johanna D. Moore. 2000. An em-pirical study of the influence of argument conciseness on argument effectiveness. InProceedings of the 38th An-nual Meeting of the Association for Computational Lin-guistics, Hong Kong.
Hercules Dalianis. 1996. Concise Natural Language Gen-eration from Formal Specifications. Ph.D. thesis, De-partment of Computer and Systems Science, Stocholm UNiversity. Technical Report 96-008.
Xiaoron Huang and Armin Fiedler. 1996. Paraphrasing and aggregating argumentative text using text structure. In Proceedings of the 8th International Workshop on
Natural Language Generation, pages 21–30, Sussex, UK.
Mike Reape and Chris Mellish. 1998. Just whatis aggrega-tion anyway? InProceedings of the European Workshop on Natural Language Generation, Toulouse, France. Ehud Reiter, Roma Robertson, A. Scott Lennox, and Liesl
Osman. 2001. Using a Randomised Controlled Clin-ical Trial to Evaluate an NLG System. In ACL-2001, Proceedings of the 39th Annual Meeting of the Asso-ciation for Computational Linguistics, pages 434–441, Toulouse, France.
James Shaw. 1998. Segregatory coordination and ellipsis in text generation. In Proceedings of the 36th Annual Meeting of the Association for Computational Linguis-tics, pages 1220–1226, Montreal, Canada.
Sidney Siegel and N. John Castellan, Jr. 1988. Nonpara-metric statistics for the behavioral sciences. McGraw Hill.
Douglas M. Towne. 1997. Approximate reasoning tech-niques for intelligent diagnostic instruction. Interna-tional Journal of Artificial Intelligence in Education. Ronald E. Walpole, Raymond E. Myers, and Sharon L.
My-ers. 1998. Probability and Statistics for Engineers and Scientists. Prentice Hall, sixth edition.
Michael White and Ted Caldwell. 1998. Exemplars: A practical, extensible framework for dynamic text gener-ation. InProceedings of the Ninth International Work-shop on Natural Language Generation, pages 266–275, Niagara-on-the-Lake, Canada.
R. Michael Young. 1997. Generating Descriptions of Complex Activities. Ph.D. thesis, Intelligent Systems Program, University of Pittsburgh.
The visual combustion check is igniting which is abnormal in this startup mode (normal is combusting)
Oil Nozzle always
produces this abnormality when it fails. Oil Supply Valve always
produces this abnormality when it fails. Oil pump always
produces this abnormality when it fails. Oil Filter always
produces this abnormality when it fails. System Control Module sometimes
produces this abnormality when it fails. Ignitor Assembly never
produces this abnormality when it fails. Burner Motor always
produces this abnormality when it fails. and, maybe others affect this test.
The visual combustion check indicator is igniting which is abnormal in startup mode. Normal in this mode is combusting.
Within the Oil Burner
These replaceable units always produce this abnormal indication when they fail: Oil Nozzle;
Oil Supply Valve; Oil pump;
Oil Filter; Burner Motor.
The Ignitor assembly replaceable unit never produces this abnormal indication when it fails.
Within the furnace system,
The System Control Module replaceable unit replaceable unit sometimes produces this abnormal indication when it fails.
Also, other parts may affect this indicator.