Scholarship@Western
Scholarship@Western
Electronic Thesis and Dissertation Repository
3-22-2013 12:00 AM
Effects of Additive Modification on Flow Properties of Fine
Effects of Additive Modification on Flow Properties of Fine
Coating Particles
Coating Particles
Danni Bao
The University of Western Ontario
Supervisor Jesse Zhu
The University of Western Ontario
Graduate Program in Chemical and Biochemical Engineering
A thesis submitted in partial fulfillment of the requirements for the degree in Master of Engineering Science
© Danni Bao 2013
Follow this and additional works at: https://ir.lib.uwo.ca/etd
Part of the Chemical Engineering Commons
Recommended Citation Recommended Citation
Bao, Danni, "Effects of Additive Modification on Flow Properties of Fine Coating Particles" (2013). Electronic Thesis and Dissertation Repository. 1164.
https://ir.lib.uwo.ca/etd/1164
This Dissertation/Thesis is brought to you for free and open access by Scholarship@Western. It has been accepted for inclusion in Electronic Thesis and Dissertation Repository by an authorized administrator of
(Thesis format: Monograph)
by
Danni Bao
Graduate Program in Chemical and Biochemical Engineering
A thesis submitted in partial fulfillment of the requirements for the degree of
Master of Engineering Science
The School of Graduate and Postdoctoral Studies The University of Western Ontario
London, Ontario, Canada
ii
Abstract
The major challenge in fine powder coating technology is to improve the flowability of powders, so that the fine particles can be fluidized, pneumatically transported and then sprayed onto substrates homogenously. Although this can be achieved by adding commercial inorganic nanoparticles as flow additives, it also causes problems including film defects (seeds and fish eyes), because the inorganic additives are not fully compatible with the organic fine powder coating materials during curing. In this study, the concept of modified additives were exploited to improve the film quality and to enhance the performance of the modified additives on improving the flowability of the fine coating powders. The modified additives were produced by encapsulating the commercial nano-additives with three organic materials, epoxy, polyester and hybrid with a wet encapsulation method. The encapsulated additives were evaluated by TEM to make sure they are still in nano-scale.
Functionality tests of the modified additives were conducted through the flowability measurements of fine polyurethane coating powder samples with modified additives. Sixty-six fine powder samples were tested for their angle of repose (AOR, a semi-static flowability) and avalanche angle (AVA, a dynamic flowability test). The results showed that both AOR and AVA were significantly affected by the encapsulating materials and their weight percentage, as well as the total loading radios of additives used in fine powders.
An adhesion force model was proposed to reveal the mechanism on how the additive improving the flowability of fine powder. Based on this model, the optimum loading ratio of the additive for fine particles were predicted, which agreed well with the experimental results. Thus, this model can be used to predict the optimum loading ratio of the additive for different host particle sizes.
Keywords
iii
Acknowledgments
Foremost, I would like to express my sincere gratitude to my supervisor Dr. Jesse Zhu. He offered a wonderful opportunity to me to start my Master program. His trust, patience,
encouragement and guidance helped me in all the time of research and writing of this thesis.
All his efforts ensured the successful fulfillment of this study, and will be beneficial to my future work.
Much appreciation is extended to my co-supervisor Dr. Hui Zhang for his immense knowledge, discussion and patient guidance in all the time of research and writing of this thesis. His valued expertise and professional experience provided a great support to enhance this study.
My special gratefulness is directed to Dr. Long Sang. His suggestion on writing, constructive advices and assistance with experimental works ensured the successful completion of this study. As my schoolmate, friend and husband, Long offers great understanding and encouragement both in my research and in my life. Thank you for the continuous supports.
I would like to say many thanks to Mrs. Yingliang Ma and Mr. Michael Zhu, Mr. Jianzhang Wen for assisting the experiments conducting and valued suggestion. I also wish to take this opportunity to thank the help and friendship from my group mates: Bhuiyan Mohammad, Tang Li, Jing Fu, Lucy Xia, Rezwana Yeasmin, Qing Mu, Yong Liu, Tracy Wang and Shan Gao. Many thanks are extended to Zhi Zhang, Kristen Hunt and Kara Malott for their support.
iv
Table of Contents
Abstract ... ii
Acknowledgments... iii
Table of Contents ... iv
List of Tables ... vii
List of Figures ... viii
List of Abbreviations, Symbols and Nomenclature ... x
Chapter 1 ... 1
1 Introduction ... 1
1.1 Fine Powder Coating Technology and its Limitation in the Industry ... 1
1.2 Objectives ... 3
1.3 Thesis Structure ... 4
1.4 Contributions... 5
Chapter 2 ... 7
2 Literature Review ... 7
2.1 Fine Powder Coating... 7
2.2 Flow Characteristic of Fine Particles ... 8
2.3 Flow Conditioners ... 11
2.4 Surface Modification of Nano-Particles ... 13
2.5 Fine Powder Coating in the Industry ... 13
Chapter 3 ... 15
3 Experimental Procedures and Measurement Techniques ... 15
3.1 Procedures ... 15
3.1.1 Preparation of Additives ... 17
3.1.2 Coating Powder Samples ... 19
3.2 Experimental Methods ... 22
3.2.1 Particle Size ... 22
3.2.2 Jet Mill ... 23
3.2.3 Mixers ... 24
3.2.4 Scanning Electron Microscopy ... 25
3.2.5 Angle of Repose ... 25
3.2.6 Avalanche Angle ... 27
v
3.3.1 Panel Spray ... 29
3.3.2 Gloss and Thickness ... 29
Chapter 4 ... 32
4 Semi-static Flow Characterization of Powders with Modified Additives ... 32
4.1 Introduction ... 32
4.2 Effect of R-E Ratio on Flowability of FPP Samples ... 33
4.3 Effect of Additive Coating Materials on Flowability of Coating Powder ... 36
4.4 Effect of Additive Loading Ratio on Flowability of FPP Samples ... 37
4.5 Chapter Summary ... 41
Chapter 5 ... 43
5 Dynamic Flow Characterization of Powders with Modified Additives ... 43
5.1 Introduction ... 43
5.2 Effect of R-E Ratio on Flowability of FPP Samples ... 43
5.3 Effect of Additive Coating Materials on Flowability of Coating Powder ... 45
5.4 Effect of Additive Loading Ratio on Flowability of FPP Samples ... 47
5.5 Chapter Summary ... 50
Chapter 6 ... 51
6 Comprehensive Characterization of Fine Powder Samples ... 51
6.1 Introduction ... 51
6.2 Fine Powder Flow Property Comprehensive Evaluation ... 52
6.2.1 Semi-static Flowability ... 52
6.2.2 Dynamic Flowability ... 54
6.3 Correlation between Semi-static and Dynamic Flowability ... 56
6.3.1 Different LOA and R-E Ratio ... 56
6.3.2 Different Encapsulating Materials ... 58
6.4 Chapter Summary ... 59
Chapter 7 ... 60
7 Modeling of Cohesion Force of Fine Particles with Flow Conditioner ... 60
7.1 Modeling ... 60
7.2 Effects of Powder Particle Size ... 66
7.3 Chapter Summary ... 68
Chapter 8 ... 69
vi
8.1 Conclusions ... 69
8.2 Recommendations ... 71
References ... 72
Appendices ... 77
A1 Particle Size ... 77
A2 Film Quality ... 78
A3 Semi-static Flowability ... 80
A3.1 Original Data ... 80
A3.2 Error Analysis ... 83
A4 Dynamic Flowability ... 85
A4.1 Original Data ... 85
A4.2 Error Analysis ... 88
vii
List of Tables
Table 1.1 Comparison of unit prices between commercial and modified
additives ... 6
Table 2.1 Classification of flow properties by angle of repose (Cheremisinoff and Cheremisinoff 1984) ... 9
Table 2.2 Classification of flow properties by Carr’s flowability index (Carr 1965) ... 9
Table 2.3 Various factors affecting on the performance of the additives ... 12
Table 2.4 Modification methods of nano-particles ... 13
Table 3.1 List of materials used in this study ... 16
Table 3.2 Mass ratio between encapsulating materials and nano-additive ... 18
Table 3.3 List of sixty-six FPP samples ... 21
Table 3.4 FPP samples classification by R-E ratio ... 21
Table 3.5 FPP samples classification by LOA ... 22
Table 3.6 FPP samples classification by encapsulating materials ... 22
Table 3.7 Comparison of film quality for FPP-LOA0.8% sample ... 31
Table 7.1 SAC of host particle covered by additives ... 64
Table A.1 Particle size of polyurethane powder coating (FPP) samples ... 77
Table A.2 Particle size of polyurethane powder coating (FPP) sample ... 77
Table A.3 Film gloss of coated panels (FPP-LOA0.8%)... 78
Table A.4 Film thickness of coated panels (FPP-LOA0.8%) ... 78
Table A.5 Seeds number in unit panel area (FPP-LOA0.8%) ... 79
Table A.6 Angle of repose for FPP-Epoxy samples ... 80
Table A.7 Angle of repose for FPP-Polyester samples... 81
Table A.8 Angle of repose for FPP-Hybrid samples ... 82
Table A.9 Angle of repose for Control samples ... 82
Table A.10 Avalanche angle for FPP-Epoxy samples ... 85
Table A.11 Avalanche angle for FPP-Polyester samples ... 86
Table A.12 Avalanche angle for FPP-Hybrid samples ... 87
Table A.13 Avalanche angle for Control Samples ... 87
viii
List of Figures
Figure 1.1 Geldart’s Powder Classification ... 2
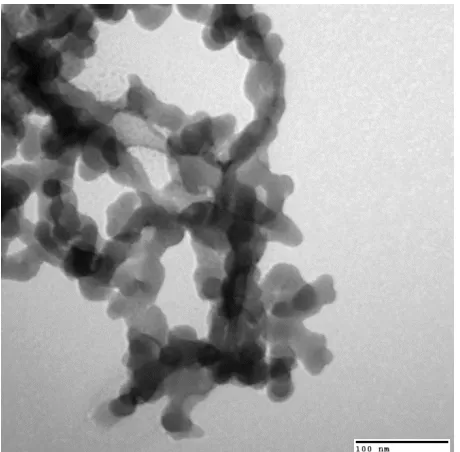
Figure 1.2 TEM image of “tree structure” of nano-additive (nano-silica) ... 3
Figure 2.1 Surface profiles of panels (a) coated by coarse powder (b) coated by fine powder (Zhu and Zhang 2005) ... 8
Figure 2.2 Comparison of film thickness (a) coarse powder film (b) fine powder film (Huang 2009)... 8
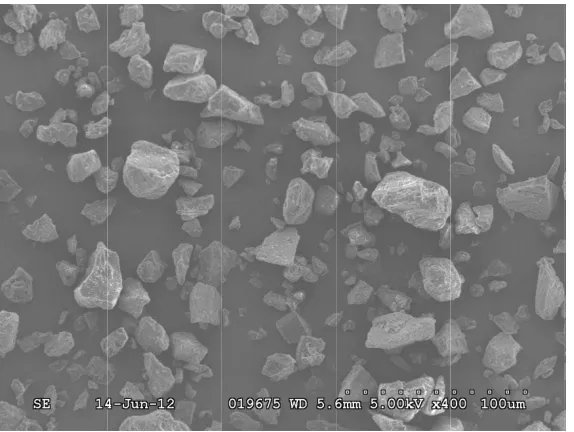
Figure 3.1 SEM image of fine polyurethane powder (D50=22 micron) ... 16
Figure 3.2 Flow chart for encapsulation of additive ... 17
Figure 3.3 TEM image of 15 % PE encapsulated nano-additive (130k magnification) ... 19
Figure 3.4 Flow chart for preparation of powder samples ... 20
Figure 3.5 SEM images of FPP sample with 0.8% additive (5%-Epoxy) (a) 1k magnification (b) 9k magnification ... 20
Figure 3.6 (a) Laser particle size analyzer, BT-9300S (b) PSD of fine polyurethane powder ... 23
Figure 3.7 Jet mill system, PTRC JM-2 ... 24
Figure 3.8 Vorti-Siv ultrasonic sifter, RBF-12... 24
Figure 3.9 Scanning electron microscope, S-2600N ... 25
Figure 3.10 Powder characteristic tester, PT-N ... 25
Figure 3.11 Schematic of AOR measurement ... 26
Figure 3.12 Revolution powder analyzer ... 27
Figure 3.13 Schematic of AVA measurement (a) AVA test system (b) Avalanche Angle ... 28
Figure 3.14 EasySelect-Cup manual powder gun ... 29
Figure 3.15 Coating thickness gauge, PosiTector® 6000 ... 30
Figure 3.16 Gloss meter, NOVO-GLOSSTM ... 30
Figure 4.1 TEM images of 15% R-E ratio of polyester (130k magnification) ... 33
Figure 4.2 Effects of R-E ratio on AOR (a) FPP-Epoxy (b) FPP-PE (c) FPP-Hybrid ... 35
Figure 4.3 Effect of Encapsulating Materials on AOR (FPP-LOA0.8%) ... 37
Figure 4.4 Effects of LOA on AOR (a) FPP-Epoxy (b) FPP-PE (c) FPP-Hybrid ... 39
ix
Figure 5.1 Effects of R-E ratio on AVA (a) FPP-Epoxy (b) FPP-PE (c)
FPP-Hybrid ... 45
Figure 5.2 Effects of Encapsulating Materials on AVA (FPP-LOA0.8%) ... 46
Figure 5.3 Effects of additive loading ratio on AVA (a) FPP-Epoxy (b)
FPP-PE (c) FPP-Hybrid ... 49
Figure 6.1 Effects of LOA & R-E Ratio on AOR (a)FPP-Epoxy (b) FPP-PE (c)
FPP-Hybrid ... 54
Figure 6.2 Effects of LOA & R-E Ratio on AVA (a)FPP-Epoxy (b) FPP-PE
(c) FPP-Hybrid ... 56
Figure 6.3 Correlation between semi-static and dynamic flowability of fine
coating powder under different LOA ... 57
Figure 6.4 Correlation between semi-static and dynamic flowability of fine
coating powder under different R-E ratio ... 58
Figure 6.5 Correlation between semi-static and dynamic flowability of fine
coating powder under different encapsulating materials ... 59
Figure 7.1 (a) Contact of fine coating particle and additive particles (b)
Location of additive particles ... 61
Figure 7.2 Cohesion force vs. LOA under various effective surface area
coefficient ... 65
Figure 7.3 Dimensionless force between particles vs. LOA for different host
particle size (η=0.1) ... 66
Figure 7.4 Effects of LOA on flowability of fine particles under different host
particle size (η=0.1) (a) theoretical value (b) experimental value ... 68
Figure A.1 Error analysis of AOR for FPP samples (a) FPP-Epoxy (b) FPP-PE
(c) FPP-Hybrid ... 84
Figure A.2 Error analysis of AVA for FPP samples (a) FPP-Epoxy (b) FPP-PE
(c) FPP-Hybrid ... 89
x
List of Abbreviations, Symbols and Nomenclature
Abbreviations
ACM Air classifying mill AVA Avalanche Angle AOR Angle of Repose ESA Effective surface area
HEPA High-efficiency particulate air LOA Loading ratio of additive PE Polyester resin
FPP Fine polyurethane coating powder PSD Particle size distribution
PTRC Particle Technology Research Centre PU Polyurethane resin
R-E Resin-to-Encapsulated additive SAC Surface area coverage
xi
Symbols and Nomenclature
η Effective surface area coefficient (-)
D10 Particle diameter where 10 volume % of the powder has a smaller diameter (μm)
D50 Particle diameter where 50 volume % of the powder has a smaller diameter (μm)
D90 Particle diameter where 90 volume % of the powder has a smaller diameter (μm)
Fvan van der Waals force (N) A Hamaker Constant (10-19J) R Host partial size (m)
H0 Distance between the surfaces of two host particle (m) S Surface area (m2)
SHG Surface area of host particle which is coated by guest particles (m2) Shost Surface area of host particle (m2)
Sguest Surface area of guest particle (m2)
Fvan, HG van der Waals force between host particles coated by guest particles (N) N The number of guest particles coated on the host particle (pc)
d Diameter of guest particle (m2) D Diameter of host particle (m2)
ρd Density of guest particle (kg/m3)
Chapter 1
1
Introduction
1.1 Fine Powder Coating Technology and its Limitation in
the Industry
Compared to liquid coating, powder coating technology has gained popularity, because it is not only environmentally friendly but also cost effective for high powder recyclability and elimination of organic solvent (Gemmer 1995; Licari 2003). However, traditional powder coating has some disadvantages, such as the film surface appearance being inferior to liquid coating and the film thickness being much higher than that of liquid coating. In order to overcome these issues, fine powder coating was introduced in 2005 (Zhu and Zhang 2005), where the particle size of coating powder is reduced from 30~60 micron to 10~30 micron. Such a reduction in powder size can greatly improve the film surface appearance and reduce the film thickness (Zhu and Zhang 2005). Similar film surface quality can be obtained compared with liquid coating.
Figure 1.1 Geldart’s Powder Classification
From previous research and industrial practice, it is well known that some types of nano particles are ideal as flow conditioners because they can form “tree structure” with low bulk density as shown in Figure 1.2. These nano-particles can attach onto the surface of coating particles and reduce the inter-particle adhesion force between the fine particles, so as to improve the flowability of the fine powders effectively. There are several commercial nano additives used in the fine powder coating industry. However, the commercially used nano additives are usually inorganic materials which have poor compatibility and dispersibility with the organic coating powders. This may cause film defects such as fisheyes and seeds. The seeds is formed by small agglomerates of additive particles in this case. And the fisheyes are appeared due to a large surface depression in a coating film caused by a bad compatibility of nano-additive agglomerations with powder coating system. One way to solve this problem is to use organic nano additives to replace the inorganic ones, but previous research in our group has shown that organic nano-particles cannot increase the flowability of fine powders effectively, and the costs of manufacturing the organic nano particles are extremely high. Therefore, it is not feasible for application in industry.
5 4 3 2
1
0.5
0.2
20 50 100 200 500 1000
C
A
B
D
6 7
Particle Size (Microns)
Pa
rt
ic
le Den
s
it
y
Diff
erence (g/m
Figure 1.2 TEM image of “tree structure” of nano-additive (nano-silica)
In this study, inspired by encapsulation technology, the method of encapsulating inorganic nano particles with organic materials is proposed to produce the ideal nano additive that can improve the flowability of fine powders and at the same time, have good compatibility and dispersibility with the fine powders.
1.2 Objectives
Corresponding to the needs mentioned above, the present study focuses on flow property evaluation of fine coating powders with the encapsulated nano-additive and aims to address the following objectives:
to develop a new type of nano additive which has both flow conditioner function and good compatibility with organic fine powders based on the encapsulation technology;
to evaluate the quality of films coated by fine powders with encapsulated additive, and to compare the differences among various encapsulating materials;
to experimentally study the semi-static and dynamic flowability of fine powders with different encapsulated additives;
1.3 Thesis
Structure
This thesis consists of seven chapters and follows the "monograph" format as outlined by the Master's Programs of GENERAL THESIS REGULATIONS by the School of Graduate and Postdoctoral Studies (SGPS) in the University of Western Ontario (UWO). A summary of each chapter is provided below.
In chapter 1, a general introduction is provided. The project overview is stated, as well as the thesis structure and major contributions of this research.
In chapter 2, the background of fine powder coating technology, flow properties of fine coating particles and modification of flow conditioners are provided by reviewing the research papers. The application of fine powder coating in industry is briefly summarized.
Chapter 3 provides the details of fine host powder (polyurethane based) preparation, encapsulated nano-additives preparation, the experimental apparatus and the testing equipments.
In chapter 4, the effects of the encapsulated additives on the semi-static flow characteristic of fine powder are investigated. Sixty-six samples including five different loading ratios of encapsulated additive, three different encapsulating materials with four different resin-to-encapsulated silica (R-E) ratios and six control groups, were prepared and evaluated by the Angle of Repose (AOR). Then the optimum value of each parameter is found in this chapter.
Based on the experimental data in Chapter 4 and Chapter 5, Chapter 6 compared the semi-static and the dynamic flowability of each sample. A mathematical correlation of AOR and AVA is proposed with a narrow error band (±3%). This correlation is
independent of the additive encapsulating materials and additive loading ratio.
In chapter 7, an adhesion force model was established and validated to generalize the effects of additive loading ratio on the flowability of fine powders. As well the discussions about the effect of surface area coefficient (η) and host particle size on cohesion force were conducted.
Summarized in chapter 8 are the general conclusions and recommendations of this study.
1.4 Contributions
There are three major contributions made by this study:
1. A new type of flow conditioner, encapsulated nano additive is proposed for fine powder coating technology. Because such a new type of additive is produced by encapsulating the commercial inorganic nano additive with organic materials, it not only has the characteristics of nano-size but also has better compatibility and dispersibility with fine coating powders. The performance of the encapsulated additives on improving the film quality and flowability of the fine powders are studied and the results are quite promising.
2. An adhesion force model is proposed to evaluate the quantitative effects of fine coating particle (host particle) size, the additive particle size and the loading ratio of additive on the adhesion forces between the host particles, so that the flowability of fine powders can be estimated. Before this study, those effects on powder flowability only can be studied by experimental methods.
introducing resins as the encapsulating material, the amount of the commercial nano particles needed is reduced. The fact that the price of the resin is much lower than the nano-particles, makes the cost of applying modified nano additive further reduced even with an extra modification process being added. The detailed comparison can be seen in Table 1.1.
Table 1.1 Comparison of unit prices between commercial and modified additives
R-E ratio Loading ratio of commercial additive
Price of
additive per KG Cost reduced
0% 100% $25.00 0%
5% 95% $23.83 4.7%
10% 90% $22.65 9.4%
15% 85% $21.48 14.1%
Chapter 2
2
Literature Review
2.1 Fine Powder Coating
Powder coating processes for metal substrates are often applied by using a fluidized bed and electrostatic spray techniques. Coating powder is fluidized by air in a fluidized bed. The fluidized powder is transported into a spray gun through a pipeline where the powder is charged electrostatically by a Venturi system. The charged powder is then sprayed onto the conductive substrate. After curing in an oven under a suitable temperature, a uniform film formed by the powder paints is formed.
H ap pr fl
2
In fl (V br fl Fig Fig However, the pplication o roperties of low propertie2.2 Flow
n general, m low function Valverde et reakthrough lowability in (a) (b)
ure 2.1 Su (b) co
gure 2.2 C
e current use f fine powd the fine pow es.
w Charac
many parame n (Jenike 1
al. 2000), h fluidization
ndex (Carr 1
)
urface profil ated by fine
Comparison (b) fine po
e of these fin er technolog wders. Much
cteristic o
eters can be 964), angle Hausner rat n gas veloc 965). Gener
les of panels e powder (Z
of film thic owder film (
ne powders s gy greatly de h research h
of Fine P
e employed of repose tio (Grey an city (Huang rally, the flow
(a)
s (a) coated Zhu and Zha
ckness (a) co (Huang 200
still has som epends on th has been carr
Particles
to evaluate (Geldart et nd Beddow 2009; Hua wability of p
by coarse p ang 2005)
oarse powde 09)
me challenge he understan ried out to c
the flow pr al. 2006), 1969; Cone ang et al. 2 powders can
powder
er film
s. Obviously nding of the characterize
roperties, suc avalanche a esa et al. 2 2010) and C n be characte
based on those parameters. For example, according to the angle of repose, the powders can be categorized into five groups (Cheremisinoff and Cheremisinoff 1984), from very free-flowing to very cohesive, as shown in Table 2.1. While according to the Carr’s flowability index (Carr 1965), seven ratings are generated from very good flowability to very poor flowability as shown in Table 2.2.
Table 2.1 Classification of flow properties by angle of repose (Cheremisinoff and Cheremisinoff 1984)
Flow Properties Angle of Repose ( °)
Very free-flowing 25-30
Free flowing 30-38
Fair to passable flow 38-45
Cohesive 45-55
Very cohesive 55-70
Table 2.2 Classification of flow properties by Carr’s flowability index (Carr 1965)
Flow Properties Carr’s flowability index
Very good 90-100
Fairy good 80-89
Good 70-79
Normal 60-69
Not good 40-59
Poor 20-39
Very poor 0-19
(Krantz et al. 2009) investigated the semi-static and dynamic flow properties of fine powders and successfully correlated them. All the above researches provide feasible ways to evaluate the flowability of fine powders. This is important because only the fine powders that show good flowability can be used for coating.
However, it is well known that fine coating powders usually belong to Group C powder (Geldart 1973), which are difficult to fluidize under normal conditions due to the poor flow properties (Pacek and Nienow 1990; Wang et al. 1998). Defluidizing, channeling or chocking always happen when fluidizing Group C powder (Antony et al. 2004). Such bad flow properties can result an undesirable powder coating performance. Many researchers (Visser 1989; Chen et al. 2008) have reported the undesirable flow properties of fine powder being dominated by interparticle adhesion forces, especially the van der Waals force. Huang et al. (Huang 2009; Huang et al. 2010) also measured the interparticle forces by an interfacial force microscope to provide an interparticle force range.
According to the different working principles and applications, two methods may be employed to improve the flowability of fine powders: one is to apply extra energy, and the other is to modify the particle surface. For the energy method, various forms of energy can be introduced, including mechanical vibration (Mori et al. 1990; Xu and Zhu 2006), loading pressure (Kono et al. 1990), acoustic waves (Montz et al. 1988), magnetic disturbance (Liu et al. 2006) and mechanical agitation (Kim and Han 2006) and so on. Meanwhile, for the method of surface modification, to reduce the interparticle forces, a small amount of flow conditioner can be used, such as gas (Geldart and Abrahamsen 1978), liquid (Danish and Parrott 1971) and nano particles (Hollenbach et al. 1983; Zhu and Zhang 2004). In the powder coating process, the concept of flow conditioner is well accepted.
F AR R
R R 6H (2-1)
where A is the Hamaker Constant (10-19J), R and R are the fine particle sizes, and H is the distance between two host particle's surfaces.
In order to improve the flowability of fine powders, one feasible way is to introduce a small amount of flow conditioner into the fine powders to increase the distance between the fine particles so as to decrease the interparticle forces.
2.3 Flow
Conditioners
A flow conditioner (flow additive) was firstly used to maintain powders in a steady flow and/or to increase its flow rate through an orifice located at the base of a container (Irani et al. 1960). Later on, during the past several decades, many researchers found that by introducing additives, the flowability of fine powder can be improved significantly for different applications. There are many theories on the mechanism how the flow conditioner improves the flowability of fine powders. Some researchers believed that the flow conditioner (additive) works as a neutralizer to reduce electrostatic charge (Dutta and Dullea 1990), while some others considered flow conditioner was acting like a ball bearing to reduce the internal friction (Hollenbach et al. 1983; Kono et al. 1989). The most popular theory is that the flow conditioner reduces the van der Waals forces between the fine particles (Visser 1989; Chen et al. 2008; Xu et al. 2009). This theory has been well accepted in the powder coating field. Many commercial nano particles, such as nano silica, nano titanium dioxide and nano alumina etc, are found to be ideal flow conditioners in the fine powder coating processes.
Hollenbach et al. 1983). Meanwhile, for the automotive coating, silica, titanium dioxide and aluminum oxide etc. are used as flow conditioners (Thomas et al. 2009).
From Table 2.3, it is can be noticed that most of the flow conditioners are inorganic materials. However, the coating materials are usually thermoplastic and thermosetting plastic resins, such as polyester, epoxy and hybrid. Such differences in materials can cause compatibility issues between the flow conditioner and fine coating particles, resulting in film defects. One possible way to solve the compatibility problem is to use organic nano particles instead of inorganic nano flow conditioner. However, some previous works done by our group have proven that the organic nano particles can hardly improve the flowability of the fine particles (Zhu and Zhang 2005). Then, the method of encapsulating inorganic nano particles with organic materials came to our mind, to produce the ideal nano additive that can improve the flowability of fine powders and have good compatibility and yet dispersibility with the fine powders.
Table 2.3 Various factors affecting on the performance of the additives
Additive materials
Host particles materials
Additive size (nm)
Additive concentrations
Mixing methods
Silica, Silicates, Phosphates, Salts, Stearic acid, Titanium dioxide, Aluminum oxide, ect.
Resins, Aluminum, Iron, Glass beats,
Salts, Protein Cornstarch, ect.
10 ~10 , larger
Related with both guest and host
particle sizes
Stirring, Sieving, Fluidized, Shacking,
ect.
2.4 Surface Modification of Nano-Particles
Encapsulation is an effective way to modify nano particles. It has been used in some research fields based on the various application requirements (J. Ruys and Mai 1999). For example, encapsulated nanoparticles can be used for control release of drugs, genes, and other bioactive agents (Leroux et al. 1996; Cohen et al. 2000). Generally, the nano particles can be modified to achieve specific physical, structural, biomedical, optical, electronic and chemical properties by encapsulating or coating a thin "shell" on their surface. The encapsulation methods can be classified into two categories: dry method and wet method, as summarized in Table 2.4.
Table 2.4 Modification methods of nano-particles
Method Researchers
Dry Method
Physical vapor deposition (Zhang et al. 2000)
Plasma treatment (Shi et al. 2001) (Vollath and Szabó 1999)
Chemical vapor deposition (Oku et al. 1998)
Anti-solvent process (Wang et al. 2004)
Wet Method
Sol-Gel (J. Ruys and Mai 1999) (Zhang and Goldfarb 2001)
Solvent evaporation
(Cohen et al. 2000) (Hrkach et al. 1997) (Wang et al. 1999)
In order to improve the dispersibility of inorganic nano particles in organic media, the inorganic particles encapsulated by organic materials (polymers) has been developed in some research (Sato and Ruch 1980; Asua 1997). However, there have been no studies on the performance of the modified nano particles on improving the flowability of the fine powders.
2.5 Fine Powder Coating in the Industry
Chapter 3
3
Experimental Procedures and Measurement
Techniques
This study consists of two major parts of work: additive modification, which involves encapsulation of commercial nano-additives with three types of resins (polyester, epoxy and hybrid), and evaluation of the flowability of fine powder samples (with modified additives), which involves two main measurement techniques (angle of repose and avalanche angle).
A film quality evaluation for sprayed panels are also carried out based on film thickness, film gloss and seeds number (per unit surface area) to show the advantages of the encapsulation of the additives.
3.1 Procedures
T D en d p m F C A M M Figure The nano-add Degussa AG
ncapsulate t ifferent mat olyurethane materials is su
Fine Powder Commercial Additive Modification Materials 3.1 SEM ditive used G. Three dif the additive terial-to-addi powder wit ummarized i Tabl Material Polyuretha Nano-Silic Epoxy Polyeste Hybrid
image of fin
in this stud fferent mate . For each itive mass r th five diffe in Table 3.1
e 3.1 List
s
ane
ca AERO
er D.E CRYLC CRYL D.E. ne polyureth
dy is a nano erials, epoxy material, it ratios. Then erent loading
.
t of materia
Type
--
OSIL®R972
E.R.™ 661
COAT®2689-0
LCOAT 316 R.™ 672U hane powde o-silica (AE y, polyester was coated the additive g ratios. De
als used in th
Suppliers Seibert Degussa 0 Dow Cytec Cytec Dow
er (D50=22 m
EROSIL®R97 r and hybrid d on the ad es were mix etailed inform his study s Pa 2 7 4
a (Ave
micron)
72) produce d, were use dditive with xed with the
mation of al
article size
22μm (D50) 7μm (D10) 44μm (D90)
3.1.1
Preparation of Additives
For the nano-material encapsulation, there are many methods, such as chemical vapor deposition (Oku et al. 1998), physical vapor deposition (Zhang et al. 2000), sol–gel method (J. Ruys and Mai 1999) and anti-solvent process (Wang et al. 2004). In this study, since the integrity and uniformity of encapsulation film was not the primary concern, an effective and economic process, wet encapsulation method, was adopted.
The additive encapsulation was carried out in three steps, weighing, modification and milling, as shown in Figure 3.2.
Figure 3.2 Flow chart for encapsulation of additive
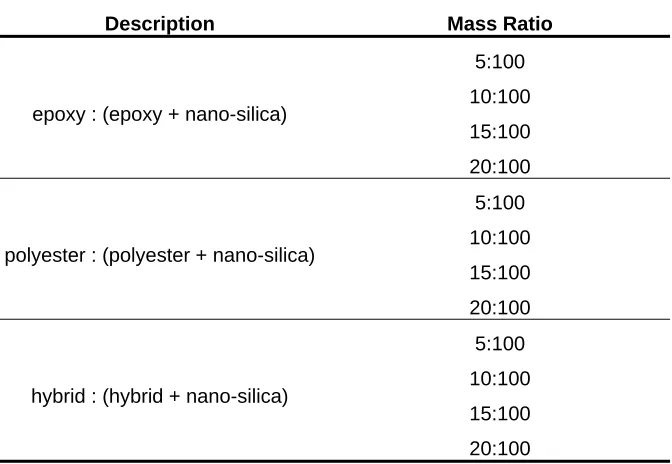
Weighing -- Weighing all the materials separately, the detailed mass ratios are listed in
Table. 3.2.
•PE, Epoxy, Hybrid •Nano‐Silica •Solvent
Weighing
•Wet Method •Drying
Modification
•Jet Milling •Collection
Table 3.2 Mass ratio between encapsulating materials and nano-additive
Description Mass Ratio
epoxy : (epoxy + nano-silica)
5:100
10:100
15:100
20:100
polyester : (polyester + nano-silica)
5:100
10:100
15:100
20:100
hybrid : (hybrid + nano-silica)
5:100
10:100
15:100
20:100
Modification -- Encapsulating material (epoxy, polyester or hybrid) was dissolved into
an organic solution (acetone) in a flask. After two hours of stirring (200rpm, room temperature) and one hour ultrasound bath till the solution became clear and transparent, the inorganic additive was put in slowly and then stirring was continued until all the solvent evaporated and the encapsulated additive lumps were obtained.
Milling -- The lumps obtained from the modification step must be ground to nano-size by
Figure 3.3 TEM image of 15 % PE encapsulated nano-additive (130k magnification)
3.1.2 Coating
Powder
Samples
T en
In te
F
The SEM im ncapsulated
Figure
n total 66 fin esting, as list
Figure 3.4
mages of a with 5% epo
e 3.5 SEM (a
ne polyureth ted in Table
•Add •Fine
Flow chart
prepared po oxy are indic
images of F ) 1k magnif
ane coating 3.3:
ditives e PU powder
Weighing for prepara owder samp cated shown FPP sample fication (b) powder (FP g •S
(a)
ation of pow
ple with 0.8 n in Figure 3
with 0.8% 9k magnific
P) samples w
Sieved twice Mixtu wder sample % loading .5. additive (5% cation were prepare ure es
ratio of add
%-Epoxy)
ed for flowab ditive
bility
Table 3.3 List of sixty-six FPP samples
R-E ratio LOA%
Control Samples 0 0.3%, 0.5%, 0.8%, 1.0%, 1.2%
Epoxy Samples
5% 10% 15% 20%
0.3%, 0.5%, 0.8%, 1.0%, 1.2% 0.3%, 0.5%, 0.8%, 1.0%, 1.2% 0.3%, 0.5%, 0.8%, 1.0%, 1.2% 0.3%, 0.5%, 0.8%, 1.0%, 1.2%
Polyester Samples
5% 10% 15% 20%
0.3%, 0.5%, 0.8%, 1.0%, 1.2% 0.3%, 0.5%, 0.8%, 1.0%, 1.2% 0.3%, 0.5%, 0.8%, 1.0%, 1.2% 0.3%, 0.5%, 0.8%, 1.0%, 1.2%
Hybrid Samples
5% 10% 15% 20%
0.3%, 0.5%, 0.8%, 1.0%, 1.2% 0.3%, 0.5%, 0.8%, 1.0%, 1.2% 0.3%, 0.5%, 0.8%, 1.0%, 1.2% 0.3%, 0.5%, 0.8%, 1.0%, 1.2%
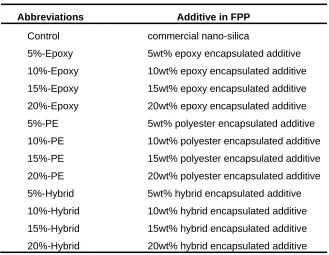
To clearly identify each sample, three “labeling” methods for the various powder samples were used in this study.
Table 3.4 FPP samples classification by R-E ratio
Abbreviations Additive in FPP
Control commercial nano-silica
5%-Epoxy 5wt% epoxy encapsulated additive
10%-Epoxy 10wt% epoxy encapsulated additive
15%-Epoxy 15wt% epoxy encapsulated additive
20%-Epoxy 20wt% epoxy encapsulated additive
5%-PE 5wt% polyester encapsulated additive
10%-PE 10wt% polyester encapsulated additive
15%-PE 15wt% polyester encapsulated additive
20%-PE 20wt% polyester encapsulated additive
5%-Hybrid 5wt% hybrid encapsulated additive
10%-Hybrid 10wt% hybrid encapsulated additive
15%-Hybrid 15wt% hybrid encapsulated additive
20%-Hybrid 20wt% hybrid encapsulated additive
on the flow properties of fine polyurethane coating powder (FPP) samples. They are summarized in Table 3.4.
Secondly, all the samples were named by additive loading ratio (LOA), when investigating the effect of R-E ratio on flow properties, as shown in Table 3.5.
Table 3.5 FPP samples classification by LOA
Abbreviations Additive in FPP
FPP-LOA0.3% 0.3wt% additive
FPP- LOA0.5% 0.5wt% additive
FPP- LOA0.8% 0.8wt% additive
FPP- LOA1.0% 1.0wt% additive
FPP- LOA1.2% 1.2wt% additive
Finally, the powder samples also were named by encapsulating material to study the effect of encapsulating material on flow properties, as shown in Table 3.6.
Table 3.6 FPP samples classification by encapsulating materials
Abbreviations Additive in FPP
FPP-Epoxy additive encapsulated by epoxy
FPP-PE additive encapsulated by polyester
FPP-Hybrid additive encapsulated by hybrid
3.2 Experimental
Methods
3.2.1 Particle
Size
Figure 3.6 (a) Laser particle size analyzer, BT-9300S (b) PSD of fine polyurethane powder
3.2.2 Jet
Mill
Grinding and classification of encapsulated additive lumps employed a jet-milling system, developed by the Particle Technology Research Centre (PTRC) of the University of Western Ontario (UWO). The system is shown in Figure 3.7. In this step, the feeding air pressure was set to 20 psi, the working air pressure was 20 psi, and the speed of feeding was 0.1 g/s.
(a)
Figure 3.7 Jet mill system, PTRC JM-2
3.2.3 Mixers
An ultrasonic sifter (VORTI-SIV Lab Models RBF-12, MM Industries, Inc., US) was used for mixing additive with the fine powder homogenously as shown in Figure 3.8. All the samples were sieved twice with a 45 micron (325 mesh) screen which is a standard accessory of this ultrasonic vibration sieve.
3.2.4 Scanning
Electron
Microscopy
The scanning electron microscopy (S-2600N Scanning Electron Microscope, Hitachi Ltd., JP) was used to obtain images of powder coating samples as shown in Figure 3.9. Each sample was prepared by spraying powder on a SEM metal stub with a carbon tap surface uniformly. Then, the samples were sputtered with gold layer (5nm to 10nm thick layer), to increase the conductivity of the powder surface. Images were obtained in secondary electron operating at 5 kV and work distance was around 5mm.
Figure 3.9 Scanning electron microscope, S-2600N
3.2.5 Angle
of
Repose
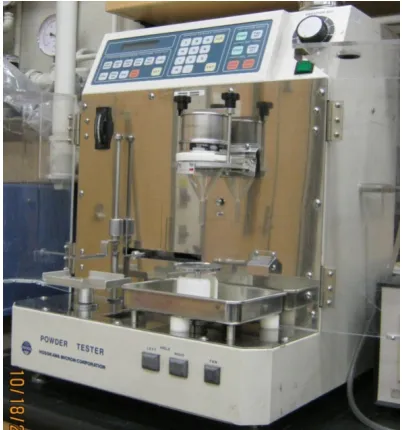
Angle of repose (AOR), representing the semi-static flowability of all samples, were measured by powder characteristic tester (PT-N Powder Characteristic Tester, Hosokawa Micron Powder Systems Co., Summit, NJ, USA), as shown in Figure 3.10. The standard test procedures (ASTM D6393-08) for bulk solids characterization was followed during the test.
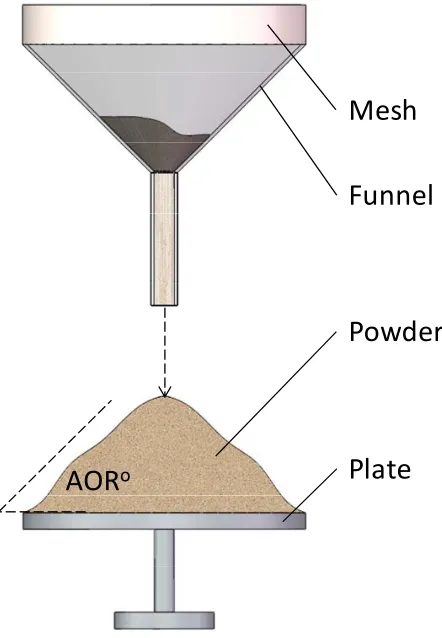
Figure 3.11 Schematic of AOR measurement
A schematic diagram of AOR test is shown in Figure 3.11. The testing powder was dispensed by a mesh and, through a funnel, the powder was delivered onto a circular plate forming a conical heap. The angle between the surface of the plate and the surface of the powder heap is the AOR when the powder heap covered the entire plate surface. Also, there was no additional accumulation of powder could be added onto the powder heal. This procedure was repeated 3~6 times for each powder sample and 3 data with difference smaller than 0.6 were selected. The average of the 3 data points were used as the AOR.
Funnel
Plate
Powder
AOR
o3.2.6 Avalanche
Angle
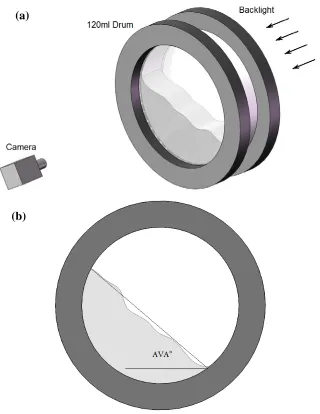
Avalanche angle (AVA), representing the semi-static flowability of all samples, were measured by a powder analyzer (Revolution Powder Analyzer, Mercury Scientific Inc., US) shown in Figure 3.12.
Figure 3.12 Revolution powder analyzer
Figure 3.13 Schematic of AVA measurement (a) AVA test system (b) Avalanche Angle
3.3 Film
Quality
Test
Before starting flow characteristic evaluation, film quality tests were conducted. The purposes of this study are to improve film quality of fine powder coated products, to reduce the cost of the fine powder coating and to enhance the effectiveness of the nano additives, by using modified additives. Therefore, film quality tests were an important part of the study.
(a)
3.3.1 Panel
Spray
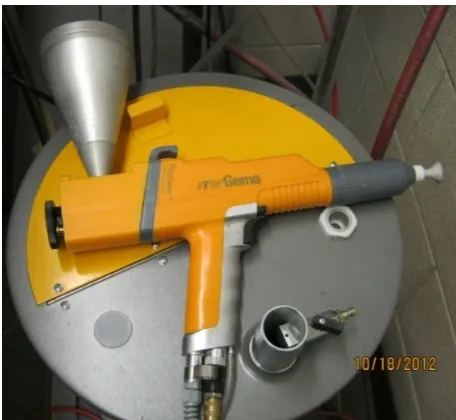
The panel spray was finished by a manual powder spray gun (EasySelect-Cup Manual Powder Gun, ITW Gema GmbH, Switzerland) as shown in Figure 3.14. The spray distance was 20cm and the work voltage was 25kv. Each of the powder samples (about 5 grams) was sprayed on a 5cm*9cm aluminum panel. The spayed panels were then cured for 10 minutes at 200˚C in an oven.
Figure 3.14 EasySelect-Cup manual powder gun
3.3.2
Gloss and Thickness
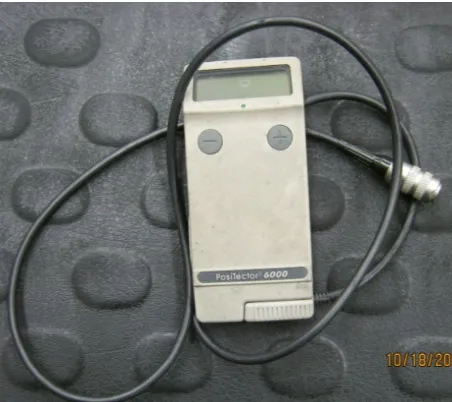
Figure 3.15 Coating thickness gauge, PosiTector® 6000
The gloss of coating film was measured by a gloss meter (NOVO-GLOSSTM gloss meter, GENEQ inc., CA) shown in Figure 3.16. In this step, each coating film was tested 3 times with 60° measuring range. Then the average value was used as film gloss of the coating film.
Figure 3.16 Gloss meter, NOVO-GLOSSTM
and epoxy. They are the curing agent for each other, which means the curing speed of "shell" is higher than the other part of the film, due to fully mixing during of them during wet encapsulation process in the solvent. Therefore, the cured hybrid is not compatible with the coating powders, which leads to the increasing number of seeds.
Table 3.7 Comparison of film quality for FPP-LOA0.8% sample
Film thickness
(Micron)
Film gloss
( ° )
Seeds
(pcs / unit)
Control Sample 18.4 85.0 9.7
10%-Epoxy 22.8 85.9 4.7
10%-PE 15.9 84.9 5.3
10%-Hybrid 15.0 85.9 16.0
Chapter 4
4
Semi-static Flow Characterization of Powders with
Modified Additives
4.1 Introduction
The flow characteristic of a powder coating is directly related to its performance in the industry. Semi-static flow property, as one of the most important aspects of flowability characteristic, is always conducted before coating powder. The angle of repose (AOR) is a commonly used indicator representing semi-static flowability of powder due to its easy and fast evaluation procedure with simple instrument.
In this study, the angle of repose of sixty-six fine polyurethane powder (FPP) samples were tested to evaluate the performances of commercial and encapsulated additives. Then the results are compared according to different parameters including loading ratio of additives, encapsulating materials and R-E ratio of encapsulating materials.
Figure 4.1 TEM images of 15% R-E ratio of polyester (130k magnification)
4.2 Effect of R-E Ratio on Flowability of FPP Samples
The resin-to-encapsulated additive (R-E) ratio of the additive is a major factor affecting the flowability of fine powder.
Figure 4.2 shows the effect of the R-E ratio on the AOR under the specific additive loading ratio (0.3%, 0.5%, 0.8%, 1.0% and 1.2% respectively). As shown in Figure 4.2a, all the sample groups have similar variation: AOR decreases with the increase of the R-E ratio of epoxy to a minimum value when the epoxy R-E ratio is around 5%~10% range. After that, with the increase of the R-E ratio of epoxy (10%~20%), AOR increased gradually. There exists an optimum AOR around 10% R-E ratio of epoxy. The similar trends can also be observed for different R-E ratio of polyester and hybrid as shown in Figure 4.2b and Figure 4.2c: AOR decreases with increasing R-E ratio of encapsulating material from 0% to 10% and then increases after this R-E ratio. The only difference between Figure 4.2a and the other two graphs is the decreasing rate of AOR with epoxy resin is slightly lower than that with the other two materials, when the R-E ratio is lower than 10%.
39
41
43
45
47
49
0% 5% 10% 15% 20%
AOR
(
°)
R‐E Ratio of Epoxy
FPP‐LOA0.3% FPP‐LOA0.5% FPP‐LOA0.8% FPP‐LOA1.0% FPP‐LOA1.2%
(a)
38
39
40
41
42
43
44
45
46
47
48
0% 5% 10% 15% 20%
AOR
(
°)
R‐E Ratio of Polyester
FPP‐LOA0.3% FPP‐LOA0.5% FPP‐LOA0.8% FPP‐LOA1.0% FPP‐LOA1.2%
Figure 4.2 Effects of R-E ratio on AOR (a) FPP-Epoxy (b) FPP-PE (c) FPP-Hybrid
The above findings indicate that the flowability of FPP samples can be controlled by changing the R-E ratio. However, the control window (AOR changing range) is narrower compared with that of changing the loading ratio of additives. For example, at fixed additive loading ratio but different R-E ratios (0.8% additive and 0%~20% epoxy), the AOR variation range is only 40.8~41.8 (Figure 4.2a); whereas, at fixed R-E ratio but different additive loading ratio (0%~1.2%), AOR changes from 40.8~44.8 (Figure 4.2a). So for fine coating powder, adjusting the additive loading ratio is a more effective way to find the optimum point of flowability.
Figure 4.2 shows that the type of encapsulating material also affects the AOR. Therefore, the study on the effect of the encapsulating material is necessary.
39
40
41
42
43
44
45
46
47
48
0% 5% 10% 15% 20%
AOR
(
°)
R‐E Ratio of Hybrid
FPP‐LOA0.3% FPP‐LOA0.5% FPP‐LOA0.8% FPP‐LOA1.0% FPP‐LOA1.2%
4.3 Effect of Additive Coating Materials on Flowability of
Coating Powder
Because of different molecular structure, molecular weight and surface tension etc., different resins show various physical characters and chemical properties, such as plasticity, frangibility, rigidity, hydrophobicity and hydrophilicity. Therefore, when resins are used as encapsulating materials for additive, their differences are investigated.
Figure 4.3 Effect of Encapsulating Materials on AOR (FPP-LOA0.8%)
4.4 Effect of Additive Loading Ratio on Flowability of FPP
Samples
In section 4.2, a rough idea that the loading ratio of additives has a significant effect on the semi-static flowability of FPP samples was obtained. So in this section, this phenomenon will be discussed in detail.
AOR variations as a function of the additive loading ratio are shown in Figure 4.4 for all three encapsulating materials and the control group which is with the pure nano-silica without modification. One can note that for all samples with the encapsulated additives, AOR have similar variations to the control group. Initially, AOR decreases dramatically with increasing additive loading ratio, for example, 0%~ 0.5%; then AOR only decreases slightly to an minimum value when additive loading ratio increases to a critical value (0.5%~ 0.8%); after that, AOR starts to increase with increasing additive loading ratio (0.8%~ 1.2%). It is also clear that for each sample, there is a minimum AOR existing
37 38 39 40 41 42 43
5% 10% 15% 20%
AOR
(°
)
R‐E Ratio (wt%)
FPP‐Epoxy
FPP‐PE
between 0.5% and 0.8% additive loading ratios, which correspond to the optimum additive loading ratio. Such an observation agrees with the previous studies on the commercial additives, which indicates that the modified additives are still as functional as the additives without modification, regardless of the type of encapsulating materials. More importantly, the modified additives could out-perform the control group with proper encapsulated material ratios. These experimental findings prove that the encapsulation of the nano-additives with the polymer materials is a feasible way to modify the inorganic additives.
38 40 42 44 46 48 50 52 54 56 58
0.0% 0.2% 0.4% 0.6% 0.8% 1.0% 1.2%
AOR
(
°)
LOA%
Control
5%‐Epoxy 10%‐Epoxy 15%‐Epoxy 20%‐Epoxy
Figure 4.4 Effects of LOA on AOR (a) FPP-Epoxy (b) FPP-PE (c) FPP-Hybrid
38 40 42 44 46 48 50 52 54 56 58
0.0% 0.2% 0.4% 0.6% 0.8% 1.0% 1.2%
AOR
(
°)
LOA%
Control
5%‐PE
10%‐PE
15%‐PE
20%‐PE
(b)
38 40 42 44 46 48 50 52 54 56 58
0.0% 0.2% 0.4% 0.6% 0.8% 1.0% 1.2%
AOR
(
°)
LOA%
Control
5%‐Hybrid
10%‐Hybrid
15%‐Hybrid
20%‐Hybrid
F hy se 5 v th ob
4
T ad d Figurigure 4.4 als ybrid) impro een in Figur
%-Epoxy an alues; where hose sample bserved for
4.5 Cha
The semi-sta dditive enc ifferent addire 4.5 SEM (b) 0.
so shows tha oves or wors re 4.4a, comp
nd 10%-Epo eas, at highe es are worse
PE and hybr
apter Sum
tic flowabili capsulating
itive proport
M images of .5% (c) 1.0%
at for a given sens the flow pared with t oxy samples er the R-E ra e than the c rid materials
mmary
ity of sixty-material pr tions.
f 10%-Epox % (d) 1.2%
n additive lo wability of th the control g
s have bette atios of the e control sam s as shown in
-six FPP sam roportions,
(a)
(c)
xy with diffe (10k magni
ading ratio, he fine powd group, at 0.8
er flowabilit epoxy (15% mples. Simila n Figure 4.4b
mples is inv different e
erent LOA ( ification)
the R-E rati der samples 8% additive l ty because
and 20%), t ar phenome b and Figure
vestigated ba ncapsulating
(a) 0.3%
o (epoxy, PE more or les loading ratio of smaller the flowabili
non can als e 4.4c.
For fixed additive loading ratios, the AOR decreases with an increase of R-E ratio to a minimum value. After that, with the increase of the R-E ratio, AOR increases gradually. There is an optimum AOR existing at around 10% R-E ratio.
By comparing all the three encapsulating materials, polyester showed the best performance on the modification of the additive for fine polyurethane powder (FPP) semi-static flowability control.
For each additive encapsulating material, additive loading ratio has significant effects on the semi-static flowability (AOR). Initially, AOR decreases dramatically with increasing additive loading ratio; then AOR only decreases slightly to a minimum value when additive loading ratio increases to a critical value; after that, AOR starts to increase with increasing additive loading ratio. It is also clear that for all samples, there is a minimum AOR existing between 0.5% and 0.8% additive loading ratios, which correspond to the optimum additive loading ratio. Such variations are related to the surface areas of fine powder particles and additive particles. At low additive loading ratio, the total additive surface area is much lower than the total powder particle surface area. At this stage, AOR decreases dramatically. With increasing the additive loading ratio, the additive surface area is also increasing, however, the fine powder particle surface decreases due to the additive coverage, so that the surface area of the additives is approaching the surface area of the host particles. At this stage, AOR decreases slightly. Keep increasing the additive loading ratio to one critical value, the additive surface area equals to the particle surface area, and then beyond it. The surface area of additive becomes the dominant factor. At this stage, AOR starts to increase.
Chapter 5
5
Dynamic Flow Characterization of Powders with
Modified Additives
5.1 Introduction
During powder coating applications, the powders are subject to dynamic processes, such as fluidization and pneumatic transportation. Therefore, only evaluating the semi-static flowability of the powders is not enough. It is necessary to test the dynamic flow behavior of powders. Avalanche angle (AVA) is a commonly used indicator representing the dynamic powder flowability.
In this section, the avalanche angles of sixty-six FPP samples are tested to investigate the performances of commercial and encapsulated additives. Then the results are compared according to the different parameters including encapsulating materials, R-E (resin-to-encapsulated additive) ratio and loading ratio of additives.
5.2 Effect of R-E Ratio on Flowability of FPP Samples
In this section, the effect of R-E ratio on the dynamic flowability of fine coating particles is evaluated.
52 53 54 55 56 57 58 59 60 61
0% 5% 10% 15% 20%
Avalanche
Angle
(°
)
R‐E Ratio of Epoxy
FPP‐LOA0.3% FPP‐LOA0.5% FPP‐LOA0.8% FPP‐LOA1.0% FPP‐LOA1.2%
(a)
52 53 54 55 56 57 58
0% 5% 10% 15% 20%
Avalanche
Angle
(°
)
R‐E Ratio of Polyester
FPP‐LOA0.3% FPP‐LOA0.5% FPP‐LOA0.8% FPP‐LOA1.0% FPP‐LOA1.2%
Figure 5.1 Effects of R-E ratio on AVA (a) FPP-Epoxy (b) FPP-PE (c) FPP-Hybrid
From the above stated findings, it is clear that the dynamic flowability of FPP samples can also be controlled by changing the R-E ratio. Similar to the results of semi-static flowability, the variation of AVA caused by a change of R-E ratio is narrower than that caused by change of additive loading ratio, i.e. in Figure 5.1c, at a fixed additive loading ratio of 0.8%, different R-E ratios of hybrid (0%~20%) makes AVA vary in a small range of 53.0~55.1; whereas at a fixed R-E ratio, different additive loading ratios (0.3%~1.2%) cause a larger variation of AVA, from 53.4 to 56.2 (Figure 5.1c). So that to control the additive loading ratio is a more effective way to control the fine powder flowability than control the R-E ratio.
5.3 Effect of Additive Coating Materials on Flowability of
Coating Powder
With different molecular structure, molecular weight and surface tension etc., different resins show various physical characteristics and chemical properties, such as plasticity,
52 53 54 55 56 57 58 59
0% 5% 10% 15% 20%
Avalanche
Angle
(°
)
R‐E Ratio of Hybrid
FPP‐LOA0.3% FPP‐LOA0.5% FPP‐LOA0.8% FPP‐LOA1.0% FPP‐LOA1.2%
frangibility, rigidity, hydrophobicity and hydrophilicity. Therefore, when resins are used as encapsulating materials for additive, their differences are investigated.
Figure 5.2 Effects of Encapsulating Materials on AVA (FPP-LOA0.8%)
In order to investigate the effects of different encapsulating materials on dynamic flowability of FPP samples, AVA results are compared under the optimum additive loading ratio (0.8 wt%) in this chapter. As shown in Figure 5.2, polyester as an additive modification material, shows the best performance on improving the dynamic flowability in each R-E ratio group (the lowest AVA among the samples), while the FPP-Epoxy shows the worst performance. Since the components of hybrid are epoxy and polyester, the effect of this material on flowability of FPP samples is in the middle, better than FPP-Epoxy samples but worse than FPP-PE group. Although the differences (0.1~0.2) are not obvious when the R-E ratio is 5%, such difference between three powder samples become larger with increase of R-E ratio.
51 52 53 54 55 56
5% 10% 15% 20%
Avalanche
Angle
(°)
R‐E Ratio FPP‐Eopxy
FPP‐PE
5.4 Effect of Additive Loading Ratio on Flowability of FPP
Samples
According to the results from Chapter 4, it is clear that the loading ratio of additive has significant effects on the semi-static flow characteristic of the fine coating powders. The dynamic flowability which is indicated by the avalanche angle (AVA) of fine powder samples are reported under the different loading ratios of additive in this section.
52 53 54 55 56 57 58 59 60 61
0.2% 0.4% 0.6% 0.8% 1.0% 1.2%
Avalanche
Angle
(°
)
LOA%
Control
5%‐Epoxy
10%‐Epoxy
15%‐Epoxy
20%‐Epoxy
(a)
52 53 54 55 56 57
0.2% 0.4% 0.6% 0.8% 1.0% 1.2%
Avalanche
Angle
(°
)
LOA%
Control
5%‐PE
10%‐PE
15%‐PE
20%‐PE
Figure 5.3 Effects of additive loading ratio on AVA (a) FPP-Epoxy (b) FPP-PE (c) FPP-Hybrid
Obviously, the theory of surface area relating to the flowability (both semi-static and dynamic) could also be employed in this study to support AVA variation with different additive loading ratios. At low additive loading ratios, the total additive surface area is much lower than the total surface area of coating particle, so that the dominant factor is the later one. At this stage, AVA decreases gradually as shown in Figure 5.3. With increasing the additive loading ratio, the additive surface area is also increasing, however, the fine powder particle surface area remains the same, so that the surface area of the additives is approaching the surface area of the fine particles. At this stage, AVA decreases slightly as shown in Figure 5.3. By increasing the additive loading ratio to a critical value, the additive surface area equals to the particle surface area, and then beyond. The additive surface area then becomes the dominant factor. At this stage, AVA starts to increase.
Figure 5.3 also shows that for a given additive loading ratio, the R-E ratio (epoxy, PE and hybrid) improves or worsens the flowability of the fine powder. As seen in Figure 5.3a,
51 52 53 54 55 56 57 58 59
0.2% 0.4% 0.6% 0.8% 1.0% 1.2%
Avalanche
Angle
(°
)
LOA%
Control
5%‐Hybrid
10%‐Hybrid
15%‐Hybrid
20%‐Hybrid
compared with the control group, at 0.8% and 1.0% additive loading ratio, the 5%- and 10%-Epoxy samples have better flowability because of smaller AVA values; whereas, by increasing the R-E ratio of the epoxy (15% and 20%), the flowability of those samples are worse than the control group. Similar phenomenon could also be observed for PE and hybrid materials as shown in Figure 5.3b and Figure 5.3c. Such effects are discussed quantitatively in the following section.
5.5 Chapter
Summary
The dynamic flowability of different FPP samples is investigated based on different R-E ratios, different additive encapsulating materials and additive proportions.
For fixed additive loading ratio, AVA decreases with an increase of R-E ratio to a minimum value. After that, with the increase of the R-E ratio, AVA increased gradually. There is an optimum AVA existing (around 5% to 10%).
By comparing all the three encapsulating materials, polyester shows the best performance on improving the flowability of pure polyurethane powder, followed by hybrid and epoxy.
For fixed additive encapsulated material, the additive loading ratio has significant effects on the dynamic flowability (AVA). For the pure polyurethane powder sample without any additive, its AVA cannot be tested. After that AVA decreases until additive loading ratio increases to a critical value. Then AVA starts to increase with increasing additive loading ratio. The optimum additive loading ratio corresponding to minimum AVA is between 0.8% and 1.0%.
Chapter 6
6
Comprehensive Characterization of Fine Powder
Samples
6.1 Introduction
In Chapter 4 and Chapter 5, both the semi-static flowability (AOR) and the dynamic flow behavior (AVA) of fine powders were discussed based on different flow additives. Powder coating processes involve powder storage, fluidization and pneumatic transport etc. Some of them are relatively semi-static while others are quite dynamic. For instance, powder bridging, agglomeration, deposition and accumulation during storage or within equipment are more determined by the static characteristic because the powder is often in a settled or compacted state with little to no kinetic energy. In contrast, the fluidization and pneumatic transport of the powders are better characterized by the dynamic characteristics as the particles are dispersed and in motion. To evaluate the flow behavior of fine powders, the ideal way is to test both the static and the dynamic parameters. However, it is not often feasible in industry. They prefer to use one parameter (AOR, a semi-static characteristic) to represent all others.
Some previous works (Krantz 2009) have suggested a monotonic correlation between AOR and AVA for fine powders, which are tested with the traditional unmodified additives. However, there was no attempt to investigate the effect of the encapsulated additives on such correlation. Based on our previous discussions in Chapter 4 and 5, the Resin-to-Encapsulated material (R-E) ratio and encapsulating materials affect the flowability of fine coating powder samples as well. Therefore, such effects should be considered when developing the correlation between AOR and AVA.
additives. Finally, the effects of the encapsulating materials on this correlation are studied.
6.2 Fine Powder Flow Property Comprehensive Evaluation
6.2.1 Semi-static
Flowability
0.00 0.02 0.04 0.06 0.08 0.10 0.12 0.14 0.16 0.18 0.20 0.000 0.002 0.004 0.006 0.008 0.010 0.012 38 40 42 44 46 48 50 52 54 56 AO R ( o )
R-E Ra tio LOA 39.90 42.50 45.10 47.70 50.30 52.90 55.50 56.25 FPP-Epoxy 0.00 0.02 0.04 0.06 0.08 0.10 0.12 0.14 0.16 0.18 0.20 0.000 0.002 0.004 0.006 0.008 0.010 0.012 38 40 42 44 46 48 50 52 54 56 A O R ( o )
Figure 6.1 Effects of LOA & R-E Ratio on AOR (a)FPP-Epoxy (b) FPP-PE (c) FPP-Hybrid
6.2.2 Dynamic
Flowability
The combined effects of the resin-to-encapsulated additive (R-E) ratio and the loading ratio of additive (LOA) on AVA are also discussed by plotting AVA against the R-E ratio and LOA in a 3D manner based on different encapsulating materials. Similar results are observed as well compared with the discussions described in the previous section. Especially, although the optimum AVA values are slightly different for different encapsulating materials, the optimum AVA values are all around 10% R-E ratio and 0.8% LOA as well compared with the observations based on AOR, indicating that the relation between the AVA and AOR is supposed to be independent of the R-E ratio, encapsulating materials and LOA.
In order to prove the above mentioned claim, the relation between AOR and AVA are discussed based on those three parameters in the following section.
0.00 0.02 0.04 0.06 0.08 0.10 0.12 0.14 0.16 0.18 0.20 0.00 0 0.002 0.00 4 0.006 0.008 0.010 0.012 38 40 42 44 46 48 50 52 54 56 A O R ( o )
0.00 0.02 0.04 0.06 0.08 0.10 0.12 0.14 0.16 0.18 0.20 0.004 0.006 0.008 0.010 0.012 52 53 54 55 56 57 58 59 60 AVA ( o )
Figure 6.2 Effects of LOA & R-E Ratio on AVA (a)FPP-Epoxy (b) FPP-PE (c) FPP-Hybrid
6.3 Correlation between Semi-static and Dynamic
Flowability
6.3.1
Different LOA and R-E Ratio
The avalanche angle (AVA) vs. its corresponding angle of repose (AOR) is shown in Figure 6.3 under different additive loading ratios (0.3%, 0.5%, 0.8%, 1.0% and 1.2%), different encapsulating materials and various R-E (resin-to-encapsulated additive) ratios.
0.00 0.02 0.04 0.06 0.08 0.10 0.12 0.14 0.16 0.18 0.20 0.00 4 0.00 6 0.00 8 0.01 0 0.01 2 53 54 55 56 57 AVA ( o )
R-E R