Environmental regulation, upgrading of industrial structure and
economic fluctuation
Dan Zhang
,*, Leyi Chen
Dan Zhang
School of Economics and Trade, Hunan University, Changsha 410079, China;
Leyi Chen
[email protected],0086‐13873108965
*Correspondence: [email protected]; Tel.:0086‐18674396224
orcid.org/0000‐0003‐3830‐9399
Environmental regulation, upgrading of industrial structure and
economic fluctuation
-an empirical study of dynamic panel threshold based on 35 industries
Abstract: This paper utilizes dynamic panel threshold technology to conduct a nonlinear test on
the direct effect between environmental regulation and economic fluctuations and the effect of industrial structure upgrading by taking 35 industrial sectors in China from 2003 to 2016 . The research has found that there is an inverted "U" relationship between environmental regulation and economic fluctuations, with the enhancement of environmental regulations, the economic fluctuation increases first and then decreases. The cross-terms of environmental regulation and industrial structure rationalization or industrial structure upgrading are significantly negative, which indicates that the enhancement of environmental regulation is conducive to promoting industrial structure upgrading and reducing the economic fluctuations. While the rationalization factors of industrial structure and advanced industrial structure are significantly negative, indicating that both forms of industrial structure upgrading are conducive to reducing the economic fluctuations. Environmental regulation has technical innovation thresholds for industrial structure upgrading and economic fluctuations, but there are no human capital or FDI thresholds. In the rationalization model of industrial structure, there is a nonlinear "U" relationship between environmental regulation and economic fluctuations when the proportion of scientific research expenditure is more than 1.35%. With the enhancement of environmental regulation, the economic fluctuation reduces first and then increases, and the corresponding inflection point value is 2.398% of the environmental regulation level. At the same time, the environmental regulation can indirectly reduce economic fluctuations by pushing down the industrial structure upgrades. In the advanced model of industrial structure, there is a “U” relationship between environmental regulation and economic fluctuation when the proportion of scientific research expenditure is greater than 1.26%. With continuous enhancement of environmental regulation, the economic fluctuation reduces first and then increases. The corresponding inflection point value is 1.78% of the environmental regulation level, and environmental regulation can indirectly reduce economic fluctuations by promoting the industrial structure at the same time.
Keywords: Environmental regulation, Industrial structure upgrade, Economic fluctuation,
Dynamic panel threshold
1. Introduction
Long-term economic growth and short-term economic fluctuation are the two main themes of
macroeconomics. The economy is increasing around the long-term trend, but the short-term
changes in the world industrial structure. The high-end modern service industry has become the
driving force of economic development, and its industrial structure has been continuously
upgraded, which has contributed greatly to the steady economic development. However, after the
financial crisis in 2008, economic stability encountered challenges, increasing the risk of
economic fluctuations. Therefore, how to upgrade the industrial structure with stable economic
fluctuation and how to reduce economic fluctuation through industrial structure upgrading are
important problems that every country encounters.
From the perspective of our country, the current economic society has stepped into the "new
normal" of speedy shifts and structural adjustment pains. The report of the 19th National Congress
of the CPC noted that construction of an ecological civilization is a millennium plan for the
sustainable development of the Chinese nation, and it is necessary to resolutely strike a major
offensive war on pollution prevention and control; this reflects the importance attached by the
Party and the state to environmental protection. On the one hand, the environmental regulation
policy increases an enterprise’s cost and profit to a certain extent, impels the enterprise to adjust
its production behaviour, and causes an industrial structure adjustment. On the other hand, the
upgrading of the industrial structure, as the core tool to coordinate the economy and the
environment, affects environmental quality and economic fluctuation by influencing the
proportion of high energy consumption, high-pollution industries and investment in clean
equipment, green technology research and development. Therefore, it is necessary to use
environmental regulation as the intrinsic incentive of industrial structure upgrading and to analyse
the mechanism of environmental regulation to reduce economic fluctuation by forcing the
industrial structure to upgrade; this is an important theoretical and practical research topic.
Research on the relationship between environmental regulation and industrial structure
upgrading mainly focuses on two aspects. One aspect is the influence mechanism. Environmental
regulation mainly influences the upgrading of the industrial structure by three means: demand,
technological innovation and international trade transmission mechanism. The overall
environmental regulation intensity of our country has a positive impact on the direction and path
of industrial upgrading (Xiao Xingzhi, Li Shaolin; 2013). Li Qiang et al. (2013) [2] show that the
existence of environmental regulation will increase the proportion of the service sector relative to
the industrial sector and thus promote the adjustment of the industrial structure. The second aspect
is empirical research. Li Xiaoying (2018) [3] uses the spatial econometric model to test the impact
regulation has a forced effect on industrial structure adjustment. However, this literature basically
assumes that there is a linear relationship between environmental regulation and industrial
structure upgrading. In fact, there is a threshold effect on the impact of environmental regulation
on industrial structure upgrading. Zhong Maochu et al. (2015) [4] show that there is a U-type
relationship between environmental regulation and industrial structure upgrading. Only when the
threshold of environmental regulation is crossed can the adjustment of industrial structure be
promoted.
Currently, there are great differences in the influence of different changes in the industrial
structure on economic fluctuation. Dry Chunhui et al. (2011) [5] hold that the effects of
rationalization and upgrading of the industrial structure on economic fluctuations are mainly
manifested in unpredictable cyclical fluctuations; however, their influence mechanisms are quite
different. Upgrading of the industrial structure is an important source of economic fluctuation, and
the rationalization of the industrial structure is helpful to restrain economic fluctuation. Li Qiang
(2012) [6] studies the relationship between industrial structure change and economic fluctuation
through an econometric model. It is found that the change in the industrial structure is an
important reason for economic fluctuation. Rationalization and upgrading of the industrial
structure are helpful to alleviate economic fluctuation; however, the higher industrial structure has
more influence on economic fluctuation than the rationalization of the industrial structure. Peng
Chong et al. (2013) [7] use the panel vector autoregressive model to investigate the effect of an
industrial structure change on economic fluctuation and determined that the rationalization of the
industrial structure has an "ironing effect" on economic fluctuation; however, the impact of a
high-level impact is strongly pro-cyclical. Both short and long term have obvious positive effects.
In summary, there is no literature on the relationship between environmental regulation,
industrial structure and economic fluctuation, particularly on the direct effect of environmental
regulation on economic fluctuation and the effect of industrial structure change. At the same time,
the related research literature mainly utilizes provincial panel data to test the lack of industry-level
environmental regulation, industrial structure upgrading and economic fluctuations; in addition,
the industrial industry is the main body of our economy. This industry has an important effect on
the economic fluctuation; therefore, it is necessary to examine and analyse the industrial industry.
In addition, the most important item is the threshold effect of environmental regulation on
industrial structure upgrading and economic fluctuation (Zhong Maochu et al., 2015 [4]). The
variables and cannot address the endogenous problem of environmental regulation; therefore,
there is much room for improvement.
Targeting the deficiency of the existing research, this paper mainly uses 35 industrial
industries in China from 2003-2016 as the research object and uses dynamic panel threshold
technology to directly test the direct effect between environmental regulation and economic
fluctuation and the upgrading effect of the industrial structure. This paper provides the theoretical
basis for establishing reasonable environmental regulation intensity to force the industrial
structure to upgrade to reduce economic fluctuation and finally realizes the win-win situation
between environmental protection and economic development. The contributions of this paper are
as follows: First, environmental regulation, industrial structure upgrading and economic
fluctuation are incorporated into the unified research framework, and the direct effect of
environmental regulation on economic fluctuation and the upgrading effect of industrial structure
are discussed. The second contribution is to extend the test to the industrial level. The third is to
consider the dynamic nature of economic fluctuations, the continuity and the threshold effect, the
use of dynamic panel threshold technology to estimate, and solving the endogenous problem of
environmental regulation. The estimation conclusion is more robust.
2. Research and design
2.1 Measurement model setting
This paper mainly analyses the impact of environmental regulation on economic fluctuation
through the upgrading of the industrial structure. Considering the dynamic and continuous nature
of economic fluctuation and the endogenous nature of environmental regulation, the dynamic
panel model is set as the basic model.
0 1 1 2 3 4
it it it it it it it i t it
VOL
VOL
ER
ER
IS
IS
X
(1)Among the variables,
i
andt
represent the industry and the time, respectively;
i is theindividual effect.
t is the time effect, and
it is the random disturbance term.VOL
it is thevariable for economic fluctuation; it joins the lag period
VOL
it1 to reflect the economicfluctuation dynamics, and the continuity,
ER
it is environmental regulation and measures thethe rationalization of the industrial structure (
ISR
it) and the upgrading of the industrial structure(
ISS
it). This paper also adds the cross item between the industrial structure and environmentalregulation (
ER
it
IS
it) to measure the indirect effect of environmental regulation on economicfluctuation through upgrading of the industrial structure.
X
it is a control variable. Technologicalinnovation (
TI
it), human capital (HU
it), foreign direct investment (FDI
it), industry controlvariables (
IV
it) and total factor productivity (LP
it) are selected to control the influence of relatedfactors on economic fluctuation.
At the same time, considering that environmental regulation has a threshold effect on the
industrial structure upgrading, and that there is a direct relationship between environmental
regulation and economic fluctuation, this paper introduces threshold estimation based on the basic
model and constructs a dynamic panel threshold estimation model to test it.
0 1 1
(
)
2(
)
3it it it it it i t it
VOL
VOL
ER
I thr
ER
I thr
X
(2)where
I
is the threshold function,thr
is the threshold variables set, and
is for thecorresponding threshold. This paper mainly establishes three threshold variables: technological
innovation (
TI
it), human capital (HU
it) and foreign direct investment (FDI
it). These variablesare also the three intermediate variables (Xiao Xingzhi, Li Shaolin) that environmental regulation
acts on in the upgrading of the industrial structure (2013); other variables are set as above.
2.2 Variable selection and data sources
In this paper, 35 industrial industries are the research object, and the time span is 2003-2016.
The industry selection criteria are as follows. There are 39 double-digit industrial industries in the
Yearbook of Industrial Economic Statistics of China, but considering that there are very few
statistics on "other mining industries", the new "other mining industry" will be merged with the
"non-metal ore mining and separation industry". Some data are missing from "handicraft and other
manufacturing industries", "waste resources and waste materials recovery and processing
industry" and "timber and bamboo harvesting and transportation industry". "Rubber products
industry" and "plastic products industry" are merged into "rubber and plastic products industry" in
products industry" and "plastic products industry" in previous years. The data are mainly from
China Industry Statistics Yearbook, China Science and Technology Statistics Yearbook and China
Environment Statistics Yearbook. The relevant variables are selected as follows:
1.Economic fluctuations. To measure macroeconomic fluctuation, there are mainly HP, BK
and CF filters. However, in recent years, there have been many controversies in the HP filtering
method. In this paper, the industrial added value of 35 industries in 2003-2016 is selected as the
measurement index, and the CF filtering method is used to measure.
2.Environmental regulation. The environmental regulation measurement indexes mainly
include the number of environmental laws and regulations and the sewage charge revenue;
however, there is a lack of relevant data at the industry level. The proportion of operation cost in
the total industrial output value of waste water and waste gas treatment in various industries is
used as the proportion. The larger the proportion is, the greater the environmental regulation
intensity is.
3.Upgrading of the industrial structure. According to relevant literature, industrial structure
upgrading mainly includes rationalization and upgrading of the industrial structure, expressed by
the structural deviation index (or Thiel index) and the ratio of tertiary industry output value to
secondary industry output value (dry Chunhui et al., 2011 [5]). However, these indicators are
difficult to apply to the industry level. This paper mainly refers to the practice of Zhang Bingbing
and Zhu Jing (2015) [8] and uses the proportion of output value of each industrial industry in the
gross output value of industrial industry as the substitute index for the rationalization of the
industrial structure. At the same time, referring to the method of Fu Yuanhai et al. (2014) [9], we
use the proportion of high-knowledge-complexity industries to the total industrial output value to
measure the advanced industrial structure. Among these industries, high-knowledge and
high-complexity industries include chemical raw materials and chemical products manufacturing,
chemical fibre manufacturing, pharmaceutical manufacturing, general equipment manufacturing,
special equipment manufacturing, transportation equipment manufacturing, electrical machinery
and equipment manufacturing, communications equipment, computer and other electronic
equipment manufacturing, instrumentation and culture, and office machinery manufacturing. After
obtaining the annual data of the proportion of the industrial structure of the whole industry, the
proportion of the added value of each industry in each industry is calculated. Then, the proportion
of the industrial structure for each year is multiplied by the ratio of the industrial added value of
advanced variables of the index data.
4.Threshold variable. Technological innovation is expressed in terms of the proportion of
internal expenditure of scientific and technological activities in each industry to the total industrial
output value, and human capital is expressed in terms of the proportion of the number of scientific
and technological activities in each industry to the total number of employees. With reference to
Zhao Wenjun and Yu Jin-ping (2012) [10], foreign direct investment is expressed as the proportion
of the total assets of industrial enterprises obtaining foreign investment and Hong Kong, Macao
and Taiwan investment in the total assets of industrial industries above the scale.
5.Industry control variable. The industrial value-added rate is expressed by the ratio of the
industrial added value to the industrial gross output value in the same period, and labour
productivity is expressed by the ratio of industrial added value to the total number of employees.
2.3 Dynamic panel threshold estimation method
There is a fixed individual effect in the dynamic panel threshold model set in this paper, so
it is necessary to eliminate the individual effect before estimating. Usually, there are two methods
of intra-group transformation (within transformation) and first-order difference to deal with.
However, in the dynamic panel threshold model, the delay of the explained variable is related to
the mean value of the individual error term, so the estimation results of the intra-group
transformation are no longer consistent. The first-order difference results in negative correlation of
error terms, which cannot be directly applied to the threshold model proposed by Hasen. In this
paper, referring to the method of Kremer et al. (2013) [11], the forward orthogonal deviation
transform (the forward orthogonal deviations transformation) is used to eliminate the fixed effect
in the dynamic panel model, targeting the deficiency of the intra-group transformation and the
first-order difference method to eliminate the fixed effect in the dynamic panel model. This
method is mainly used to subtract the average value of all the observed values from the observed
value, and the error term after transformation no longer has the problem of sequence correlation.
The forward orthogonal deviation transformation of model (2) is conducted, in which the forward
orthogonal deviation transformation model of the error term is as follows:
*
1
1
[
(
)],
1, ,
1
1
it it it iT
T t
t
T
T t
T t
L
L
error term. Considering the strong endogeneity of model (2), this paper estimates the threshold of
the dynamic panel with Caner and Hansen (2004) [12] in three steps.
3. Empirical analysis
3.1 Panel unit root and cointegration test
The premise of econometric estimation is that the variables are stable. This paper mainly uses
the panel unit root test to test the stability of variables; this is mainly divided into the
homogeneous unit root test (LLC test) and the heterogeneous unit root test (IPS test and
Fisher-ADF test). Considering the comprehensiveness of the test, the homogeneous LLC test, the
heterogeneous IPS test and the Fisher-ADF test are used as the main methods of the panel unit
root test. At the same time, for stationary variables, the Kao cointegration test is also used to
determine whether there is a long-term equilibrium relationship between variables. The original
assumption is that there is no cointegration relationship. The test results shown in Table 2 show
that the original sequences of the related variables are stable and can be tested by cointegration,
while the Kao test rejects the original hypothesis that there is no cointegration relationship, with a
level of 1% significance. It is shown that there is a long-term equilibrium relationship between
variables, and the results of spatial measurement estimation are reliable.
Table1. Panel unit root and cointegration test results
variable LLC IPS Fisher-ADF
VOL -16.922*** -5.562*** 173.274***
ER -9.274*** -5.229*** 151.236***
ISR -9.934*** -2.625*** 109.890***
ISS -17.273*** -5.390*** 148.232***
TI -9.339*** -2.519*** 94.970***
HU -10.889*** -3.528*** 112.469***
FDI -13.553*** -2.112** 113.428***
IV -10.233*** -2.988** 102.007***
LP -12.880*** -7.825*** 185.370***
Note:
∗The values in parentheses are the standard error statistics, presenting their significance at a level of 10%.
∗∗ The values in parentheses are the standard error statistics, presenting their significance at a level of 5%.
∗∗∗ The value in parentheses are the standard error statistics, presenting their significance at a level of 1%.
3.2 Direct effect Test
According to the established basic model, this paper first uses the dynamic panel estimation
method to test the direct effect of environmental regulation on economic fluctuation and the
upgrading effect of industrial structure. Considering the strong endogeneity of environmental
regulation, the first order lag of environmental regulation is used as the tool variable to solve the
endogeneity problem, and the robust estimation result is obtained using the system GMM two-step
robust standard error estimation.
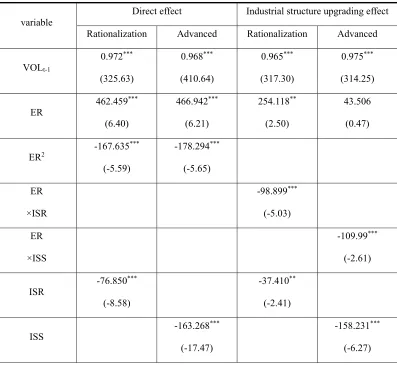
Table 2. Dynamic panel GMM estimation results
variable
Direct effect Industrial structure upgrading effect
Rationalization Advanced Rationalization Advanced
VOLt-1
0.972***
(325.63)
0.968***
(410.64)
0.965***
(317.30)
0.975***
(314.25)
ER
462.459***
(6.40)
466.942***
(6.21)
254.118**
(2.50)
43.506
(0.47)
ER2 -167.635
***
(-5.59)
-178.294***
(-5.65)
ER
×ISR
-98.899***
(-5.03)
ER
×ISS
-109.99***
(-2.61)
ISR -76.850
***
(-8.58)
-37.410**
(-2.41)
ISS
-163.268***
(-17.47)
-158.231***
TI -41.620*** (-4.31) -10.684*** (-3.32) -14.449** (-1.98) -17.843* (-1.73)
HU -43.713
*** (-10.79) -44.906*** (-16.31) -39.243*** (-18.27) -40.560*** (-9.23) FDI -12.418*** (-21.20) -13.042*** (-19.41) -13.008*** (-17.51) -14.274*** (-21.83) IV -22.129*** (-55.45) -18.855*** (-38.79) -23.230*** (-29.82) -21.530*** (-46.02)
LP -8.012
*** (-29.92) -8.195*** (-34.02) -7.614*** (-23.84) -7.749*** (-28.57)
Shape Inverted
u-shaped
Inverted
u-shaped / /
Point of
inflection 1.379 1.309 / /
Regional effect yes yes yes yes
Time effect yes yes yes yes
Sargan Test 31.347 [1.000] 31.041 [1.000] 29.858 [1.000] 29.996 [1.000] AR(1) -2.131 [0.033] -2.104 [0.035] -2.072 [0.038] -2.024 [0.043]
AR(2) 0.596
[0.551] 0.687 [0.492] 0.499 [0.618] 0.535 [0.592] Note: ∗The values in parentheses are standard error statistics, presenting their significance at a level of 10%. ∗∗ The values in parentheses are standard error statistics, presenting their significance at a level of 5%. ∗∗∗ The values in parentheses are standard error statistics, presenting their significance at a level of 1%.
The estimation results show that the Sargan test results all accept the original hypothesis that
the tool variables are valid, which indicates that the tool variables are set reasonably, and the AR
(2) test results show that there is no second-order sequence correlation. The lag first-order
coefficient of economic fluctuation is above 0.95, which indicates that the dynamic panel model is
fluctuation, the coefficient of environmental regulation, ER, is significantly positive, and the
square term is significantly negative in both the industrial structure rationalization and the
industrial structure advanced model. The result shows that there is an inverted "U"-type
relationship between environmental regulation and economic fluctuation. With the enhancement
of environmental regulation, economic fluctuation first increases and then decreases. When the
environmental regulation is lower than the specific threshold, the increase of the non-productive
environmental cost in the short term will urge enterprises to reduce their investment, but the main
body of the investment decline consists of enterprises with poor pollution control equipment and
serious pollution. When the environmental regulation is further raised beyond the threshold,
polluting enterprises will be gradually "cleaned", and the green innovation ability of the industry
will be continuously improved. Once the innovation investment income exceeds the cost, the
whole industry will choose to increase the innovation investment, thus improving the overall level
of investment. Therefore, there is a direct "U" relationship between environmental regulation and
investment. At the same time, the impact on economic growth is also obvious; when investment
decreases, economic volatility increases. When investment increases, particularly when the level
of innovation investment increases, it will promote steady economic growth and reduce economic
volatility. Therefore, the relationship between environmental regulation and economic fluctuation
also shows a direct "U"-type relationship.
From the perspective of the upgrading effect of environmental regulation on the industrial
structure of economic fluctuation, although the coefficient of environmental regulation ER is
significantly positive (in the industrial structure rationalization model) or not (in the industrial
structure advanced model). However, the cross term ER × ISR,ER × ISS with the rationalization
of industrial structure or the upgrading of industrial structure is significantly negative, which
indicates that the enhancement of environmental regulation is conducive to promoting the
upgrading of industrial structure and reducing economic fluctuations. When the environmental
regulation is strengthened, the cost of the pollution industry rises. Subsequently, some seriously
polluted enterprises incrementally withdraw from the market. The resources flow to the clean
industry, which is conducive to the optimization and upgrading of the industrial structure, to
promote the steady growth of the economy and to reduce the economic fluctuation in the long run.
The coefficients of industrial structure rationalization ISR and industrial structure advanced ISS
are both significantly negative, which indicates that the two forms of industrial structure
structure is conducive to promoting the long-term and healthy development of economy and will
increase the stability of the economy, which is in line with the economic reality. In terms of
controlling variables, both technological innovation and human capital are conducive to reducing
economic fluctuations. Both technological innovation and human capital are important supporting
factors for long-term economic growth and have "ironing effect" on economic fluctuations. The
advanced technology management experience brought by FDI and the technology spillover effect
can promote the technological progress of the host country, and then promote the economic
growth and reduce the economic fluctuation. In addition, the industrial value added rate (IV) and
labour productivity LP (LP) show that the improvement of economic efficiency and development
quality can promote the reduction of economic fluctuation.
3.3 Threshold effect test
1. Threshold estimation and significance test.
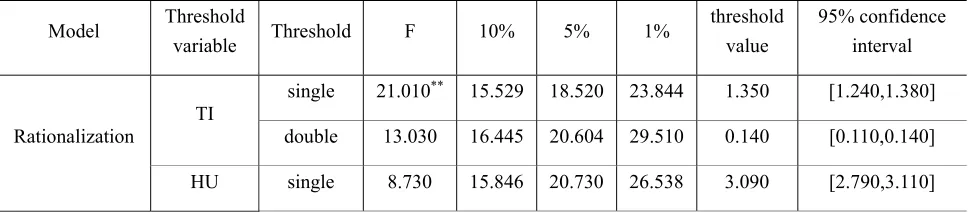
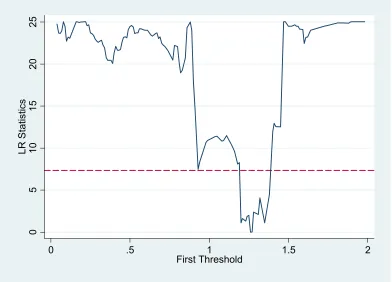
According to the results of the threshold estimation and the significance test, if TI is used as the threshold variable, there is only one threshold value in both the industrial structure rationalization model and the industrial structure advanced model. In the industrial structure rationalization model, the threshold is the technological innovation level of 1.35, while in the industrial structure advanced model, the threshold is the technological innovation level of 1.26. By calculating the average value of the technological innovation water for 35 industrial industries between 2003 and 2015, it was found that the industries that crossed the 1.35% threshold were mainly medicine (1.76%), manufacturing of specialized equipment (1.64%), manufacturing of transportation equipment (1.60%), manufacturing of communications equipment, computers and other electronic equipment (1.59%), manufacturing of instruments and cultural office machinery (1.55%), and electrical machinery and equipment manufacturing industry (1.46%), a total of 6 industries. The other 29 industries did not cross the threshold level of technological innovation. In addition to the six sectors above the 1.26 percent threshold, there is the general equipment manufacturing industry (1.26 percent) for a total of seven industries. In addition, according to figs. 1 and 2, a single threshold exists, which indicates that environmental regulation has a technological innovation threshold for industrial structure upgrading and economic fluctuation.
Table 3. Threshold estimation and significance test results
Model Threshold
variable Threshold F 10% 5% 1%
threshold value
95% confidence interval
Rationalization
TI
single 21.010** 15.529 18.520 23.844 1.350 [1.240,1.380]
double 13.030 16.445 20.604 29.510 0.140 [0.110,0.140]
FDI single 29.460 32.083 36.953 46.877 58.630 [57.520,59.090]
Advanced
TI
single 23.080** 16.152 19.303 34.260 1.260 [1.205,1.270]
double 13.300 18.036 22.247 28.780 0.140 [0.110,0.140]
HU single 12.370 16.595 18.420 27.905 4.480 [4.330,4.490]
FDI single 26.140 36.958 43.190 60.853 58.630 [26.220,59.090]
Note:
∗∗ The values in parentheses are standard error statistics, presenting their significance at a level of 5%.
Figure 1. Threshold and confidence interval of technological Innovation as threshold
variable(Industrial structure rationalization model)
0
5
10
15
20
25
LR Statistics
0 .5 1 1.5 2
First Threshold
0
10
20
30
LR Statistics
0 .5 1 1.5 2
Figure 2. Threshold and confidence interval of technological Innovation as threshold
variable(Advanced industrial structure model)
2. Dynamic panel threshold estimation results.
In this paper, upgrading of the industrial structure is divided into rationalization and
upgrading, and the corresponding threshold TI is 1.35% (rationalization) and 1.26% (advanced).
This paper uses the lag of environmental regulation more than one order as the tool variable to
solve the endogenous problem and uses the dynamic panel GMM two-step robust standard to test
the threshold effect of environmental regulation and industrial structure upgrading on economic
fluctuation. In the estimates shown in tables 5 and 6, the Sargan test results show that the tool
variables are set reasonably, and the AR (2) test shows that there is no second order sequence
correlation. In addition, the lag first order coefficient of economic fluctuations is above 0.90 and
significant; this shows that the economic fluctuation is dynamic.
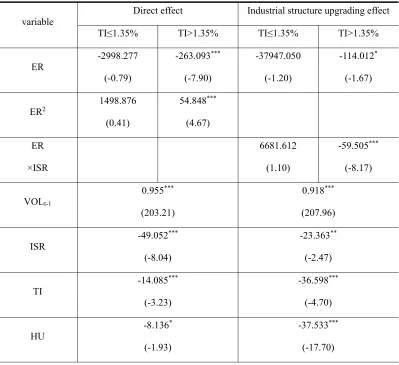
From the estimation model of environmental regulation, industrial structure rationalization
and economic fluctuation, the coefficients of the main variables are different when TI ≤ 1.35% and
TI > 1.35%. One is the direct effect. When TI ≤ 1.35, the coefficient of ER of environmental
regulation is not significant, and the coefficient of the quadratic term is not significant, which
indicates that the promoting effect of environmental regulation on reducing economic fluctuation
is not obvious. However, when TI > 1.35, the coefficient of ER of environmental regulation is
significantly negative, and the coefficient of the quadratic term is significantly positive, which
indicates that there is a direct "U" type relationship between environmental regulation and
economic fluctuation. With the enhancement of environmental regulation, the economic
fluctuation decreases first and then increases. The corresponding inflection point is the level of
environmental regulation, 2.398. However, by calculating the environmental regulation level of
each industry from 2003 to 2015, it is found that the industry has not crossed this threshold.
Therefore, when TI > 1.35%, environmental regulation is strengthened, and the economic
fluctuation can be reduced. This finding is also consistent with the previous analysis. When the
level of technological innovation is high, the enhancement of environmental regulation is
conducive to stimulate industry innovation investments, improve the overall investment level,
maintain the steady development of the economy, and reduce economic fluctuations. Second, with
the upgrading effect of the industrial structure, when TI ≤ 1.35, the first and cross terms of
regulation has not forced the upgrading of the industrial structure, thus reducing economic
fluctuations. However, when TI > 1.35, environmental regulation can promote the reduction in
economic fluctuation; at the same time, it can indirectly reduce economic fluctuations by forcing
the upgrading of the industrial structure. This finding is confirmed by the negative coefficients of
the first term and cross term of ER. Similarly, when the level of environmental regulation and the
level of technological innovation exceed a certain threshold, the rising cost of environmental
standards leads to the transfer of labour and capital to clean industries, which is conducive to
optimizing the industrial structure, promoting economic development, and reducing economic
volatility. Furthermore, the coefficient of rationalization of industrial structure is significantly
negative in both models, which indicates that rationalization of the industrial structure is beneficial
to reducing economic fluctuations, which is consistent with the previous analysis. The coefficient
and significance of other variables are consistent with the previous analysis and are not discussed
here.
Table 4. Dynamic panel threshold estimation results(Rationalization of industrial structure)
variable
Direct effect Industrial structure upgrading effect
TI≤1.35% TI>1.35% TI≤1.35% TI>1.35%
ER
-2998.277
(-0.79)
-263.093***
(-7.90)
-37947.050
(-1.20)
-114.012*
(-1.67)
ER2 1498.876
(0.41)
54.848***
(4.67)
ER
×ISR
6681.612
(1.10)
-59.505***
(-8.17)
VOLt-1
0.955***
(203.21)
0.918***
(207.96)
ISR -49.052
***
(-8.04)
-23.363**
(-2.47)
TI
-14.085***
(-3.23)
-36.598***
(-4.70)
HU
-8.136*
(-1.93)
-37.533***
FDI
-12.223***
(-31.02)
-11.373***
(-33.95)
IV -18.376
***
(-20.58)
-187.498***
(-27.20)
LP
-5.423***
(-14.25)
-3.468***
(-14.12)
Shape / U-shaped / /
Point of
inflection / 2.398 / /
Regional effect yes yes
Time effect yes yes
Sargan
3.844
[1.000]
2.885
[1.000]
AR(1) 0.488
[0.625]
-0.508
[0.612]
AR(2)
-0.810
[0.418]
1.169
[0.242]
Note:
*, ** and *** mean 1 / 5% and 10% significant level reject the original hypothesis. In parentheses are Z values of statistics and P values of statistics in square brackets.
From the estimation model of environmental regulation, advanced industrial structure and
economic fluctuation, the influence coefficient of the main variables is obvious when TI ≤ 1.26%
and TI > 1.26%. One is the direct effect. When TI ≤ 1.26, the coefficient of ER of environmental
regulation is negative but not significant, and the coefficient of quadratic term is not significant,
which indicates that the promoting effect of environmental regulation on reducing economic
fluctuation is not obvious. However, when TI > 1.26, the coefficient of environmental regulation
ER is significantly negative, and the quadratic coefficient is significantly positive, which reflects
again that there is a "U"-type relationship between environmental regulation and economic
then increases. The corresponding inflection point is the level of environmental regulation, 1.781.
In sum, only the production and supply of electricity and heat can be divided into environmental
regulation levels in a few years. However, the other industries have not leapfrogged, which
indicates that an increase in environmental regulation over 1.26% of TI is beneficial to reducing
the economic fluctuation. The second is the upgrading effect of industrial structure. When TI ≤
1.26, the first item of environmental regulation is not significant; however, the coefficient of the
cross item is significantly negative, which is very different from the industrial structure
rationalization model, which indicates that the enhancement of environmental regulation can
promote the upgrading of the industrial structure to a certain extent. Then, we reduce the economic
fluctuation. When TI > 1.26, the primary and cross terms of environmental regulation are
significantly negative, which indicates that environmental regulation can promote the reduction in
economic fluctuations and indirectly reduce economic fluctuations by promoting the upgrading of
the industrial structure. In general, when the level of technological innovation is high, the
enhancement of environmental regulation plays a more important role in upgrading the industrial
structure, promoting labour and capital flow to the complex industries with high knowledge.
Undoubtedly, it is advantageous to promote the upgrading of the industrial structure and reduce
economic fluctuations. In addition, the effect of the coefficient of industrial structure upgrading on
reducing economic fluctuation is obviously larger than that of industrial structure rationalization,
which indicates that the contribution of industrial structure upgrading to reducing economic
fluctuation is greater, and the estimated coefficients of other variables are basically consistent with
the previous ones.
Table5. Dynamic panel threshold estimation results(Advanced industrial structure)
variable
Direct effect Industrial structure upgrading effect
TI≤1.26% TI>1.26% TI≤1.26% TI>1.26%
ER
-442.090
(-0.06)
-352.346***
(-9.34)
48101.090
(1.60)
-155.982***
(-3.25)
ER2 -2669.195
(-0.29)
98.916***
(7.36)
ER
×ISS
-22240.520*
(-1.73)
-57.029**
(-2.57)
(283.48) (259.85)
ISS
-107.534***
(-9.82)
-127.422***
(-8.72)
TI -21.179
**
(-2.59)
-35.154***
(-6.00)
HU
-0.949
(-0.38)
-43.942***
(-32.26)
FDI
-11.926***
(-22.18)
-13.744***
(-44.65)
IV -15.083
***
(-44.65)
-13.390***
(-57.56)
LP
-5.863***
(-21.69)
-2.620***
(-11.68)
Shape / U-shaped / /
Point of
inflection / 1.781 / /
Regional effect yes yes
Time effect yes yes
Sargan
3.290
[1.000]
0.890
[1.000]
AR(1) -0.416
[0.677]
-0.709
[0.478]
AR(2)
-1.271
[0.204]
-0.020
[0.983]
Note:
*, ** and *** mean 1 / 5% and 10% significant level reject the original hypothesis. In parentheses are Z values of statistics and P values of statistics in square brackets.
Currently, China's economy and society have entered the "new normal" of speedy shifts and
structural adjustment. How does the country upgrade its industrial structure under steady
economic fluctuation? In addition, how does the country reduce economic fluctuations through
upgrading the industrial structure is an important problem confronting our country. In this paper,
environmental regulation is used as the intrinsic incentive for upgrading the industrial structure,
and 35 industrial industries in China from 2003 to 2016 are used as the research object. The direct
effect between environmental regulation and economic fluctuation and the upgrading effect of
industrial structure are examined directly by using dynamic panel threshold technology, which
provides a theoretical basis for setting a reasonable environmental regulation intensity to force
industrial structure upgrading to reduce economic fluctuation. The main conclusions are as
follows:
1. The conclusions are as follows: (1) There is an inverted "U"-type relationship between
environmental regulation and economic fluctuation, which is accompanied by the enhancement of
environmental regulation. Economic fluctuation increases first then decreases. (2) The cross terms
between environmental regulation and rationalization of the industrial structure or upgrading the
industrial structure are significantly negative, indicating the enhancement of environmental
regulation. It is beneficial to promote the upgrading of the industrial structure and reduce
economic fluctuation. (3) The coefficients of industrial structure rationalization and industrial
structure upgrading are all significantly negative, indicating that both forms of industrial structure
upgrading are conducive to reducing economic fluctuations.
2. Conclusion of dynamic panel threshold model. (1) Environmental regulation has a
technological innovation threshold for industrial structure upgrading and economic fluctuation;
however, there is no human capital threshold or FDI threshold. (2) In the industrial structure
rationalization model, when TI ≤ 1.35, the effect of environmental regulation on reducing
economic fluctuation is not obvious, but when TI > 1.35, there exists a direct "U" relationship
between environmental regulation and economic fluctuation, which is accompanied by the
enhancement of environmental regulation. The economic fluctuation decreases first then increases,
and the corresponding inflection point is the level of environmental regulation, 2.398. When TI ≤
1.35, the enhancement of environmental regulation does not force the upgrading of the industrial
structure to reduce economic fluctuations, but when TI > 1.35, environmental regulation can
promote a reduction in economic volatility. At the same time, environmental regulation can
In the advanced model of industrial structure, when TI ≤ 1.26, the promoting effect of
environmental regulation on reducing economic fluctuation is not obvious. However, when TI >
1.26, there is a "U" relationship between environmental regulation and economic fluctuation.
When environmental regulation is strengthened, economic fluctuation decreases first then
increases. The corresponding inflection point is the environmental regulation level of 1.781. When
TI ≤ 1.26, the enhancement of environmental regulation can promote the upgrading of the
industrial structure then reduce the economic fluctuation; however, when TI > 1.26, environmental
regulation can promote the reduction of economic fluctuation. At the same time, environmental
regulation can indirectly reduce economic fluctuations by promoting the upgrading of the
industrial structure.
In conclusion, on the one hand, we should establish different environmental regulation level
for different industries. We should strengthen the environmental regulation for the industry
without crossing the inflection point value, enrich the environmental regulation means on the basis
of maintaining the existing environmental regulation level for the industry that has crossed the
inflection point value, and encourage innovative investment through policy combination. We
should also promote the transfer of labour and resources to clean industries and high-tech
industries, optimize the industrial structure, promote steady economic growth, and reduce
fluctuations. (2) We should increase investment in technological innovation, particularly in
industries that do not cross the threshold of technological innovation. Through preferential
policies to improve the investment in technological innovation, we can improve the level of
technological innovation in these industries. On the basis of reasonable investment in
technological innovation, we should optimize the structure to improve efficiency, promote the
advanced development of the industrial structure and reduce economic fluctuation for industries
with high knowledge complexity.
Disclosure statement
The authors declare no conflict of interest
Reference
[1]Xiao Xingzhi, Li Shaolin. Dynamic Impacts of Environmental Regulation of Industrial
[2]Li Qiang et al. Environmental Regulation and Industrial Structure Adjustment: The Theoretical
Analysis and Empirical Study Based on Baumol Model [J]. Economic
Review,2013(5):100-107.
[3]Li Xiaoying. FDI, Environmental Regulation and Industrial Structure Optimization: An
Empirical Evidence Based on Spatial Econometrics Model [J]. Modern Economic
Science,2018(3):104-113.
[4]Zhong Maochu, et al.Can Environmental Regulation Force Industrial Structure Adjustment:
An Empirical Analysis Based on Provincial Panel Data [J]. China's Population, Resources and
Environment,2015(8):107-115.
[5]Gan Chunhui, et al.An Empirical Study on the Effects of Industrial Structure on Economic
Growth and Fluctuations in China [J]. Economic Research Journal,2011(5):4-16.
[6]Li Qiang. Industrial Structure Change Aggravate or Restrain Economic Fluctuations [J].
Economic and Management Studies,2012(7):29-37.
[7]Peng Chong et al.Study on the Dynamic Effects of Industrial Structure on Economic
Fluctuation [J]. Industrial Economy Research,2013(3):91-100.
[8]Zhang Bingbing, Zhu Jing. Study on Influence of Export on Total Factor Energy Efficiency: An
Empirical Analysis from Perspective of 37 Industrial Sectors in China[J]. International Trade
Issues,2015(4):56-65.
[9]Fu Yuanhai, et al. The Selection of Technology Progress Path of Manufacturing Structure
Optimization-An Empirical Analysis Based on Dynamic Panel Data Model [J]. China's
Industrial Economy,2014(9):78-90.
[10]Zhao Wenjun, Yu Jin-ping. Trade Openness,FDI and China's Industrial Economic Growth
Pattern:Empirical Analysis Based on Data of 30 Industrial Sectors [J]. Economic Research
Journal,2012(8):18-31.
[11]Kremer S.,A. Bick,D.Nautz.Inflation and Growth:New Evidence from a Dynamic Panel
Threshold Ana1ysis[J].Empirical Economics,2013(44):1-18.
[12]Mehmet Caner,Bruce E.Hansen.Instrumental Variable Estimation of a Threshold