Rheological and Mechanical Response Modifications for a
Self-Leveling Mortar
N.J. Katsiadramis, A.B. Sotiropoulou and Z.G. Pandermarakisa Department of Civil and Structural Engineering Technology Teachers School of Pedagogical and Technological Education (ASPETE) Irene Train Station – Athens – Greece
Abstract. In many cases cement based materials demand a higher flowability and workability and this conventionally can’t be done without loss of its strength, due to the fact that the common practice to increase the workability is the addition of water. But, nowadays using a third generation superplasticizer (SP) we can achieve the desire flowability without loss of its strength. The action of superplastisizers is to spread efficiently the cement grains and so to wetting better the cement grains giving a more homogeneous mixture with higher strength. Nine different mixtures were prepared adding a small percentage of SP (1%). The conditions to get a self levelling mortar, have to do not only with rheological but also with mechanical demands. The bending and compression test gave the achieving mechanical strength whereas their rheological response came through slump flow and v-funnel flow tests. With the help of a small amount of stabilizer we obtain a robust mixture that deserves the desire response at the field too.
1 Introduction
Some of the usual non wanted disadvantages contradictions of common cement based materials are their demand for enhanced water for satisfactory flowability and workability in order to avoid the need for vibration during compacting, and so enhanced labour, time and energy consumption for the most structures. In such a case, where increased water has been added, the final component has lower density and there is a high risk for segregation of aggregates and bleeding. As a consequence, a diminished strength and durability could be resulted. We can attain an enhanced workability preserving high strength, using suitable chemical additives as superplasticizers (SPs). For concretes the self consolidated concrete is appeared and in correspondence to this for mortars, the self-levelling or self-compacting mortar. The third generation superplasticizers appear many advantages but the most powerful are their higher efficiency. The action of polycarbonate superplastisizers is based to the fact that can be defolded and attached suitably on cement grains disperse them electrostaicaly and by steric. This action help grains to disperse better in water and so to improve the hydration efficiency. The increased hydration level together with low porosity gives high strength and enhanced durability. This higher flowability of self-levelling mortar has as result less time and labour consumption, the absent of vibration and a better finishing surface. Coarse aggregates act as
a
e-mail: [email protected]
obstacle increasing mortar viscosity whereas small grains act as lubricating paste improving the flow. So, there are some constituents’ percentage that are critical. Cement and other binders to paste and of course water to powder are some of the high importance ratios. Common values for these quantities in order to achieve a self-levelling mortar are: w/c=0.3 to 0.6, w/p=0.8 to 1 and. SP=1%, In any case, the exact portion of each constituent and SP is specified by test and error trials [1]÷[3].
2 Materials and specimens preparation
High strength cement I52.5 was used with marble aggregates up to 4mm size, which come as by-product from marble quarry. Superplasticizer was kept at 1% for all mixture. A total of nine different mixtures were manufacture. Their percentages in each case are shown in Table1.
Table 1. Mixtures composition.
Mixture Cement
(kg/m3) Aggregates (kg/m3) (kg/mWater 3) SP Stabilizer
A 510.32 1530.96 260.26 - -
B 510.32 1530.96 260.26 (1% of cem) -
C 510.32 1530.96 260.26 (1% of cem) (0.7% of cem)
D 380.00 1530.96 193.80 - -
E 380.00 1530.96 193.80 (1% of cem) -
F 380.00 1530.96 193.80 (1% of cem) (0.7% of cem)
G 380.00 1530.96 228.00 - -
H 380.00 1530.96 228.00 (1% of cem) -
I 380.00 1530.96 228.00 (1% of cem) (0.7% of cem)
In these compositions the cement was kept in the range of 400 to 500 kg/m3 and the w/c to the range
of 0.5 to 0.6 and w/p near to 1/4. Cement and aggregates were mix for 30 sec. Then the water with superplasticizer was added and mixes slowly for 90sec and for 60sec speedily. The stabilizer if any was added with superplasticizer. In order to specify the strength of hardened mortars, specimens with dimensions 16cm x 4cm x 4cm were prepared in standard moulds. Only the A mixture was vibrated during its consolidation process. The specimens after a day curing were immerged in a water tank for 28 days and next they left for another 28 days in room conditions for their moisture equilibration. In order to observe any segregation trend, large beams were prepared with dimensions 70cm x 15cm x 15cm.
3 Rheological and mechanical response
3.1 Slump flow test of fresh mortar
Fig. 1a,b. The filling of cone for the slump flow test and the spread of fresh mortar .
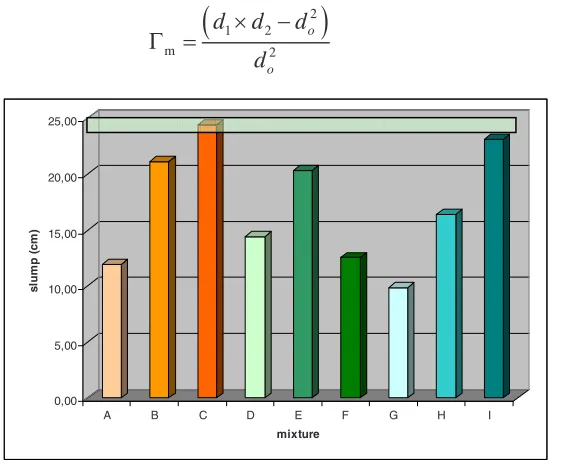
In fig.2 we can see the slump of fresh mortar from the nine different mixtures. The target values for slump are 24 to 26cm. From slump measurements we can estimate the relative flow area m as:
2 1 2
m 2
o
o
d d
d
d
(1)Fig. 2. The spread of fresh mortar mixtures from slump flow test.
The larger the relative flow of a fresh mortar is the higher its deformability and so its flowability and workability.
3.2 V-funnel test of fresh mortar
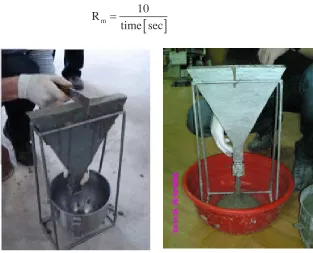
In V-funnel test we fill a V-shape container as this in fig.3 and we measure the time to flow down all the fresh mortar from the bottom open of the apparatus. From this test we can estimate the narrow opening passability of fresh mortar under its self weight. A magnitude that corresponds to the viscosity of the fresh mixture.
0,00 5,00 10,00 15,00 20,00 25,00
sl
um
p
(c
m
)
A B C D E F G H I
We can also calculate the relative funnel speed Rm as:
m
10
R
time sec
(2)Fig. 3. The fresh mortar flow during V-funnel test.
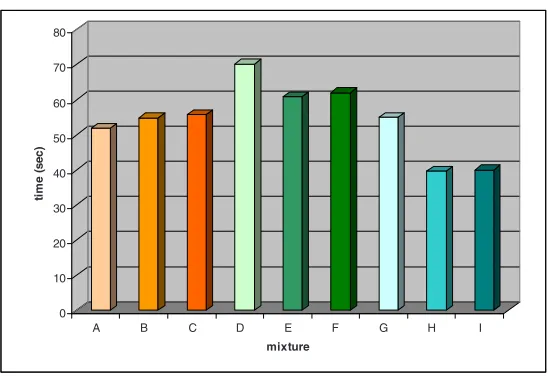
The measuring time from V-funnel test is shown in fig.4. The target values are in the range from 7 to 11 sec. The higher the time is, the lower is its viscosity and its passability.
Fig. 4. The time from V-funnel test for each composition.
0 5 10 15 20 25 30 35 40
tim
e
(s
ec
)
A B C D E F G H I
In the cases were time is absent, the fresh mortar was so tough to flow through V-funnel. From the above we can see that for an enhanced deformability of fresh mortar high slump values and low V-funnel times are needed, but in some critical zones due to the danger of the segregation appearance
3.3 Bending strength of hardened mortar
Three point bending tests and compression tests were carried out on standards specimens in order to estimate the mechanical response of the hardened mortars. The bending test was carried out on 16cmx4cmx4cm prismatic specimens whereas the compression test on the two pieces that comes from bending test. The results are shown in fig.5 and fig.6 respectively.
Fig. 5. Flexural strength of hardened mortar mixtures.
Fig. 6. Compressive strength of hardened mortar mixtures.
0 2 4 6 8 10 12
fle
xu
ra
l s
tr
en
gt
h
(M
P
a)
A B C D E F G H I
mixture
0 10 20 30 40 50 60 70 80
tim
e
(s
ec
)
A B C D E F G H I
3.4 Segregation tests
In order to estimate the appearance of segregation if any, we construct prismatic beams with dimensions 70cmx15cmx15cm and were tested in three four point bending test fig.7. The fracture surfaces were sprayed with phenolphthalein and were examined for segregations indications. In fig. 8 we show a representative icon of fracture surfaces. On the right of this figure we can see the percentage of large aggregates through the height of the surface. No any indices for clear segregation are appeared. Ultrasonic inspection gave the same results.
3 Discussion of results
We can separate the mixtures in three groups. The fist is a group with the mixture A-B-C . The
Fig. 7. For segregation inspection four point bending tests were carried out on large prismatic beams, in order to investigate the appeared fracture surfaces.
second is formed with D-E-F, and the last with G-H-I. In all these the decisive ratios and constituents percentages remain the same and the only difference is the addition or not of superplasticizer and of stabilizer. We can see that the addition of a small percentage of SP improves the rheological response of fresh mixture giving high slump values and small V-funnel times. This means high deformability and so better flowability and of course workability and at the same time without any segregation appearance. The addition of stabilizer improves also the rheological response of fresh mortar but with a combinational manner. On groups A-B-C and G-H-I leads to a higher flowability whereas on group D-E-F (where the water to solids ratio was low) give a lower deformability. As we can see from V-funnel and slump test whereas the enhanced water percentage leads to lower viscosity, at the same time a higher cohesion and connectivity of fresh mortar is appeared.
From the other hand, by the mechanical tests, we can see that the reduction of water content leads to a high bending and compression strength as is expected. The addition of SP hasn’t specific monotonic absolute influence on mechanical strength of a hardened mortar. We can see differences on bending and compressive strength from the use of SP in each group. Usually, it seems to enhance or at least deserve unaltered the mechanical strength of hardened mortars except for compression response of groups D-E-F and G-H-I. At these groups the water to powder ratio appears to be lower and possibly a better dispersion of grains lead to a lesser water available for curing and so to lower strengths.
References
1. RILEM TC 174-SCC, Self-Compacting Concrete. Proceedings of the First International Symposium, Ed. by A. Skarendahl and O. Petersson (Stockholm, Sweden Sept. 1999)
2. JSCE Proceedings of the International Workshop onSelf-Compacting Concrete. Kochi, Ed. by K. Ozawa and M. Ouchi, JSCE Concrete Engineering Series 30 (1998)