Matics Software Suite: New Tools for Evaluation and Data Exploration
Olivier Galibert, Guillaume Bernard, Agnes Delaborde, Sabrina Lecadre, Juliette Kahn
Laboratoire national de m´etrologie et d’essais1 rue Gaston Boissier - 75015 Paris, France [email protected]
Abstract
Matics is a free and open-source software suite for exploring annotated data and evaluation results. It proposes a dataframe data model allowing the intuitive exploration of data characteristics and evaluation results and provides support for graphing the values and running appropriate statistical tests. The tools already run on several Natural Language Processing tasks and standard annotation formats, and are under on-going development.
1.
Introduction
The evaluation of data processing systems is a cornerstone for developers, researchers and users. The evaluation al-lows positioning a technology with regard to the compe-tition, but also allows assessing the performance of the system in different contexts. Through quantified scores, it orientates the development or guides the user towards the most suitable product. As evidenced by the popular-ity of evaluation competitions such as the VarDial eval-uation campaigns (Malmasi et al., 2016), the Interspeech challenges (Schuller et al., 2017), the CoNLL Shared Tasks (Oepen et al., 2017) or the Evalita evaluation cam-paign (Pierpaolo et al., 2017), there is a constant need for the rapidly-evolving Natural Language Processing (NLP) technologies to position themselves.
The evaluation of text, speech or multimedia data pro-cessing systems relies on large amounts of usually anno-tated data. Numerous works propose interfaces or frame-works to build, explore and visualize corpora of annotated data. ANVIL (Kipp, 2010) for instance proposes a well-conceived database-oriented annotation tool where the user can add temporally or spatially grounded elements. The an-notated data can be exported to perform statistical analyses in several external systems. UAM (O’Donnell, 2008) em-phasizes the project management aspects in a multi-layer text annotation task and offers dedicated statistical analysis tools. Headtalk/Handtalk (Knight et al., 2009) explores the annotation and visualization of multimodal corpora, for the purpose of building datasets suitable for statistic analysis. Some propose a framework able to explore data in a spe-cific context. (Schmitt et al., 2010) for instance is dialogue-oriented, and presents a multi-level interface including di-alog selection from a database, display of the selected dia-log, and application and evaluation of integrated prediction models for various characteristics (task completion, anger level, age and gender predictions).
All these systems are mainly dedicated to annotation tasks and/or to specific NLP applications. They offer data ex-ploration features, and can either produce data formatted to perform an evaluation in an external system, or offer statis-tical analysis specialized for testing coherency or measur-ing advance on a specific NLP task.
The LNE (laboratoire national de m´etrologie et d’essais -French national metrology and testing laboratory) has
conducted many evaluations of data-processing systems in projects such as Quaero (Galibert et al., 2011), ETAPE (Gravier et al., 2012), MAURDOR (Brunessaux et al., 2014), PEA-TRAD or REPERE (Giraudel et al., 2012; Galibert and Kahn, 2013). These evaluations con-cerned various NLP tasks and systems (speech recognition, speaker diarization, speaker identification, named entities recognition, optical character recognition, etc.), which im-plied dealing with different system output formats, annota-tion guides, and comparison metrics. A number of com-monalities appeared through time in the process of such evaluations, in the pre-processing and exploration of the data and the computation and viewing of statistical scores, hence the need for a reusable and general framework to carry out the evaluations.
One aspect we are especially interested in is to be able to assess the representativity of the different sub-corpora cre-ated (train, development, test) and to identify factors of in-fluence on the performance of the system. Such an analysis is usually done through a mix of independent evaluation tools, ad-hoc data extraction scripts and generic analysis engines (such as R), or dedicated to a specific NLP task (such as the NIST Scoring Toolkit SCTK (NIST, 2015) for speech recognition). This works perfectly fine for evalua-tions on specific applicaevalua-tions, or on databases of average size; this becomes somewhat burdensome when perform-ing large scale evaluations on a great panel of application types.
We thus decided to build a new tool to provide a uni-fied response to our evaluation needs by first testing some data handling and UI prototype in a pre-project called LNE-Visu, presented in a demonstration at the French JEP-TAL-Recital joint conference in 2016 (Bernard et al., 2016).
Then, taking the results into account, we started an inter-nal project to build the Matics software suite, to implement the vision we have of such an exploration interface. It inte-grates evaluation, exploration at varying granularity, graph-ical representations and statistgraph-ical testing. All these aspects are presented in this paper.
2.
Matics at a Glance
2.1.
General Description
• DATOMATIC: It is designed for the importation and database indexation of corpora and files. The data can be made up of reference data (e. g. labeled by an ex-pert) and hypothesis data (output of an NLP system, automatically labeled). Source data (i. e. unlabeled and/or unstructured) can also be included, such as plain text or audio. The data can be browsed through via search features, and visualized according to their types (text, video, audio and the related annotations). The software offers several descriptive statistics (sig-nal duration, number of words/speakers/entities, file or language distribution...). Multi-criteria sub-selections on the corpora can be performed. The resulting cor-pora can be locally exported to be processed in Evalo-matic.
• EVALOMATIC: Evalomatic works exclusively on Datomatic formatted databases. Evalomatic allows running evaluations, for example comparisons be-tween reference and hypothesis data for speech tran-scription tasks. The reference and hypothesis data (as well as the evaluation results) are structured as dataframes, which allows performing several manip-ulations on the data for an evaluation at different lev-els of granularity. The software offers several standard comparison metrics (e. g. F-measure, Slot Error Rate SER), some of which specifically designed for NLP (e. g. Word Error Rate WER). Statistical functions are provided (e. g. t-tests or Anova). Data and results can be plotted on graphs (e. g. DET plot, bar chart).
Matics is an on-going work, initially developed to address our team’s evaluation needs. The decision of publicly re-leasing it is motivated by our wish to contribute to a thriv-ing development of NLP technologies, and artificially intel-ligent systems on the whole. In its earlier stages, the soft-ware suite presents some limitations: we do not guarantee it is fully bug-free, many features are left to add, and as of now the interface only offers French. Evaluation being our core activity, the development of Matics is one of our main priorities, and there are, and will be, constant updates.
2.2.
Availability
The Matics suite is free and open-source. It can be down-loaded at: https://www.lne.fr/logiciels/lne-matics.
2.3.
Supported NLP Tasks
As of now, Matics allows performing evaluations on NLP systems for these tasks:
• Automatic Speech Recognition (ASR)
• Named Entity Recognition (NER)
• Tokenization
• Lemmatization
• Speaker verification
Note that Matics supports Latin and non Latin alphabet lan-guages (Chinese, Arabic, Russian...).
2.4.
Supported External Formats
Matics supports several standard structured formats, like XML (e. g. Transcriber) or the Tab Delimited Format of XTrans. It also supports annotation formats such as:
• The stm and ctm file formats (in the sclite() program developed by the NIST for the evaluation of speech recognizers);
• The CoNLL-X format (Tjong Kim Sang and De Meul-der, 2003);
• MUC-7 (Chinchor and Robinson, 1997);
• QUAERO (Galibert et al., 2011).
As of now, unsupported formats need to be externally trans-formed into an supported format so as to be loadable in Datomatic, but supporting new formats for an already han-dled task requires a reasonable amount of effort.
2.5.
Implemented Metrics
• ASR: WER (Word Error Rate); CER (Character Error Rate; NCE (Normalised Cross-Entropy)
• NER: SER (Slot Error Rate); ETER (Entity Tree Error Rate)
• Speaker verification: EER (Equal Error Rate); Cdet (Cost of DETection); Cllr(Cost Log-Likelihood Ratio)
• General metrics: F-measure; Recall; Precision
These metrics cover the evaluation of NLP applications de-scribed hereinbefore. New metrics will be added along with the expansion of the NLP tasks list.
2.6.
Statistical Functions
A toolbox of several standard statistical functions is avail-able. The result of these functions can be used as new columns in the dataframe, meaning that they can be used as a test statistic in the evaluation.
• Descriptive statistics:
– Gaussian statistics: mean, standard deviation, skewness, kurtosis
– Distributional statistics: min, max, median, first and last quartile, first and last decile, mode
• Significance tests on paired experiments:
– Gaussian : paired t-test
– Non parametric: Wilcoxon
• Correlation tests:
– Pearson linear correlation
– Rank correlation (Kendall, Spearman)
3.
Matics Capabilities and Concepts
3.1.
Data Management
3.1.1. Dataframe
The main underlying concept used in the Evalomatic inter-face is theDataframe. It is a table roughly equivalent to a single SQL table or a R data frame. Each column has a two-part name: a group name and a column name. For instance the “speaker” group may have the columns “speaker.name”, “speaker.gender” and “speaker.accent”. Each column has a type that is built from four traits:
1. The column may containlabelsorvalues: labels are names into categories (file name, speaker name, gen-der, turn id...) while values are actual values (time, score, word, text segment...).
2. The datatype of the column content can be string or numeric (integer for labels, floating-point for values).
3. The column can store the initial values/labels, or val-ues computed from other columns through expres-sions.
4. (optional) The column can have a sub-type that tells the interface how to show or interpret the values. Cur-rently defined sub-types are name, time, p-value (for statistical tests) and correlation (for correlation tests).
Non-expression columns actually store data. A stored value often span multiple lines. For instance, a speech transcrip-tion evaluatranscrip-tion dataframe has one line per aligned word. In that dataframe, the turn start and end times span all the words of that turn. That spanned information is explic-itly stored in the dataframe. In addition, some cells can be empty, which is a different status from zero or an empty string.
3.1.2. Granularity and Foldable Categories
A key capability of that dataframe structure is a variable granularity. Lines can be folded together, and columns op-tionally have a folding method, called reduce operation, which defines how the value for the folded lines is com-puted. A number of reduce operations are already avail-able: min, max, mean, median, sum for numeric values, concatenation for string values. Expression columns either include a reduce operation, and then compute their value at the lowest possible granularity then apply the operation, or do not include a reduce operation and compute the value from the reduced values of the other columns.
To illustrate that capability, two examples can be given. Computing the WER in speech transcription is done by di-viding the count of errors by the number of words in the ref-erence. The WER is then an expression column without re-duce operation which divides the value in the error column by the value in the reference words count column. These two source columns on the other hand have a “sum” reduce operation to accumulate the count of errors and words at the required granularity.
In contrast, computing the total speech time is done from the speech duration column which is an expression defined as turn end time minus turn start time, with a sum reduce
operation. In that configuration the durations are computed at the turn level and summed together, giving the total turn time. The spans of the values in the start and end time columns are what sets the duration computation granular-ity.
3.2.
Evaluation capabilities
As detailed in Sections 2.3. and 2.5., Matics can deal with the evaluation of several NLP tasks and implements the cor-responding metrics. All the input formats are converted to reference or hypothesis dataframes which are then used to build an evaluation dataframe with a complete alignment of the texts.
The ASR evaluation subsystem, for example, is able to work on the word or character level, and take the case into account when requested to. It uses unicode for multilingual support.
The final evaluation dataframe contains the full alignment and the error counts per type, with computed columns added to provide WER/CER (Crossover Error Rate) and NCE (Normalized Cross Entropy) at any chosen granular-ity.
3.3.
Statistical analysis capabilities
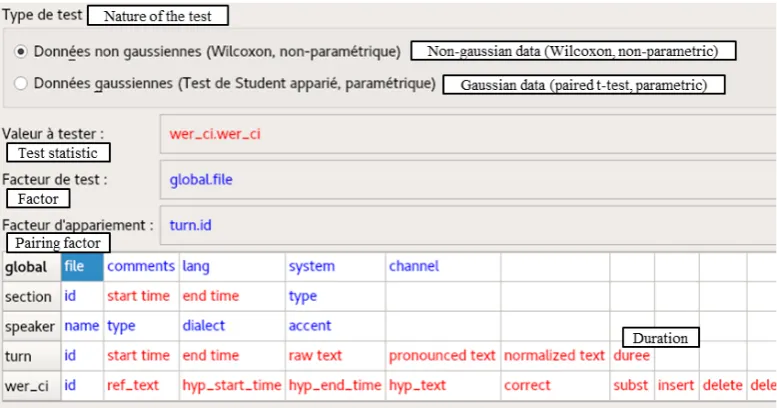
One aim of the interface is to give a fast access to statisti-cal testing capabilities. The list of the currently available functions has been presented in Section 2.6.. A uniform, drag’n’drop based interface is proposed to select the data columns the testing applies to.
In the case of the standard descriptive statistics on a value, for example, the user selects a value column to compute the statistic on (for instance WER) and a label column for the granularity (for instance speech turn). They can also optionally select a factor column as a factor (for instance “System” – the NLP system of which we evaluate the out-put results) to comout-pute a series of statistics instead of a global one. The computation of these statistics allows the user to summarize the distribution of the values and get an idea of how gaussian and symmetrical they are.
The second available analysis is a very common one: sig-nificance of a difference for paired values. The user selects a value (e. g. WER), a pairing/granularity (speech turn) and the factor to analyze (system) and the interface computes, for each system pair, the p-value, e. g. the probability that the WERs are in practice identical and the differences only randomness. It can use either a Student paired t-test if the user considers the values gaussian (which is rare), or a less powerful but more robust Wilcoxon paired-difference test otherwise.
4.
User Interface
This section presents some views of the user interface of-fered by Matics.
4.1.
Dataframe views
Figure 1: Evaluation dataframe with every line folded but the system name. The WER is updated and represents the global score for all the files of the system.
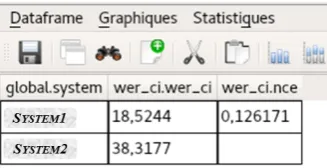
Figure 2: Evaluation dataframe for the comparison of two systems (names have been blurred out). Every line folded but the system and file name. wer ci: WER case indepen-dent.
The main interaction is done with the dataframe. A dataframe has views on it, where each view has its own state. The user has control over which columns are visi-ble and in which order they appear. The display granularity is implicitely controlled by the visible columns: consecu-tive lines with identical labels in all the label columns are collapsed. If every column is hidden except for the sys-tem name and the WER, then the per-syssys-tem WER is vis-ible, as can be seen in Figure 1. When the file name col-umn is then shown, the per-file score then becomes visible, as in Figure 2. The dataframe can also be sorted on the columns, giving the possibility to get a per-speaker score in a dataframe originally generated with lines in time order. Filtering is also possible, to view a subset of the lines. The active granularity and filtering is taken into account when doing a graph, while only the filtering is taken into ac-count for statistical tests and the granularity is requested explicitely.
4.2.
Data visualization
The interface gives the capability to link to source data (au-dio, video, etc.) and visualize the annotations present in
a dataframe with an appropriate alignment to the original signal.
The audio display and listening is currently available. The interface allows listening to the signal at different levels: the whole signal, per speaker, per sentences, or per words. The segmentation follows the timestamps defined in the corresponding annotation file. The Figure 3 shows a screen capture of the interface.
4.3.
Statistical Functions Selection
The selection form can be seen in Figure 4. The user can drag and drop between the column list at the bottom and the configurable fields in the middle.
4.4.
Graphing
The other main capability of the interface is graphing data, to ease the visualization of data and results.
• Bar charts — The histogram graphic category can plot any value. The basic histogram allows graphing of one or more value columns with one or more label columns on the x axis. This allows counting the number of dif-ferent labels in one column, using another for the x axis (for instance counting the speakers in each show) with optionally a third used to color subparts of the histogram (gender for instance). An optional gaussian curve can be overlaid.
• Scatterplots — The scatterplots can be created from two value columns with color and shape controlled from label columns. An example of scatterplot show-ing the lack of correlation between file speech duration in a file and the WER can be seen in Figure 5.
• Boxplots — Visualisation of the distribution of the data, through quartile and decile. A same graph can show the boxes for different factors (file, system...).
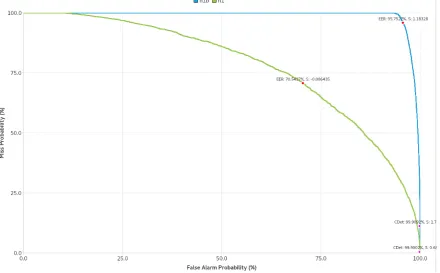
• Detection Error Tradeoff (DET) curves — For binary classification. The DET curves for several systems can be presented at once for visual comparison, with a vi-sualization of EER and Cdetdecision thresholds. See an example Figure 6.
5.
Conclusion
The Matics software suite offers a unified tool for the eval-uation of NLP systems, through two independent tools: Datomatic and Evalomatic. Datomatic allows the manip-ulation, visualisation and sub-selection of hypothesis and reference corpora; evaluations can be conducted in Evalo-matic, with metrics implemented for a range of NLP appli-cations.
Developed by the LNE, specialized in the evaluation of NLP systems, Matics is free and open-source. While still in the development stage, the tool aims at providing a con-crete and fully reusable solution for data exploration and evaluation. New features are expected to be implemented, and regular updates of the system will be offered according to the evolution of our evaluation activities.
Figure 3: Audio signal and the associated transcription. A click on each token (one per rectangle in the center area) plays the corresponding audio segment.
Figure 4: Statistical paired difference configuration interface. In blue (e. g. comments, lang, system): labels of the columns; in red (e. g. start time, end time): values of the columns. Labels in English have been added on the figure to translate the French items.
Figure 5: Scatterplot of WER vs. speech duration in a file
also concerned with a localization feature, to broaden out the system to the non-French speaking community. Al-though the interface vocabulary may be quite transparent to computer scientists and statisticians, that would be a strong requirement in terms of ergonomics. The localization
pro-cess requires some modification at the core of the system that will be addressed soon.
A longer term perspective is to give the interface the ca-pability to rewrite the different supported formats, and use that capability combined with statistical analysis possibili-ties to select representative subsets of data for train, devel-opment and test. This aspect, while quite out of the scope of evaluation, is also part of our mission of accompanying technology developers.
6.
Bibliographical References
Bernard, G., Galibert, O., R´emi, R., Demeyer, S., and Kahn, J. (2016). LNE-Visu : une plateforme d’exploration et de visualisation de donn´ees d’´evaluation (LNE-Visu: a platform for the exploration and display of evaluation data). InProceedings of the JEP-TALN-Recital joint conference, 07.
Figure 6: DET curves for two simulated systems (named h1b and h1) with EER and Cdetdecision thresholds.
(2014). The Maurdor Project: Improving Automatic Processing of Digital Documents. In 2014 11th IAPR International Workshop on Document Analysis Systems, pages 349–354, April.
Chinchor, N. and Robinson, P. (1997). MUC-7 named en-tity task definition. InProceedings of the 7th Conference on Message Understanding, volume 29.
Galibert, O. and Kahn, J. (2013). The First Official REPERE Evaluation. InFirst Workshop on Speech, Lan-guage and Audio in Multimedia (SLAM’13).
Galibert, O., Rosset, S., Grouin, C., Zweigenbaum, P., and Quintard, L. (2011). Structured and Extended Named Entity Evaluation in Automatic Speech Transcriptions. InProc of IJCNLP, Chiang Mai, Thailand, 9-11 novem-bre.
Giraudel, A., Carr´e, M., Mapelli, V., Kahn, J., Galibert, O., and Quintard, L. (2012). The REPERE Corpus : a multi-modal corpus for person recognition. In Nicoletta Calzo-lari (Conference Chair), et al., editors,Proceedings of the Eight International Conference on Language Resources and Evaluation (LREC’12), Istanbul, Turkey, may. Euro-pean Language Resources Association (ELRA). Gravier, G., Adda, G., Paulson, N., Carr´e, M., Giraudel,
A., and Galibert, O. (2012). The ETAPE corpus for the evaluation of speech-based TV content processing in the French language. InLREC - Eighth international con-ference on Language Resources and Evaluation, Turkey. Kipp, M. (2010). Multimedia annotation, querying and analysis in ANVIL. Multimedia information extraction, 19.
Knight, D., Evans, D., Carter, R., and Adolphs, S. (2009). HeadTalk, HandTalk and the corpus: Towards a frame-work for multi-modal, multi-media corpus development.
Corpora, 4(1):1–32.
Malmasi, S., Zampieri, M., Ljubeˇsi´c, N., Nakov, P., Ali, A., and Tiedemann, J. (2016). Discriminating between Similar Languages and Arabic Dialect Identification: A Report on the Third DSL Shared Task. In Proceedings of the Third Workshop on NLP for Similar Languages, Varieties and Dialects (VarDial3), pages 1–14, Osaka, Japan, December.
NIST. (2015). NIST Multimodal Information Group
- Tools. https://www.nist.gov/itl/iad/
mig/tools. Accessed: 2018-02-21.
O’Donnell, M. (2008). The UAM CorpusTool: Software for corpus annotation and exploration. InProceedings of the XXVI Congreso de AESLA, pages 1433–1447, 01. Oepen, S., Øvrelid, L., Bj¨orne, J., Johansson, R., Lapponi,
E., Ginter, F., and Velldal, E. (2017). The 2017 Shared Task on Extrinsic Parser Evaluation Towards a Reusable Community Infrastructure. EPE 2017, page 1.
Pierpaolo, B., Malvina, N., Patti, V., Rachele, S., and Francesco, C. (2017). EVALITA Goes Social: Tasks, Data, and Community at the 2016 Edition. Italian Jour-nal of ComputatioJour-nal Linguistics, 3(1):93–127.
Schmitt, A., Bertrand, G., Heinroth, T., Minker, W., and Liscombe, J. (2010). WITcHCRafT: A Workbench for Intelligent exploraTion of Human ComputeR con-versaTions. In Nicoletta Calzolari (Conference Chair), et al., editors, Proceedings of the Seventh Interna-tional Conference on Language Resources and Evalu-ation (LREC’10), Valletta, Malta, may. European Lan-guage Resources Association (ELRA).
inter-speech 2017 computational paralinguistics challenge: Addressee, cold & snoring. InComputational Paralin-guistics Challenge (ComParE), Interspeech 2017, pages 3442–3446.