Problems in Evaluating Grammatical Error Detection Systems
M ar tin CHODOROW
1M arkus DICK INSON
2Ross ISRAE L
2J oel T ETREAU LT
3(1) Hunter College and the Graduate Center, City University of New York, New York, NY 10065, USA (2) Indiana University, Department of Linguistics, Bloomington, IN 47405, USA
(3) Educational Testing Service, Rosedale Road, Princeton, NJ 08540, USA [email protected], [email protected], [email protected],
A
BSTRACTMany evaluation issues for grammatical error detection have previously been overlooked, making it hard to draw meaningful comparisons between different approaches, even when they are evaluated on the same corpus. To begin with, the three-way contingency between a writer’s sentence, the annotator’s correction, and the system’s output makes evaluation more complex than in some other NLP tasks, which we address by presenting an intuitive evaluation scheme. Of particular importance to error detection is the skew of the data – the low frequency of errors as compared to non-errors – which distorts some traditional measures of performance and limits their usefulness, leading us to recommend the reporting of raw measurements (true positives, false negatives, false positives, true negatives). Other issues that are particularly vexing for error detection focus on defining these raw measurements: specifying the size or scope of an error, properly treating errors as graded rather than discrete phenomena, and counting non-errors. We discuss recommendations for best practices with regard to reporting the results of system evaluation for these cases, recommendations which depend upon making clear one’s assumptions and applications for error detection. By highlighting the problems with current error detection evaluation, the field will be better able to move forward.
1 Introduction
With hundreds of millions of people worldwide learning second, or even third, languages (Leacock et al., 2010), there is a large and growing need for NLP systems that automatically detect and correct the grammar and word usage errors that learners make. In response to this need, NLP researchers have developed tools to target errors involving articles (Han et al., 2006), prepositions (Tetreault and Chodorow, 2008b), particles (Dickinson et al., 2011), verb forms (Lee and Seneff, 2008), and collocations (Dahlmeier and Ng, 2011). Research in this field has surged over the last few years, culminating notably in two recent “Helping Our Own” (HOO) Shared Tasks (Dale and Kilgarriff, 2010) and (Dale et al., 2012), which are concerned with automated error correction in texts authored by non-native speakers of English working in NLP. However, despite this high level of activity and interest, there is relatively little consensus on how best to evaluate grammatical error detection/correction systems. This makes it hard to measure performance and compare systems, which is essential for progress in the field. The goal of this paper is to draw attention to the many evaluation issues in error detection that have largely been overlooked in the past and which make it hard to draw meaningful comparisons between different approaches, even when they are evaluated on the same corpus. Of particular importance is the skew of the data – the low frequency of errors as compared to non-errors – which distorts some traditional measures of performance and limits their usefulness. Many issues in evaluation remain outside the scope of this paper, and we will not have recommendations for every problem that we discuss. However, we feel that highlighting the problems will help to move the field forward.
The lack of consensus in evaluation is due, in large part, to the nature of the error detection task. Consider (1a), a sentence that a learner of English might write.1It could be corrected by a human annotator or a system as (1b), (1c), (1d), or any number of other grammatical variants.
(1) a. Book of my class inpired to me. b. A book in my class inspired me. c. Books for my class inspired me.
d. The books of my class were inspiring to me.
How we count the number, type, and scope of errors in the learner’s sentence depends on the relation between what was written and the annotator’s correction. However, on the task of error detection, how we score the performance of an NLP system depends on the relation between the system’s output andboththe learner’s sentence and the annotator’s correction. This three-way contingency makes the evaluation inherently more complex than in some other NLP tasks where the only comparison is between system and annotator. In Section 3.1, we describe the standard measures of system performance (Accuracy, Precision, Recall, F-measure), and in Section 3.2, we map a three-way contingency table of matches and mismatches among writer, annotator, and system onto the standard evaluation measures. Section 3.3 examines general problems that arise in using these measures, and Section 3.4 describes the variety of
1For the sake of simplicity, we use constructed examples of grammatical errors to illustrate the evaluation issues
metrics found in published reports of system performance. Sections 3.5 and 3.6 deal with three issues that are particularly vexing for error detection: how to specify the size or scope of an error, how to properly treat errors as graded rather than discrete phenomena, and how to count non-errors. Each subsection contains recommendations for best practices with regard to reporting the results of system evaluation. Certain metrics are more or less appropriate depending on the type of task the system is used for, so we begin with a brief overview of applications of grammatical error detection.
2 Applications
It is not surprising that most applications of grammatical error detection are in education, where it has been used for student assessment and to support language learning. A more recent set of applications focuses on improving systems within the domain of NLP itself.
Automatically scoring essays Error detection is a fundamental component in most systems which perform automated essay scoring (Yannakoudakis et al., 2011; Attali and Burstein, 2006; Burstein et al., 2003; Lonsdale and Strong-Krause, 2003). The goal here is to find aspects of grammar and word usage related to overall text quality so that a holistic score, usually on a 5-or 6-point scale, can be generated. Essay sc5-oring systems also measure the range of vocabulary, discourse structure, and the mechanics of writing (e.g., spelling) as predictors of the writing score. These systems are used for large scale high-stakes tests taken by native and non-native speakers, such as the Graduate Record Exam (GRE), and for tests of non-native proficiency, such as the Test of English as a Foreign Language (TOEFL).
Improving writing quality To date, most work that focuses on writing assistance tools has targeted non-native English writers. Grammatical error detection in this context is used to assist one in producing better essays or other documents (Chodorow et al., 2010; Hirst and Budanitsky, 2005; Kukich, 1992). In the short term, the goal of providing this assistance is to improve the current document by highlighting errors and suggesting corrections. In the longer term, the goal is to help writers learn more about the language they are studying so that they can produce higher quality writing, as described next.
Assisting language learning An indicative example of assisting language learners can be found in various Intelligent Tutoring Systems, which provide learners with immediate feedback on their language constructions (Meurers, 2012; Heift and Schulze, 2007). Learners not only need to observe their errors but also to understand the meta-linguistic properties of such errors. Furthermore, systems must track not just what the learner is doing incorrectly, but also what the learner is doing correctly, in order to properly model behavior (Amaral and Meurers, 2007). For both purposes, error detection is needed to detect errors, suggest corrections, and provide information about the linguistic properties of the writer’s mistakes.
3 Measuring Performance
3.1 Traditional Evaluation Measures
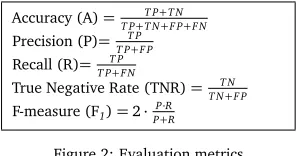
To illustrate the traditional measures of NLP system evaluation, consider as an example the task of comma restoration (see, e.g. Shieber and Tao, 2003), in which the commas are removed from a well-edited text (the gold standard) and a system attempts to restore them by predicting their locations. For evaluations involving a binary distinction such as this one (the presence vs. absence of a comma), a comparison between the system’s output and the annotator’s judgments (the gold standard) can be organized as a two-by-two contingency table, shown in Figure 1. Presence of a comma is the target or positive class, and absence is the negative class. Positions in the text where both the system and the gold standard indicate that there should be a comma are true positives (TP); those where both indicate no comma are true negatives (TN); those where the system predicts a comma but the gold standard shows no comma are false positives (FP); and those positions where the system predicts no comma but the gold standard shows a comma are false negatives (FN). Given counts for these four contingencies, it is straightforward to calculate measures such as Accuracy (A), Precision (P), Recall (R), true-negative rate (TNR), and F-score (F1), as shown in Figure 2.
[image:4.420.88.321.245.285.2]Annotation (Gold Standard) Comma (+) No comma (-) System prediction No comma (-)Comma (+) FNTP TNFP
Figure 1: The basis for typical NLP system evaluation
Accuracy (A)=T P+T N+F P+F NT P+T N
Precision (P)=T P+F PT P
Recall (R)=T P+F NT P
True Negative Rate (TNR)=T N+F PT N
[image:4.420.129.279.313.391.2]F-measure (F1)=2·P+RP·R
Figure 2: Evaluation metrics
3.2 Error Detection and the Three-Way Contingency Table
Annotation (Gold Standard)
Comma No comma
Writer’s form Comma No comma Comma No comma Pos (+)/Neg (-) class No Error (-) Error (+) Error (+) No error (-)
System prediction Comma TN TP FN FP
[image:5.420.152.282.205.281.2]No comma FP FN TP TN
Figure 3: The basis for error detection evaluation
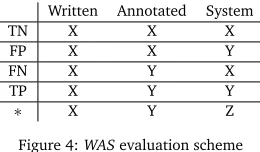
evaluation scheme, is a simpler and more intuitive way of characterizing the relationships. To determine whether a case is a TN, TP, FN, or FP, the three sources of input are compared to see which, if any, agree. The X, Y, and Z in the figure are variables that can be replaced with any type of token; what is important is whether or not they match.
Written Annotated System
TN X X X
FP X X Y
FN X Y X
TP X Y Y
∗ X Y Z
Figure 4:WASevaluation scheme
Note that the first row in Figure 4 (with answers of X from each input) can apply to multiple outcomes, as in preposition selection, or to a binary classification task, such as the presence or absence of a comma; we focus on the binary task, to be consistent with the previous figures. If all three inputs agree, the case is tallied as a TN. If the System agrees with the Annotator but the Writer does not, then it is a TP. For binary classification tasks, the first four rows are sufficient for both detection and correction, as detecting an error naturally suggests the correct answer. For tasks that involve more than two classes, further distinctions are needed to distinguish detection and correction. The final row in the figure represents a situation where all three sources provide different answers. This is marked with a * because it belongs in different categories depending on whether the evaluation is for detection or correction. For detection, this is a TP because the system is flagging an error, even if it does not produce the correct answer according to the annotator or gold standard (essentially this reduces to X Y Y). From the TP, FP, FN, and TN counts, all the measures in Figure 2 can be calculated.2
As far as we are aware, evaluation has not previously been schematized as in Figure 4, and we recommend setting up one’s evaluation in such a way whenever possible. For the rest of the paper, we will assume TP, FP, FN, and TN as clarified by this scheme.
3.3 Traditional Metrics and the Problem of Skewed Data
At first glance, A (accuracy) seems to be the most straightforward and easily interpreted measure of system performance, but when the distribution of positive and negative classes is highly skewed, as is most often the case with writing errors, accuracy can be quite misleading. For example, Han et al. (2006) report a rate of usage errors of 13% for prepositions in a
2For error correction, X Y Z is both a FP (system6
corpus of English essays written by native speakers of Chinese, Japanese, and Russian. For that corpus, a baseline system that always predicts "no error" will have an A of 87%, reflecting the overwhelming proportion of negative cases. Similar or even greater levels of skew are commonly found in the error detection literature (Leacock et al., 2010). With high baselines such as these, it is often difficult to see, from a single summary measure such as A, just how a system is performing, especially on the non-majority class, in this case, the errors.
The metrics most frequently reported in NLP research are intended to address this problem. R compares the number of errors the System correctly detects (TP) to the total number of errors in the Annotated gold standard (TP+FN); P compares TP to the total number of errors that the System reports (TP+FP); and F1is the harmonic mean of R and P. Unfortunately, all three measures are affected by the proportion of cases that are annotated as errors in the gold standard (referred to as theprevalenceof the errors, which is equal to (TP+FN)/N, where N is the total number of cases, i.e., N=TP+TN+FP+FN) and by the proportion of cases that are reported by the System as errors (referred to as thebiasof the System, which is equal to (TP+FP)/N). Powers (2012) demonstrates how a system that performs no better than chance will nonetheless show an increase in R when prevalence increases and an increase in P when bias increases. To understand this behavior, we must consider what it means to perform at chance.
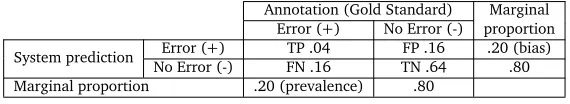
If the class labels Error and No Error are assigned to cases independently by the Annotator and the System, then these labels are expected to match a proportion of the time by chance alone -a proportion equ-al to the product of their prob-abilities. For ex-ample, the expected proportion of TP matches is equal to the product of the proportion of cases assigned the Error label by the Annotator (i.e., the prevalence) and the proportion of cases assigned the Error label by the System (i.e., the bias). This is illustrated in Figure 5, with the value in each cell of the table equal to the product of the marginal proportions in the cell’s row and column (e.g., expected proportion of TP=.20 x .20=.04; expected proportion of FP=.20 x .80=.16; etc.).
Annotation (Gold Standard) Marginal Error (+) No Error (-) proportion System prediction Error (+) TP .04 FP .16 .20 (bias)
[image:6.420.61.346.337.389.2]No Error (-) FN .16 TN .64 .80 Marginal proportion .20 (prevalence) .80
Figure 5: Performance of a hypothetical system with Accuracy=.68 and Kappa=.00
The A which is expected by chance, E(A), is .04+.64=.68, the sum of the expected proportions of TP and TN. Cohen’s kappa (κ) statistic (Cohen, 1960), shown in Figure 6, uses E(A) to correct the observed A found between Annotator and System. This provides a measure of performance over and above chance.
κ=A−E(A) 1−E(A)
Figure 6: Formula for Cohen’s kappa
expected to show agreement by chance alone, the System is correct (agrees with the Annotator) on 38% of the remaining cases.
[image:7.420.75.361.101.154.2]Annotation (Gold Standard) Marginal Error (+) No Error (-) proportion System prediction No Error (-)Error (+) TP .10FN .10 TN .70FP .10 .20 (bias).80 Marginal proportion .20 (prevalence) .80
Figure 7: Performance of a hypothetical system with Accuracy=.80 and Kappa=.38
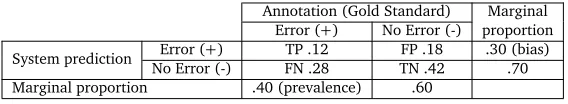
Now consider the hypothetical data in Figure 8, which show a system that is performing no better than expected by chance. Itsκof .00 is the same as theκof Figure 5, but the A values for the two sets of data are quite different, .68 vs. .54. This illustrates the earlier observation that A can be misleading as a measure of system performance, but A is not alone in this regard. R, P, and F1are also affected by changes in the marginal proportions.
Annotation (Gold Standard) Marginal Error (+) No Error (-) proportion System prediction No Error (-)Error (+) TP .12FN .28 TN .42FP .18 .30 (bias).70 Marginal proportion .40 (prevalence) .60
Figure 8: Performance of a hypothetical system with Accuracy=.54 and Kappa=.00
For the data in Figure 5, R is .04/(.04+.16)=.20, and P and F1also have values of .20. These differ from those of Figure 8, where R is .12/(.12+.28)=.30, P is .12/(.12+.18)=.40, and F1is .34. A comparison of the marginal proportions in the two figures shows that an increase in bias can be expected to increase R, while an increase in prevalence can be expected to increase P, even when systems are performing at chance levels. These are not desirable properties for system performance measures. As Powers (2012, p. 345) points out, "traditional evaluation measures used in Computational Linguistics (including Error Rates, Accuracy, Recall, Precision, and F-measure) are of limited value for unbiased evaluation of systems, and are not meaningful for comparison of algorithms unless both the dataset and algorithm parameters are strictly controlled for skew (Prevalence and Bias)".
[image:7.420.76.360.234.286.2]Because of sensitivity to bias, system evaluation is limited if it only examines performance at one setting of a threshold. By varying the threshold through the full range of values, P-R curves can be generated to give a better picture of performance. In a similar manner, other types of curves can be produced, such as the Receiver Operating Characteristic (ROC), which plots the true positive rate (TP/(TP+FN)) against the false positive rate (FP/(FP+TN)). Area under the ROC curve has been used for evaluating and ranking machine learning models (Bradley, 1997), but Kaymak et al. (2010) argue that the area under theκcurve (κplotted against the false positive rate) is superior to the area under the ROC curve because it accounts for skew in the data while the area under ROC does not.
Whileκhas advantages over R and P, it too has come under increased scrutiny. Although it properly takes changes in prevalence and bias into account,κis known to favor correct classifications of the minority class (for error detection, Errors) over those of the majority class (Non-errors). Kaymak, et al.(2010, p. 9) have argued that “this property of Kappa is actually a virtue for many real world classification problems in which it is more important to correctly classify the minority rather than the majority class.” Error detection is arguably such a problem. Another issue is that there are several kappa-like reliability measures which take chance agreement into account, but it is not clear which one or ones are best. For example, Krippendorff (2004) criticizes the use ofκfor measuring the reliability of annotators in content analysis because, for a given level of agreement, the value will actually increase when there are greater differences in the annotators’ preferences for using the various category labels. Krippendorff’s alpha measure is designed, in part, to address this problem. Recently, Powers (2012) has shown that in some situations, Cohen’s kappa is inferior to another kappa-like variant formed from a different combination of the values of the contingency table (Powers, 2003). Finally, despite its attractive features,κis not informative about system performance in the terms that an end user cares about because, as shown above, it does not reflect A, P, or R. This limits its value for decisions about whether a system is ready for use in real world applications.
3.4 Variety in Reporting Evaluation Measures
Recommendations It is clear that no single measure of performance is best for all purposes; each one has its own set of advantages and disadvantages. However, all of the measures, aside from BLEU and METEOR, are based on the same four values, the counts for TP, FP, FN, and TN. We recommend reporting these four in addition to any metrics derived from them. This will enable readers to calculate other measures that the authors of a particular paper did not choose to include (e.g., Matthews Correlation), and will provide the flexibility needed to accommodate new developments in evaluation as debates over how best to measure performance are resolved. In other words, it will make it possible for future readers to go back to any publications that report these four values and retrofit new measures to old data. We also recommendκ(and the κcurve) for its ability to take the skew of the class and the label distributions into account. When reporting P and R, prevalence and bias should also be reported. For a given test corpus, prevalence will be constant, but bias will vary when threshold values change, so bias should be represented, perhaps along the horizontal axis, in displaying P, R, and F1curves.
3.5 Positives
In error detection, the target, or positive, class consists of an error in the writer’s text. Defining a positive is complicated both by the variability in the unit size and scope of errors and by the variability in human judgments of errors.
3.5.1 Unit Size
Often there is no simple 1:1:1 correspondence between the writer’s erroneous string, the annotator’s correction, and the type of error the system was designed to detect. Looking back at (1a), for example,Bookmay be treated as an article error corrected by (1b), a number error corrected by (1c), or both an article error and a number error corrected by (1d). Each diagnosis has implications for how the error will be counted and mapped onto a correction.
Even when there is no ambiguity about the type of error, decisions must still be made about the size of the units over which the error is defined. In (2a), the noun-verb number disagreement involves two discontinuous substrings (e.g.,The book . . . inspire), either one of which could be changed to correct the error, as in (2b) and (2c). This highlights the question of what size of unit is most appropriate for measuring errors and corrections: is it the morpheme, the word, the phrase, or the string? In this case, a strictly token-based definition may identify only a single word as the error (eitherbookorinspire) or identify two separate errors, whereas a string-based definition can refer to both words as a single error.
(2) a. Thebookin my classinspireme. b. The book in my classinspiresme. c. Thebooksin my class inspire me.
Moreover, EDMs naturally handle multiple, overlapping errors, a problem for systems that target only a specific error type (Gamon, 2010; Rozovskaya and Roth, 2010a). Taking an example from Dahlmeier and Ng (2012), the sequence... development set similar with test set ...can be corrected as a preposition selection errorwith→toand an adjacent article omission errorε→
the, or it can also be corrected as a single error (with→to the). Because EDMs can calculate the best match between the system’s edits and those of the gold standard, they make it possible to define errors over multiple units, not just words but sequences of words as well.
Despite the benefits of basing metrics on edit distance, issues remain, depending upon the specific application of error detection or correction (see section 2). The selection of unit size is consequential for the specificity of feedback that a system can give to the writer. Ifbookand
inspireare not linked, for instance, it is harder to provide feedback on subject-verb agreement. Or ifwith→toandε→thereally are different error types, then feedback should deal with them separately. Focusing on matching the string, but not on how it was derived, works well when the task is to produce a final corrected string, but it comes with a cost for applications such as intelligent tutoring systems, where the goal is to determine which types of errors the writer has made.
Additionally, errors can be defined over multiple units, but are still constrained by what the base units are. Consider if the learner had writteninpirein (2a), thereby adding a misspelling on top of an agreement error. If the base units are words, then there is one correction to make, mappinginpiretoinspires, for what are clearly two distinct errors. Character-level edits would handle this particular problem, but are difficult to work with as soon as the error is on the level of the morpheme (e.g., the two-character, one-morpheme-es), the word, or the sentence. The issue is that errors are defined across types of linguistic units; some errors are morpheme-level, some phrase-level, and it is difficult to group them all together.3EDMs can only work from the smallest unit they define, and in general the units seem to be variable.
Finally, one benefit of EDMs is that they easily fit into calculations of P and R. However, by defining matches in terms of string distance, there is no way to talk about true negatives. Errors can be of variable sizes, but this means that the size of non-errors is, in a sense, undefined. Thus, alternative measures likeκcannot be calculated.
The issue of unit size becomes more complicated when error types interact. In (3), for instance, if a learner’s prepositioninshould be corrected toto, then the article can be dropped. If, however, the preposition is not changed, then dropping the article makes the sentence worse. This is because one correction leads to another, as noted by many doing error annotation (Boyd, 2010; Hana et al., 2010; Lee et al., 2012; Dickinson and Ledbetter, 2012). As far as we aware, no system evaluation accounts for this problem, and we do not solve it, either.
(3) Every day we go{in the school→to school}
Recommendations How one treats positives depends upon one’s purpose(s). If matching to a correct string and P/R are all that is required, EDMs have several excellent properties, including being able to account for errors of variable type and size (above the level of the base unit). If feedback is desired, EDMs are not a good choice because each error type must be taken into account separately (which is largely done in Dale and Narroway (2011)). EDMs should not
3While the typical base syntactic unit varies for different languages, e.g., morphemes for Hungarian (Dickinson and
be used if the goal is to control for skew in the data by calculating measures such asκ, which require counts of true negatives (see section 3.6).
3.5.2 Reliability: Clear-Cut vs. Contentious Errors
For some errors, such as the extraneous prepositiontoin (1a), the judgment is unequivocal, but for others, such as the writer’s choice to useofinstead of another preposition, judgments are likely to be contentious. Arguably, an error detection system which fails to marktoas an error is performing more poorly than one which fails to markof, but in current practice, all errors are generally assigned equal weight (though, see the “with bonus” correction in Dale and Narroway, 2012). Tetreault and Chodorow (2008a) examined some problems posed by disagreements in judgment. Using a cloze task, they asked two trained professional annotators to fill in a blank in well-formed sentences where a preposition had been removed. The results showed only 75% agreement on the prepositions that they filled in. When the same experts were asked to mark preposition usage errors in non-native writing, the system’s evaluation differed by as much as 10% in P depending on which expert’s annotations were used as the gold standard. Madnani et al. (2011) have argued that a better approach to system evaluation when errors are not clear-cut, as in preposition selection, is to treat them as graded and to assign them weights based on the distribution of judgments for each error obtained through crowdsourcing. Using this approach for system evaluation, if 80% of judgments for a case are Error and the system labels it as an Error, then the TP count is incremented by .80 and the FP count by .20. If, instead, the system outputs Non-error for this case, the FN count is incremented by .80 and the TN count by .20. Madnani et al. (2011) present weighted versions of the P and R formulas, and they argue that these measures are more stable than their unweighted counterparts, especially when test sets are small.
Recommendations For error types that are not judged with high reliability, authors should consider evaluation metrics based on weighted counts where the weights reflect the distributions of human judgments. The standard metrics otherwise apply.
3.6 Negatives
The non-target, or negative, class in error detection consists of the non-errors in the writer’s text. At first glance, this would simply seem to be the complement of the positive class. However, an appropriate set of non-errors for system evaluation is not that easily specified, even for errors of only a single token (see discussion in section 3.5 for variable-length errors). Consider the task of enumerating the article non-errors in (1a). No article should be inserted beforeof,my,
class,inspired,to,me, and the punctuation at the end of the sentence. Should all 7 of these positions be treated as negatives? Should only the noun phrases be counted? Most can be trivially ruled out as sites for articles (e.g.,*a my,*a me). Similarly, when detecting missing prepositions, as in (4), performance measures can be affected not just by the system’s ability to insert the proper preposition (of) in the correct position (afterfond) but also by how we count the positions where a preposition is not inserted by the system. In (4), are there four positions where prepositions were not inserted or are there zero positions?
Decisions of this sort have consequences for measures of system performance. When positions are included that can always be correctly identified as non-errors by trivial means, then the result will be an inflation in the count of TN, but no change in the other counts of the contingency table. This will not affect R, P, or F1, but it will cause both A andκto increase. This is illustrated in Figure 9 and Figure 10. Figure 9 is the same as Figure 5 except that the counts, based on an N of 100, have been included in the cells of the table. Figure 10 shows the effect of increasing the TN count by 100. This changes the proportions and, as a result, both A andκincrease.
[image:12.420.62.350.150.198.2]Annotation (Gold Standard) Marginal Error (+) No Error (-) proportion System prediction No Error (-)Error (+) FN 28(.28)TP 12(.12) TN 42(.42)FP 18(.18) .30 (bias).70 Marginal proportion .40 (prevalence) .60
Figure 9: Cell counts (proportions) of a hypothetical system: Accuracy=.54 and Kappa=.00
[image:12.420.64.347.231.282.2]Annotation (Gold Standard) marginal Error (+) No Error (-) proportion System prediction No Error (-)Error (+) TP 12(.06)FN 28(.14) TN 142(.71)FP 18(.09) .15 (bias).85 Marginal proportion .20 (prevalence) .80
Figure 10: Cell counts (proportions) of a hypothetical system: Accuracy=.77 and Kappa=.21
Recommendations When usingκor other measures that rely on true negatives, authors should be very explicit about what constructions or parts of speech were included in the negative class. If the TN count was based, in part, on a set of heuristics that identified obvious negative cases even before a statistical classifier was used, then the number of TNs identified in this way should also be reported so that the metrics can be adjusted appropriately.
Conclusion
Acknowledgments
References
Amaral, L. and Meurers, D. (2007). Conceptualizing student models for ICALL. InProceedings of the 11th International Conference on User Modeling, Corfu, Greece.
Attali, Y. and Burstein, J. (2006). Automated essay scoring with e-rater v.2. Journal of Technology, Learning, and Assessment, 4(3).
Boyd, A. (2010). EAGLE: an error-annotated corpus of beginning learner German. In
Proceedings of LREC-10, Malta.
Bradley, A. P. (1997). The use of the area under the ROC curve in the evaluation of machine learning algorithms.Pattern Recognition, 30:1145–1159.
Burstein, J., Chodorow, M., and Leacock, C. (2003). Criterion online essay evaluation: An application for automated evaluation of student essays. InProceedings of the Fifteenth Annual Conference on Innovative Applications of Artificial Intelligence.
Chodorow, M., Gamon, M., and Tetreault, J. (2010). The utility of article and preposition error correction systems for English language learners: Feedback and assessment.Language Testing, 27(3):419–436.
Cohen, J. (1960). A coefficient of agreement for nominal scales.Educational and Psychological Measurement, 20(1):37–46.
Dahlmeier, D. and Ng, H. T. (2011). Correcting semantic collocation errors with L1-induced paraphrases. InProceedings of the 2011 Conference on Empirical Methods in Natural Lan-guage Processing, pages 107–117, Edinburgh, Scotland, UK. Association for Computational Linguistics.
Dahlmeier, D. and Ng, H. T. (2012). Better evaluation for grammatical error correction. In
Proceedings of NAACL-HLT 2012.
Dale, R., Anisimoff, I., and Narroway, G. (2012). HOO 2012: A report on the preposition and determiner error correction shared task. InProceedings of the Seventh Workshop on Building Educational Applications Using NLP, pages 54–62, Montréal, Canada. Association for Computational Linguistics.
Dale, R. and Kilgarriff, A. (2010). Helping our own: Text massaging for computational linguistics as a new shared task. InInternational Conference on Natural Language Generation.
Dale, R. and Narroway, G. (2011). The HOO pilot data set: Notes on release 2.0. Technical report, Center for Language Technology, Macquarie University.
Dale, R. and Narroway, G. (2012). A framework for evaluating text correction. In Chair), N. C. C., Choukri, K., Declerck, T., Do˘gan, M. U., Maegaard, B., Mariani, J., Odijk, J., and Piperidis, S., editors,Proceedings of the Eight International Conference on Language Resources and Evaluation (LREC’12), Istanbul, Turkey. European Language Resources Association (ELRA).
Dickinson, M. and Ledbetter, S. (2012). Annotating errors in a Hungarian learner corpus. In
Proceedings of the 8th Language Resources and Evaluation Conference (LREC 2012), Istanbul, Turkey.
Gamon, M. (2010). Using mostly native data to correct errors in learners’ writing: A meta-classifier approach. InHuman Language Technologies: The 2010 Annual Conference of the North American Chapter of the Association for Computational Linguistics.
Gamon, M. (2011). High-order sequence modeling for language learner error detection. In
Proceedings of the 6th Workshop on Innovative Use of NLP for Building Educational Applications.
Han, N.-R., Chodorow, M., and Leacock, C. (2006). Detecting errors in English article usage by non-native speakers.Natural Language Engineering, 12(2):115–129.
Han, N.-R., Tetreault, J., Lee, S.-h., and Ha, J.-y. (2010). Using an error-annotated learner corpus to develop and ESL/EFL error correction system. InLanguage Resources and Evaluation Conference.
Hana, J., Rosen, A., Škodová, S., and Štindlová, B. (2010). Error-tagged learner corpus of Czech. InProceedings of the Fourth Linguistic Annotation Workshop, pages 11–19, Uppsala, Sweden.
Heift, T. and Schulze, M. (2007).Errors and Intelligence in Computer-Assisted Language Learning: Parsers and Pedagogues. Routledge.
Hirst, G. and Budanitsky, A. (2005). Correcting real-word spelling errors by restoring lexical cohesion.Natural Language Engineering, 11(1):87–111.
Israel, R., Tetreault, J., and Chodorow, M. (2012). Correcting comma errors in learner essays, and restoring commas in newswire text. InProceedings of NAACL-HLT 2012.
Kaymak, U., Ben-David, A., and Potharst, R. (2010). AUK: A simple altenative to the AUC. Technical report, Erasmus Institute of Management, Erasmus School of Economics, Rotterdam, NL.
Knight, K. and Chander, I. (1994). Automated postediting of documents. InProceedings of the Twelfth National Conference on Artificial Intelligence (AAAI), pages 779–784, Seattle.
Krippendorff, K. (2004). Reliability in content analysis. Human Communication Research, 30(3):411–433.
Kukich, K. (1992). Techniques for automatically correcting words in text.ACM Computing Surveys, 24(4):377–439.
Leacock, C., Chodorow, M., Gamon, M., and Tetreault, J. (2010).Automated Grammatical Error Detection for Language Learners. Synthesis Lectures on Human Language Technologies. Morgan Claypool.
Lee, S.-H., Dickinson, M., and Israel, R. (2012). Developing learner corpus annotation for Korean particle errors. InProceedings of the Sixth Linguistic Annotation Workshop (LAW VI), pages 129–133, Jeju, Republic of Korea.
Lonsdale, D. and Strong-Krause, D. (2003). Automated rating of ESL essays. InProceedings of the HLT-NAACL 03 Workshop on Building Educational Applications Using Natural Language Processing, pages 61–67.
Madnani, N., Tetreault, J., Chodorow, M., and Rozovskaya, A. (2011). They can help: Using crowdsourcing to improve the evaluation of grammatical error detection systems. In
Proceedings of the 49th Annual ACL Conference (Short Papers), Portland, USA.
Meurers, D. (2012). Natural language processing and language learning. In Chapelle, C. A., editor,Encyclopedia of Applied Linguistics. Blackwell. to appear.
Park, Y. A. and Levy, R. (2011). Automated whole sentence grammar correction using a noisy channel model. InProceedings of the 49th Annual Meeting of the Association for Computational Linguistics: Human Language Technologies - Volume 1, pages 934–944.
Parton, K., Tetreault, J., Madnani, N., and Chodorow, M. (2011). E-rating machine transla-tion. InProceedings of the Sixth Workshop on Statistical Machine Translation, pages 108–115, Edinburgh, Scotland. Association for Computational Linguistics.
Peng, J. and Araki, K. (2005). Correction of article errors in machine translation using web-based model. InIEEE NLP-KE, pages 393–397, Wuhan, China.
Powers, D. M. W. (2003). Recall and precision versus the Bookmaker. InProceedings of the International Conference on Cognitive Science, pages 529–534, Sydney, Australia.
Powers, D. M. W. (2012). The problem with kappa. InProceedings of the 13th Conference of the European Chapter of the Association for Computational Linguistics, pages 345–365, Avignon, France. Association for Computational Linguistics.
Rozovskaya, A. and Roth, D. (2010a). Annotating ESL errors: Challenges and rewards. In
Proceedings of the NAACL HLT 2010 Fifth Workshop on Innovative Use of NLP for Building Educational Applications.
Rozovskaya, A. and Roth, D. (2010b). Training paradigms for correcting errors in grammar and usage. InProceedings of HLT-NAACL-10.
Rozovskaya, A. and Roth, D. (2011). Algorithm selection and model adaptation for ESL correction tasks. InProceedings of ACL-2011.
Shieber, S. M. and Tao, X. (2003). Comma restoration using constituency information. In
Proceedings of the 2003 Human Language Technology Conference and Conference of the North American Chapter of the Association for Computational Linguistics.
Tetreault, J. and Chodorow, M. (2008b). The ups and downs of preposition error detection in ESL writing. InProceedings of COLING-08, Manchester.
Tetreault, J., Foster, J., and Chodorow, M. (2010). Using parse features for preposition selection and error detection. InProceedings of the ACL 2010 Conference Short Papers.