Proceedings of the Second ACL Workshop on Effective Tools and Methodologies for Teaching NLP and CL, pages 32–36,
Making Hidden Markov Models More Transparent
Nashira Richard Lincoln∗ and Marc Light†
∗†Linguistics Department
†School of Library and Information Science †Computer Science Department
University of Iowa Iowa, USA 52242
{nashira-lincoln, marc-light}@uiowa.edu
Abstract
Understanding the decoding algorithm for hidden Markov models is a difficult task for many students. A comprehensive un-derstanding is difficult to gain from static state transition diagrams and tables of ob-servation production probabilities. We have built a number of visualizations de-picting a hidden Markov model for part-of-speech tagging and the operation of the Viterbi algorithm. The visualizations are designed to help students grasp the oper-ation of the HMM. In addition, we have found that the displays are useful as de-bugging tools for experienced researchers.
1 Introduction
Hidden Markov Models (HMMs) are an important part of the natural language processing toolkit and are often one of the first stochastic generation mod-els that students1 encounter. The corresponding Viterbi algorithm is also often the first example of dynamic programming that students encounter. Thus, HMMs provide an opportunity to start stu-dents on the correct path of understanding stochas-tic models, not simply treating them as black boxes. Unfortunately, static state transition diagrams, ta-bles of probability values, and lattice diagrams are not enough for many students. They have a general idea of how a HMM works but often have common
1
The Introduction to Computational Linguistics course at the University of Iowa has no prerequisites, and over half the students are not CS majors.
misconceptions. For example, we have found that students often believe that as the Viterbi algorithm calculates joint state sequence observation sequence probabilities, the best state sequence so far is always a prefix of global best path. This is of course false. Working a long example to show this is very tedious and thus text books seldom provide such examples.
Even for practitioners, HMMs are often opaque in that the cause of a mis-tagging error is often left uncharacterized. A display would be helpful to pin-point why an HMM chose an incorrect state se-quence instead of the correct one.
Below we describe two displays that attempt to remedy the above mentioned problems and we dis-cuss a Java implementation of these displays in the context of a part-of-speech tagging HMM (Kupiec, 1992). The system is freely available and has an XML model specification that allows models calcu-lated by other methods to be viewed. (A standard maximum likelihood estimation was implemented and can be used to create models from tagged data. A model is also provided.)
2 Displays
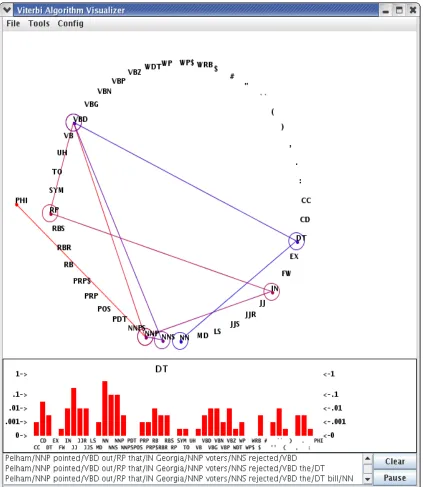
Figure 1 shows a snapshot of our first display. It contains three kinds of information: most likely path for input, transition probabilities, and history of most likely prefixes for each observation index in the Viterbi lattice. The user can input text at the bottom of the display, e.g., Pelham pointed out that
Geor-gia voters rejected the bill. The system then runs
sequence from left to right (these are lines connect-ing the states in Figure 1). At any point, the stu-dent can mouse-over a state to see probabilities for transitions out of that state (this is the bar graph in Figure 1). Finally, the history of most likely pre-fixes is displayed (this history appears below the bar graph in Figure 1). We mentioned that students often falsely believe that the most likely prefix is extended monotonically. By seeing the path through the states reconfigure itself in the middle of the observation se-quence and by looking at the prefix history, a student has a good chance of dispelling the false belief of monotonicity.
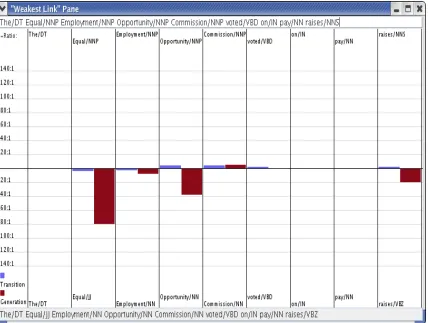
The second display allows the user to contrast two state sequences for the same observation sequence. See Figure 2. For each contrasting state pairs, it shows the ratio of the corresponding transition to each state and it shows the ratio of the generation of the observation conditioned on each state. For exam-ple, in Figure 2 the transition DT→JJ is less likely than DT→NNP. The real culprit is generation proba-bility P(Equal|JJ) which is almost 7 times larger than P(Equal|NNP). Later in the sequence we see a simi-lar problem with generating opportunity from a NNP state. These generation probabilities seem to drown out any gains made by the likelihood of NNP runs.
To use this display, the user types in a sentence in the box above the graph and presses enter. The HMM is used to tag the input. The user then modi-fies (e.g., corrects) the tag sequence and presses en-ter and the ratio bars then appear.
Let us consider another example: in Figure 2, the mis-tagging of raises as a verb instead of a noun at the end of the sentence. The display shows us that although NN→NNS is more likely than NN→VBZ, the generation probability for raises as a verb is over twice as high as a noun. (If this pattern of mis-taggings caused by high generation probabil-ity ratios was found repeatedly, we might consider
and Martin, 2000). A model was trained using Maximum Likelihood from the UPenn Treebank (Marcus et al., 1993). The input model file is encoded using XML and thus models built by other systems can be read in and displayed.
The system is implemented in Java and requires 1.4 or higher to run. It has been tested on Linux and Apple operating systems. We will release it under a standard open source license.
4 Summary and future work
Students (and researchers) need to understand HMMs. We have built a display that allow users to probe different aspects of an HMM and watch Viterbi in action. In addition, our system provides a display that allows users to contrast state sequence probabilities. To drive these displays, we have built a standard HMM system including parameter esti-mating and decoding and provide a part-of-speech model trained on UPenn Treebank data. The system can also read in models constructed by other sys-tems.
References
Jason Eisner. 2002. An interactive spreadsheet for teach-ing the forward-backward algorithm. In Proc. of the
ACL 2002 Workshop on effective tools and method-ologies for teaching natural language processing and computational linguistics.
Daniel Jurafsky and James H. Martin. 2000. Speech and
Language Processing: an introduction to natural lan-guage processing, and computational linguistics, and speech recognition. Prentice-Hall.
J. Kupiec. 1992. Robust part-of-speech tagging using a hidden markov model. Computer Speech and
Lan-guage, 6:225–242.