ABSTRACT
MOODY, BENJAMIN. Exploring New Detection Schemes for Molecular Detection,
Nucleic Aacid Research, and the Study of In Situ Cellular Chemistry. (Under the direction of Gregory S. McCarty).
In complex and dynamic environments such as biological systems, new detection schemes that are quick, inexpensive, and non-invasive are necessary to provide analyses with high quality data. To this end, the research presented here is focused on exploring new detection schemes for molecular detection, nucleic acid research, and the study of in situ cellular chemistry. This research investigates the use of surface enhanced Raman spectroscopy (SERS) as the primary detection technique, starting first with experiments designed to broaden and improve the application of SERS within biomedical settings and then applying SERS to further the fundamental understanding of relevant biomedical topics such as DNA mutation and stem cell differentiation.
The first set of experiments to be discussed involves a methodology to produce solid state nanogap electrodes. In Chapter 2 a combination of oligonucleotide-based molecular lithography and traditional photolithography is used to create finely tunable nanogap electrodes and to explore the fabrication of Raman enhancing substrates. Solid state
using two detection schemes, one optical (SERS) and one electronic (current-voltage responses). Using the strong Raman enhancements created by the nanogap, Raman spectra and current voltage traces show that the oligonucleotides used as the molecular resist are degraded during processing, that some of the degraded oligonucleotides are removed, and that fresh oligonucleotides are adsorbed.
Next, a methodology is explored to enable the collection of statistically significant SERS data using single nucleotide polymorphisms as a model system. We report a method of using surface enhanced Raman spectroscopy to probe single stranded DNA for genetic markers. Single-stranded oligonucleotides functionalized with gold nanoparticles are hybridized with oligonucleotides adsorbed to photolithographically defined gold surfaces thus creating a surface enhanced Raman environment around the DNA duplex. With this design
characteristic Raman spectra are analyzed for differences between DNA duplexes formed from complementary oligonucleotides, completely mismatched oligonucleotides, and those formed from oligonucleotides that have a mid-sequence single nucleotide mismatch. The results show that statistically significant differences in Raman intensity for characteristic peaks can be collected for the three cases. This method is then improved upon by analyzing
three different types of polymorphism can be differentiated using statistically significant peak position differences and trends regarding Raman intensity.
Exploring New Detection Schemes for Molecular Detection, Nucleic Acid Research, and the Study of In Situ Cellular Chemistry
by
Benjamin Patrick Moody
A thesis submitted to the Graduate Faculty of North Carolina State University
in partial fulfillment of the requirements for the degree of
Doctor of Philosophy
Biomedical Engineering
Raleigh, North Carolina 2010
APPROVED BY:
_______________________________ ______________________________ Gregory S. McCarty (Committee Chair) Michael P. Gamcsik
________________________________ ________________________________
Elizabeth G. Loboa Glenn Walker
ii
Biography
Benjamin Moody graduated from Virginia Tech with a BS in Chemical Engineering and a minor in chemistry. After working for several years in the pharmaceutical industry he
iii
Acknowledgements
I would like to gratefully acknowledge:
Dr. Gregory S. McCarty Charles Jones
Dr. Elizabeth Loboa Elizabeth Moody
Dr. Glenn Walker Matthew K. Zachek
Dr. Paul Wollenzien James Roberts
Dr. Michael P. Gamcsik Dr. Leslie Sombers Dr. Carla M. Haslauer Dr. Adrian O’neill
Dr. Wayne Pfieler Jeff Soohoo
Dr. Seth McCullen Linda Simmerson
Dr. Dale Bachelor Nancy McKinney
J.B. Clark Brian Gonzalez
Amy McPherson Andrew Brna
Stefan Ufer Rekha Balasubramanyam
Dr. Susan Bernacki Stephanie Gootnick
Ariel Hanson Richard Green
Joanna Stocking Chuck Mooney
John Leotaud Valerie Knowlton
NC State Analytical Instrumentation Facility NC State Center for Electron Microscopy North Carolina State University College of
iv
Table of Contents
List of Tables ... vii
List of Figures ... viii
Chapter 1: Introduction ... 1
1.1 Raman spectroscopy and SERS ... 2
1.1.1 Basic physics ... 2
1.1.2 Competing spectroscopies. ... 2
1.1.3 Surface enhanced Raman spectroscopy. ... 4
1.2 Single Nucleotide Polymorphisms ... 6
1.2.1 Background. ... 6
1.2.2 Detection. ... 7
1.3 Cell Monitoring ... 9
1.4 Objectives ... 10
1.4.1 Fabricating Raman enhancing solid-state nanogap sensors. ... 11
1.4.2 Detecting and evaluating mid-sequence SNPs... 12
1.4.3 Developing real-time cell monitoring systems ... 13
1.5 Dissertation Findings ... 14
Chapter 2: Solid State Nanogaps for Differential Measurements of Molecular Properties ... 17
2.1 Introduction ... 18
2.2 Materials and Methods ... 20
2.2.1 Electrodes/Nanogap fabrication. ... 20
2.2.2 Raman Spectroscopy ... 21
2.3 Results and Discussion ... 23
2.4 Conclusion ... 28
Chapter 3: Statistically Significant Raman Detection of Mid-Sequence Single Nucleotide Polymorphisms ... 29
3.1 Introduction ... 30
3.2 Materials and Methods ... 33
3.2.1. Substrate Preparation 1 ... 34
3.2.2 Oligo Preparation 1 (Capture Strands). ... 34
3.2.3 Substrate Preparation 2 ... 35
3.2.4 Oligo Preparation 2 (Target Strands). ... 35
3.2.5 Hybridization ... 36
3.2.6 Raman Detection ... 36
3.3 Results and Discussion ... 39
v
Chapter 4: Using Surface Enhanced Raman Spectroscopy to Probe for Genetic Markers on
Single Stranded DNA ... 44
4.1 Introduction ... 45
4.2 Materials and Methods ... 48
4.2.1 Substrate Preparation 1 ... 48
4.2.2 Oligo Preparation 1 (Capture Strands). ... 49
4.2.3 Substrate Preparation 2 ... 52
4.2.4 Oligo Preparation 2 (Target Strands). ... 52
4.2.5 Oligo Preparation 3 (Test Strands). ... 53
4.2.6 Hybridization. ... 53
4.2.7 Raman Detection. ... 54
4.2.8 Statistical Analysis ... 54
4.3 Results ... 55
4.4 Discussion ... 61
4.5 Conclusions ... 66
Chapter 5: In Situ Monitoring of Adipogenesis with Human Adipose Derived Stem Cells Using Surface Enhanced Raman Spectroscopy ... 67
5.1 Introduction ... 69
5.2 Methods and Materials ... 71
5.2.1 Cell Culture. ... 71
5.2.2 Raman Detection ... 71
5.2.3 Data Processing ... 73
5.3 Results ... 74
5.4 Discussion ... 82
5.5 Conclusions ... 88
Chapter 6: Future Directions ... 89
6.1 Investigation of the SERS Effect ... 89
6.2 Single-Cell SERS Analyses ... 91
6.3 Multidimensional Analysis of SERS Data ... 99
6.4 Intracellular SERS Targeting using Antibodies ... 106
Chapter 7: Conclusions ... 111
References ... 114
Appendix ... 124
A. Soft Lithography Protocol ... 125
vi
B.1. Photresist Application ... 129
B.2. CANON 501 With Alignment Procedure ... 132
B.3. Photresist Development ... 138
vii
List of Tables
Table 3.1: Oligonucleotide Design for A-G and C-T Oligo Sequences ... 39
Table 4.1: Oligonucleotide Design for Matched and Mismatched Sequences ... 51
Table 4.2: Two-tail p-values from t-test results used to test the significance of intensity differences among selected peaks. Asterisks represent corresponding significance level. ... 57
Table 4.3: Two-tail p-values from t-test results used to test the significance of peak position differences among selected peaks. Asterisks represent corresponding significance level. ... 60
Table 5.1: Raman shift assignments and interpretations of Raman shifts observed in human adipose derived adult stem cells before, during, and after adipogenic differentiation. ... 77
Table 6.3.1: Sample type classification accuracy of the four-group PCA-LDA model as assessed by a leave-one-out cross-validation. The seven median spectra from each sample type were baseline subtracted prior to PCA-LDA analysis. ... 100
Table 6.3.2: Leave-one-out LDA cross validation sensitivities for classifying all 31 spectra from each sample group. Spectra were baseline subtracted and normalized prior to LDA analysis. ... 101
Table B.1: Positive Photoresist Application Specifications ... 127
Table B.2: Negative Photoresist Application Specifications ... 128
viii
List of Figures
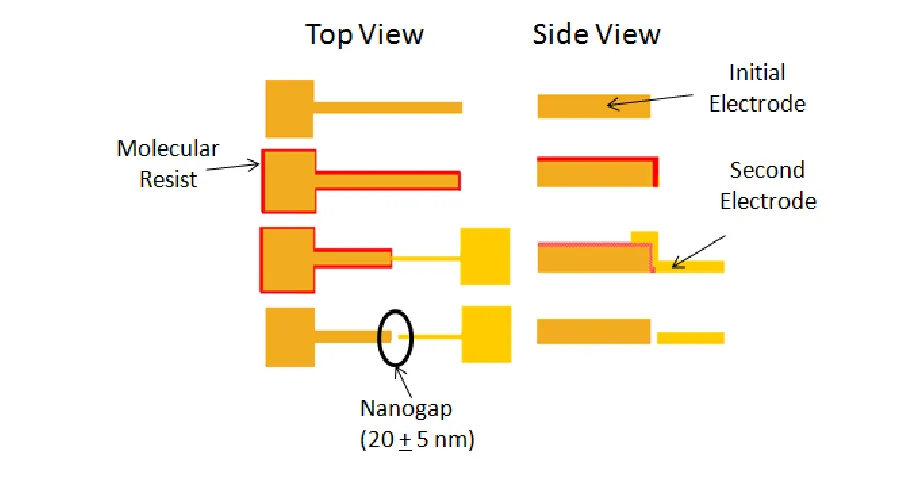
Figure 2.1: Schematic showing the process of hybrid molecular lithography. ... 20 Figure 2.2: Raman signal from a nanogap created using single-stranded oligonucleotides as a molecular resist in the structure’s fabrication. Figure 1a shows a portion of the Raman spectra collected at the electrode interface as fabricated, after a dodecanethiol (DDT) substitution, and then after thiol functionalized oligonucleotides (Oligos) were added to the solid state nanogap. Figures 2.1b and 2.1c are the spectra that result from subtracting the As Fabricated trace from the Dodecanethiol trace and from subtracting the Dodecanethiol trace from the Oligonucleotide trace, respectively. These latter spectra are used to highlight the change in condition between two states. ... 24 Figure 2.3: Current – voltage characteristics for the electrode as fabricated, after the
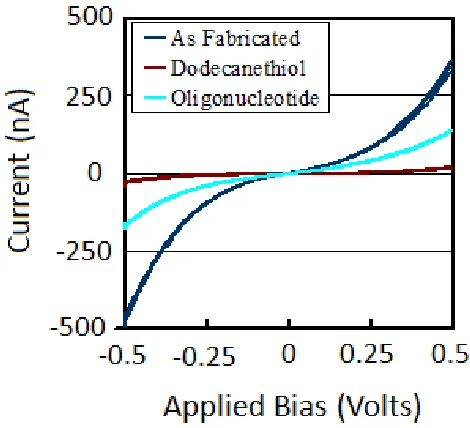
dodecanethiol substitution, and then again after the final oligonucleotide addition. The electrode conducted 350 nA as fabricated, 18 nA after the alkane substitution, and 130 nA after the oligo substitution, all at +0.5 V of applied bias. ... 25 Figure 3.1: Visualization of the hybridization scheme used to create a SERS environment around DNA duplexes. ... 34 Figure 3.2: Raman spectra comparing the averaged median intensities of single-stranded oligos (matched, mismatched, and single-mismatched) hybridized to form double-stranded duplexes using the a) C-T and b) A-G sequences. Standard error bars are included for key peaks along with asterisks that indicate the level of statistical difference. ... 42 Figure 4.1: Visualization of the hybridization scheme used to create a SERS environment around DNA duplexes. Single stranded oligos are hybridized as either completely matched, with a single mismatch (SNP), with an adjacent triple mismatch (ATM), or with a
ix
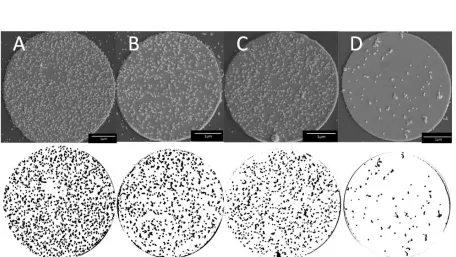
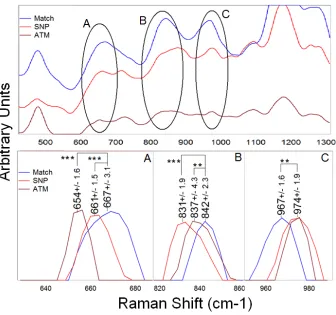
analysis of the nanoparticle densities that results from hybridizing with (A) completely matched, (B) SNP, (C) triple mismatched, and (D) completely mismatched test strands. ... 57 Figure 4.4: Raman spectra highlighting the peak position shifts that occur when comparing the average matched sample to the SNP and ATM samples. The DTM sample followed in trend with the other mismatched samples and was therefore excluded for clarity. The
highlighted peaks represent (A) down-shifting guanine ring breathing and (B) phosphodiester stretch modes, and (C) an up-shifting guanine/sugar stretch. Peak positions are shown with their respective standard errors representing the variability between the seven median spectra averaged together to obtain these positions. Levels of significant difference are compared to the matched sample. Constituent peak intensities were baseline subtracted and normalized to the peak of interest before averaging then smoothed. (see Table 4.3 for p-values) ... 59
Figure 5.1: Transmission electron micrographs of colloidal gold nanoparticles aggregated within differentiating hASCs. Nanoparticles are 40 nm in diameter. ... 74 Figure 5.2: Representative surface-enhanced Raman spectra of undifferentiated hASCs measured 2 (blue), 6 (black), 8 (red), and 44 (green) days after seeding. Spectra are smoothed and normalized to the ubiquitous 1328 cm-1 protein peak1-3 and offset for
comparison. ... 75 Figure 5.3: Representative surface-enhanced Raman spectra measured from hASCs at
various time points during adipogenic differentiation. Samples were analyzed shortly after the addition of differentiation medium at (a) 1 and (b) 2 days then at intermediate time points between (c) 6 and 20 days and then finally at (d) 22 days. The variety of peak positions indicates the complex chemical changes that occur during differentiation. Spectra are smoothed and normalized to the ubiquitous 1328 cm-1 protein peak1-3 and offset for
comparison. ... 77 Figure 5.4: Raman spectra showing an average of the five fully differentiated adipocyte spectra from Figure 5.3d compared to an average of the four undifferentiated stem cell spectra in Figure 5.2. The figure highlights the spectral similarities and differences that are common between undifferentiated and differentiated stem cells. ... 79
x
Figure 6.2.2: Raman spectra taken from a living hADAS cell at four different locations. Figure shows the DNA characteristic spectrum visible at the nucleus as compared to the lipid/protein spectra taken elsewhere. ... 95 Figure 6.3.1: PCA scores of each sample type as plotted against the first and second
principle components. Each data point represents one of the seven median spectra as
discussed in Chapter 4. Data was baseline corrected prior to PCA. ... 100 Figure 6.3.2: PCA scores of a) ATM and DTM sample types and of b) ATM, DTM, and SNP as plotted against the first and second principle components. The figure shows the similarities shared by the mismatched samples in general and contrasts the differences between the triple mismatched samples. Prior to PCA the data was baseline corrected and normalized to limit intensity variations thus highlighting variation between characteristic peaks. ... 103 Figure 6.3.3: PCA scores of the matched samples as compared to the a) SNP, b) DTM, and c) ATM as plotted against the first and second principle components. Despite sharing expected similarities, the PCA groupings in this figure show how generally distinguishable the matched samples are from samples with polymorphisms. Prior to PCA the data was baseline corrected and normalized to limit intensity variations thus highlighting variation between characteristic peaks. ... 104 Figure 6.4.1: Raman spectra comparing the averaged Raman intensities of undifferentiated hASCs (blue) as compared to those that have been exposed to adipogenic differentiation medium for 1 day (green) and 22 days (red). The figure highlights the intensity reduction that is observed on average as the cell cultures differentiate. Spectra have been smoothed and baseline corrected. ... 107 Figure 6.4.2: Raman spectra comparing the normalized average Raman intensities of
undifferentiated hASCs (blue) as compared to those that have been exposed to adipogenic differentiation medium for 1 day (green) and 22 days (red). The figure highlights spectral similarities shared between the three groups. Spectra have also been smoothed and baseline corrected. ... 108 Figure A1: Schematic outlining the four steps used to create a master wafer for soft
1
Chapter 1: Introduction
The basis of scientific learning is the analytical experiment just as the basis of any experiment is detection. In the intersecting disciplines of biology, biochemistry, chemistry and biomedicine there have long been clever detection techniques capable of eliciting exciting and important information. However, as scientific disciplines evolve, so must the experiments and the detection techniques in which they are rooted. To this end, my research is focused on exploring new detection schemes for molecular detection, nucleic acid
research, and the study of in situ cellular chemistry. Using a unique combination of tools and skillsets the intent of my recent research has been to improve the quality and depth of the detection and analysis techniques currently available in chemistry, biology, and biomedicine. Under the support and guidance of my advisor, Dr. Gregory S. McCarty, our lab has custom built a modular Raman microscope for use as a multipurpose chemical analyses platform around which we have conducted biomedical research involving nanolithography, surface enhanced Raman spectroscopy (SERS), genetic polymorphisms, adipogenesis, and stem cell differentiation. In addition, surface modification techniques using self-assembling
2
our main efforts are 1) to improve upon the scope of existing analytical techniques and 2) to further explore relevant fundamental questions in biology, chemistry, and physics.
1.1 Raman spectroscopy and SERS
1.1.1 Basic physics. The evolution of Raman spectroscopy from its conception in 1928 to its current state is a story whose scope far exceeds the limits of this document. While the curious reader can find excellent material on Raman’s history, applications, and recent advances,6-8 for the more casual reader it will suffice to say that Raman spectroscopy has over time become a valuable tool in the scientist’s tool belt. Today it is widely known to be inexpensive, relatively fast, and non-invasive with good detection sensitivity. In brief, the Raman effect is described as an inelastic scattering of light that occurs when an appropriately powerful monochromatic light source interacts with matter. For the purposes of our research, the scheme is essentially to reflect a single wavelength laser off a sample of interest and then to analyze the reflected light for any deviations in wavelength. Wavelength deviations are characteristic of different molecular functional groups and can thus be correlated to the chemical composition of the material the laser illuminates.
3
analysis, a relative insensitivity to water, and the potential for the extreme spectroscopic enhancements. Raman is generally considered more powerful than IR spectroscopy but less destructive than UV-vis for chemical analyses. Nevertheless, it has been estimated that only one in a million photons undergo Raman scattering resulting in a relatively weak signal that has historically been difficult to detect. Therefore Raman has yet to find as broad an
audience as competing optical techniques.
In medicine, for example, both intrinsic and extrinsic fluorophores have been used to study cellular and tissue changes that can result from cancer, atherosclerosis, miscellaneous oxidative events, or tooth decay.9 Fluorescence spectroscopy has also been used to great avail in genotyping, DNA sequencing, and single nucleotide polymorphism (SNP) detection.10, 11
However, a great deal of interest in Raman spectroscopy is due to its unique
advantages as compared to other optical techniques. For example, there is a greater number of Raman dyes or labels than fluorescent labels and multiplexing among Raman dyes is generally easier on account of the sharper, more distinct spectral signature Raman dyes exhibit.12 Secondly, unlike most Raman dyes, fluorophores can be subject to
4
1.1.3 Surface enhanced Raman spectroscopy. Also, with improvements in lasers, bandpass and notch filters, and in light detectors in general, Raman spectroscopy is gaining in popularity and usefulness. Another significant advancement worth noting is the advent of surface enhanced Raman spectroscopy (SERS). SERS is a spectroscopic technique that amplifies and improves Raman signal within a very localized vicinity, generally around two closely spaced metal structures of varying size and design. While it is not definitively known exactly why or how this works, there are two well accepted models for explaining this
enhancement of Raman activity, the electromagnetic model and the chemical or charge transfer model; and one emerging model, the dipole-quadrupole theory of Raman
enhancement. The electromagnetic and charge transfer models have been discussed in the scientific literature since the discovery of SERS (~1974). Essentially the two models
5
been published studying simple molecules adsorbed to metal atoms both experimentally and theoretically with DFT. A few references are included for completeness.16-20
The difficulty that frequently arises with SERS is creating substrates that have large and very uniform enhancement factors. Ideally SERS substrates should be efficiently fabricated on the wafer-size scale and will consist of small metallic structures with uniform spacing from a few hundred nanometers to just a few nanometers. More routinely, however, SERS substrates are subject to local unpredictable “hot spots” of enhancement and require advanced nanolithographic patterning to prepare.21-23 Hot-spots are caused by areas of varying Raman enhancement on the substrate. This variable enhancement can lead to large sample-to-sample variations in Raman intensity and can result in data that is uncharacteristic of the system under study.24 In addition to hot-spots, possibly large variations are frequently caused by other small differences in the substrate, non-specific binding, and random
intermolecular interactions of the SERS features. As a result, variability can easily defeat attempts at obtaining statistically significant data for differentiation studies and because of this, Raman spectroscopy and SERS data are have become notorious for being difficult to interpret.
6
focus on the SERS effect generated through the use of one of two techniques – closely packed gold nanoparticles and solid state nanogaps – both of which have previously been used to amplify Raman signal.25-28 We have chosen to use nanoparticles and solid state nanogaps because the spacing of both can be tailor-made with nanometer precision in attempts to specify the exact SERS effect.
1.2 Single Nucleotide Polymorphisms
1.2.1 Background. Deoxyribonucleic acid (DNA) mutations can be caused by exposure to either environmental mutagens or to internal physiological mutagens. More commonly they occur when an error in DNA replication or repair causes a single base in the DNA to spontaneously be deleted, inserted, or substituted.29 Subsequently, a nucleotide mismatch is when non-complementary bases are left to align for Watson-Crick pairing. If the most frequent nucleotide in a single base of DNA is replaced by another nucleotide with a frequency greater than 1%,29 the mutation is specifically classified as a single-nucleotide polymorphism (SNP).30 Similarly, regions within a gene that has several of these
“rearrangements” can generally be called a polymorphic region (PR).31 A cluster of SNPs or a cluster of deletions within a gene are examples of polymorphic regions.32
On a molecular level, polymorphisms can lead to inappropriate amino-acid substitutions in proteins that alter the proteins’ function.33 This has the potential of
7
Studies suggest that SNPs account for 90% of polymorphisms29 in the human genome. In fact, an SNP database started by the National Center for Biotechnology Information in 1998 contained over 4 million human SNPs by 2005.34 SNPs have been associated with breast, lung, head, and neck cancers among others35 and as genetic markers SNPs are being used for mapping conditions as diverse as diabetes, multiple sclerosis, and obesity.30 On the other hand, some SNPs are being researched for their beneficial roles in reducing disease susceptibilities and for the possibility of being used as a marker forimproved drug reactions.29
1.2.2 Detection. Currently, there is a plethora of different schemes used in SNP and PR detection,36 though each generally relies on some combination of a smaller subset of discrimination and detection methods. For example, a standard high throughput rubric for SNP detection takes advantage of microarray technology, fluorescent tags, and the
hybridization differences that occur between complementary oligonucleotides and those with nucleotide polymorphisms. One such method might hybridize oligo/fluorescent dye
complexes with oligo/fluorescent quenching complexes. In this fashion the fluorescent tag remains quenched until the complex is somehow separated, usually through stringent washes. Because de-hybridization will occur under lower stringency for imperfectly hybridized
8
quencher.10, 37 Integrating microarrays into such a setup allows the analysis of thousands of samples per day.10 Even moderately large sized eukaryotic genomes can now be explored for SNPs using oligonucleotide assays.32
Other methods may use enzymes like DNA polymerases, DNA ligases, or the flap endonuclease to discriminate between normal and mismatched samples. Some systems forgo fluorescence-based optical detection for mass spectrometry.10 A few currently available commercial systems include GeneChip, Masscode, Invader, and SNapShot. Whatever the system though, the main two steps remain – 1) differentiate between perfectly complementary and SNP samples and 2) detect that there is a difference.
On a less immediately commercial scale, recent innovations using DNA
functionalized with gold nanoparticles has been shown to quickly detect terminal mismatches in DNA with a simple color change.38 In 2004 it was noted that single stranded DNA oligos can be functionalized in separate solutions of gold nanoparticles, which have an inherent pink color. When the nanoparticle solutions of DNA with mismatched terminal bases are mixed, the gold nanoparticles precipitate and the solution loses its pink color. Unfortunately
researchers were not able to use this technique with mismatched bases closer to the middle of the sequence.38
9
a sensitive optical detection technique that can be combined with aspects of nanotechnology to provide even greater utility.27 Functionalizing DNA with gold nanoparticles opens several avenues of pure DNA analysis and subsequent gene detection methodologies. Sun et al. have developed a way to detect breast cancer genes using the hybridization of sample DNA with probing DNA that has been modified with gold nanoparticles and specific Raman labels. Using this technique, Sun et al. were able to achieve detection sensitivities of down to 1 fM.27 While much progress is being made,24, 39, 40 much has yet to be done to couple Raman
techniques to the detection of SNPs.
1.3 Cell Monitoring
10
Raman spectroscopy has had a small though useful place in modern biological research since early protein experiments in 1970.7, 41 It is generally considered non-invasive, has the potential for continuously collecting data in real-time, and provides multiplexed chemical information that can be used to simultaneously explore covariant chemical
relationships in complex environments. To date, Raman has been used to study bacteria,42, 43 viruses,44 cancer,2, 27, 45, 46 brain tissue,3 cell cycle dynamics,47-49 embryonic stem cells,50, 51 and DNA hybridization52 though many of these experiments still involve invasive sample preparations. The non-invasive attributes of Raman spectroscopy, on the other hand, make it uniquely useful for monitoring cells as they undergoes a variety of transitions including growth, stress, differentiation, and death. Researchers have used Raman to study the biochemical changes of cells in different phases of the growth cycle47 and to discriminate between healthy and tumor bone cells,53 breast tissues,2 and skin cells.54 Other research has used Raman to explore Parkinsons’ effects on brain tissues 3, 50 and to follow differentiation in Murine embryonic stem cells.50, 55 More recent studies show that Raman can be used to monitor the in situ production of mineral matrix as mesenchymal stem cells (MSCs) differentiated into osteoblasts.56, 57
1.4 Objectives
Given these strengths and an overall refinement of optical technology, Raman
11
the exploration of some of biology and biomedicine’s most pressing questions. This
document presents a summary of my doctoral research. It discusses three specific objectives: 1) using molecular lithography to create enhanced spectroscopic substrates, 2) using surface enhanced Raman spectroscopy to detect single nucleotide polymorphisms and other genetic aberrations, and 3) using Raman spectroscopy to explore cellular chemistry – namely the chemical changes that occur as a human stem cell undergoes adipogenic differentiation.
1.4.1 Fabricating Raman enhancing solid-state nanogap sensors. In this objective, we use a combination of oligonucleotide-based molecular lithography and traditional photolithography to create finely tunable nanogap electrodes – planar electrodes with separations of just a few nanometers. Briefly, solid state nanogaps are created using a
combination of conventional photolithography and a molecular lithography process similar to those already published.58, 59 However, in this study the molecular resists is created with single-stranded oligonucleotides (oligos) and enables rapid production of 10-30 nanometer separations between metallic features. Because oligos can be prepared quite inexpensively and tailored to many different sequences and sizes, an oligo molecular resist can be used to closely control the gap size (ie, the distance between conductors) from a few nanometers to several tens of nanometers. Solid state nanogaps represent an immediately relevant
12
These structures are invaluable for investigating molecular electronic candidates, for
researching biological systems, and as a substrate for Raman spectroscopic studies. Here, as a proof of concept, the local molecular environment of the nanogap is monitored using Raman spectroscopy and current-voltage traces. The strong Raman enhancements created within the nanogap enabled spectroscopic detection of the addition, subtraction, and degradation of oligos within the nanogap.
1.4.2 Detecting and evaluating mid-sequence SNPs. In this objective we report that gold nanoparticles can be used in deoxyribonucleic acid (DNA) hybridization experiments to create a SERS environment around DNA of interest. With this set-up we are able to
differentiate between DNA duplexes with and without mid-sequence base mismatches. The hybridized gold particles create a separation that is nominally controlled by the length of the oligos; typically moderate sized oligos are between 10 and 20 nm in length.60 This fast and sensitive technique sidesteps the need for expensive polymerase chain reaction (PCR) or mass spectrometry based techniques and can be run with microfluidic devices or in array formats. Such an advance could make single nucleotide polymorphism (SNP) detection assays much more cost-effective, allowing for greater availability of research into cancer sub-typing, genetic disease mapping, and SNP-genotyping.
13
analysis rubric we have created facilitate the collection of statistically significant Raman data with a dramatically decreased degree of operator bias and the aberrant effects of Raman’s usual heavy variability. The long-term benefit of such a system lies not only with its initial applications of manual detection but also with its enormous potential for automation and subsequent applications as previously mentioned.
1.4.3 Developing real-time cell monitoring systems. In this objective, human adipose derived adult stem (hADAS) cells are dosed with Au nanoparticles with the goal of providing information and insights into the progression of stem cells through an adipogenic
differentiation pathway. HADAS cells are provided through an unfunded collaboration with Professor E. Loboa of the NC State/UNC Joint Department of Biomedical Engineering.
In addition to standard technological advances that have slowly been improving Raman capabilities, intracellular Raman work has been recently aided by the use of gold nanoparticles. Living cells naturally uptake gold nanoparticles in the fluid phase and transport these particles through an endosomal pathway. Once inside the endosome,
14
create volumes of surface-enhanced Raman scattering (SERS) within living hASCs enabling molecular information to be monitored. We exploit this technique to spectroscopically observe chemical changes that occur during the adipogenic differentiation of human adipose derived stem cells over a period of 22 days, monitoring both the production of lipids and the complex interplay between lipids, proteins, and chemical messengers involved in
adipogenesis. Adipogenic differentiation is used here as a model system to explore the utility of SERS as a non-invasive in situ analysis method.
1.5 Dissertation Findings
The findings of this research have been shared at both scientific conferences and the publication of manuscripts to peer-reviewed journals. The manuscripts accepted, submitted, and in preparation are listed below along with miscellaneous related publications and
presentations:
In Preparation
B Moody, A Brna, GS McCarty. Multidimensional Interpretation Using Surface Enhanced Raman Analysis of Nucleotide Polymorphisms
Submitted
15
Peer-Reviewed Publications
B Moody, J Leotaud, GS McCarty. Using Surface Enhanced Raman Spectroscopy to Probe for Genetic Markers on Single Stranded DNA. Journal of Biomedical Optics, 2010 GS McCarty, B Moody, M Zachek. Enhancing Electrochemical Detection by Scaling Solid
State Nanogaps. The Journal of Electroanalytical Chemistry,2010
JG Roberts, B Moody, GS McCarty, LA Sombers. Investigating Surface Transformations Induced by Electrochemical Pretreatment at Carbon Fiber Microelectrodes. (In press,
Langmuir 2010)
M Zachek, P Takmakov, B Moody, RM Wightman, G McCarty. Simultaneous Decoupled Detection of Dopamine and Oxygen using Pyrolyzed Carbon Microarrays and FSCV.
Analytical Chemistry, 2009
B Moody, GS McCart
Applied Physics Letters, 2009
B Moody, G McCart
Analytical Chemistry, 2009
Book Chapters
16
B Moody, GS McCarty. Nanolithographic Techniques in Tissue Engineering. In
Nanotechnology and Tissue Engineering: The Scaffold; Laurencin, K. T., Nair, L. S., Eds.; CRC Press: 2008; pp 261.
Conference Presentations
B Moody, GS McCarty. Using Surface Enhanced Raman Spectroscopy to Detect Mid-Sequence Single Nucleotide Polymorphisms. 60th Pittsburgh Conference on Analytical Chemistry and Applied Spectroscopy, Chicago, IL, March 8-13, 2009.
17
Chapter 2: Solid State Nanogaps for Differential Measurements
of Molecular Properties
This chapter demonstrates the production and probing of extremely small separations between metal conductors, separations referred to as solid state nanogaps. These nanogaps can be inexpensively and controllably produced using a combination of molecular and standard photolithography. In this chapter these nanogaps are implemented for monitoring by using two detection schemes, one optical and one electronic. Specifically, the
enhancement principles from surface enhanced Raman spectroscopy are used to collect molecular information about the species in the nanogap and current-voltage traces are collected to probe the charge transport of the nanogap. These data show that the
18
2.1 Introduction
Solid state nanogaps are scientifically interesting due to their small size, robustness, and versatility. Many insights in physics at the nanometer scale have been made using these types of structures and more are expected in the future.61-63 Practically, solid state nanogaps have the potential of detecting chemical species on the near single-molecule scale.
Disciplines that stand to benefit from robust, sensitive, and inexpensive detection devices extend from practical applications of medical screening and explosives detection to more academic pursuits such as researching the fundamentals of charge transport and molecular binding events.
19
enhancing the Raman effect.25, 26, 64 Such discoveries lead to the possibility of using
nanogaps for dual function applications – to serve as an electronic detection device and as a SERS platform for chemical characterization. However, making a nanogap with the exact spacing can be difficult, especially with a large wafer-scale production. Fortunately, molecular lithographies can aid in this process.
In the past nanogap structures have been fabricated with mechanically controlled break junctions,65, 66 nanowire lithography,67 and electron beam lithography with
20
2.2 Materials and Methods
2.2.1 Electrodes/Nanogap fabrication. Solid state nanogaps are generated using a variation of previously developed molecular resist strategies.58 These strategies have demonstrated the ability to use multilayer resists to create structures from just a few nanometers to ~40 nm.59 The structures presented here are different in several ways from previous alkanethiol-based solid state nanogaps in that these structures are created with thicker single layer molecular resists and they maintained the capping metallic layer often sacrificed in other papers.
21
The hybrid fabrication methodology for these structures is shown schematically in Figure 2.1 and will be briefly explained. In this report, the initial electrode in the electrode pair that composes the nanogap is fabricated on a silicon wafer with 200 nm of silicon oxide (University Wafer) using a conventional photolithography lift-off process with SPR3012 (Rohm&Haas) and LOR5A (MicroChem) resists and then 3 nm of chrome and 40 nm of gold are deposited using electron beam evaporation. The photoresist and unwanted metal are removed with sonication in acetone and an immersion in CD-26 (MicroChem). Next, the electrode is submerged in 5 µM solution of thiolated oligonucleotide (IDT) for 24 hrs.
Finally, a second photolithographic lift-off process, metallic evaporation and resist removal are used to pattern the second electrode in the electrode pair. These processes were similar to those used to pattern the initial electrode except 3 nm of chrome and 25 nm of gold were deposited. The oligo resist had the sequence 5’ – T10 – GC AGC TTA GAA TCA AAT AGC GCG ATA TGC ATC GAT GAC TA – 3’ and a thiol modification at the 5’ terminus. Research suggests an oligo this size should be about ~20 nm in length.60
2.2.2 Raman Spectroscopy. All Raman spectra presented in this paper were collected with a custom built Raman microscope. Raman scattering was excited using a 12 mW, 632.8
22
nm HeNe laser (Thorlabs) coupled to an inverted microscope (Nikon, Diaphot) with a 100x (Nikon) dry objective. The reflected Raman signal was analyzed through an imaging spectrograph (PI Acton, SpectraPro SP-2156) and detected with a liquid nitrogen cooled CCD camera (PI Acton, Spec-10:100BR/LN). The laser power at the sample measured 3 mW and the laser spot was ~2 µm in diameter. Collection times were 20 s. GRAMS/AI 8.0 software (Thermo) was used for analysis and correction.
23
2.3 Results and Discussion
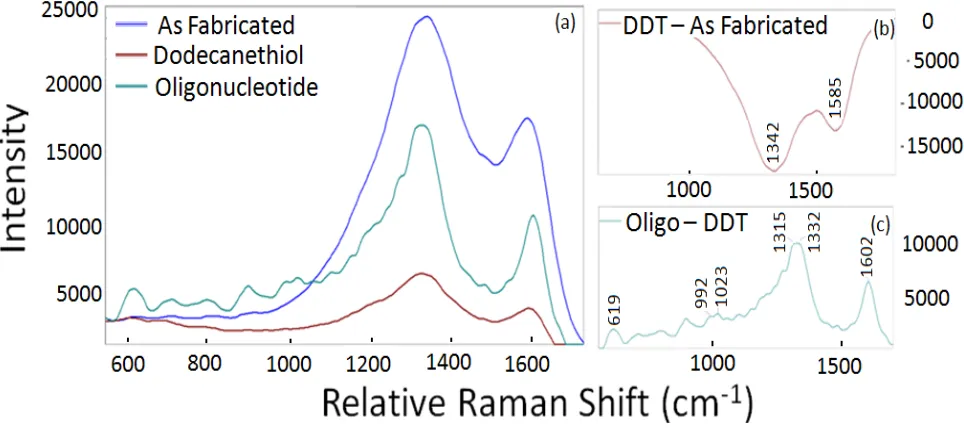
Figure 2.2 shows portions of the Raman spectra from a representative solid state nanogap and Figure 2.3 shows the current voltage traces for the same solid state nanogap at the same time points. The dark blue trace in Figure 2.2 shows the as fabricated condition. Note that while spectra recorded away from the nanogap show little signal or perhaps small contributions from the Si substrate (data not shown), the portion of the spectrum from the nanogap shown in Figure 2.2 has two strong peaks at 1342 and 1585 relative cm-1. These peaks are very similar to those observed in pyrolized photoresist or for glassy carbon with two strong bands around 1360 relative cm-1 (Disordered (D) band) and 1600 relative cm-1 (Graphitic (G)band).69, 70 These features alone are typical of sp2 bonding within a graphitic carbon matrix whereas oligo systems typically have several additional characteristic peaks present.24, 71 This suggests that some of the oligonucleotide being used as a molecular resist degraded during the fabrication process. The dark blue trace in Figure 2.3 shows the
24
Note that oligonucleotides and DNA oncethought to be insulators have since been shown to enable long range charge transfer when dry, though the exact mechanism is still debated.72, 73
Figure 2.2. Raman signal from a nanogap created using single-stranded oligonucleotides as a molecular resist in the structure’s fabrication. Figure 2.2a shows a portion of the Raman spectra collected at the electrode interface as fabricated, after a dodecanethiol (DDT) substitution, and then after thiol functionalized oligonucleotides (Oligos) were added to the solid state nanogap. Figures 2.2b and 2.2c are the spectra that result from subtracting the As Fabricated trace from the Dodecanethiol trace and from subtracting the Dodecanethiol trace from the Oligonucleotide trace, respectively. These latter spectra are used to highlight the change in condition between two states.
In an effort to remove some of the degraded oligonucleotide, the sample was
25
The results are shown in the brown trace of Figure 2.2 for Raman spectroscopy and the brown current voltage traces in Figure 2.3. Experiments in our lab have not shown
significant characteristic SERS scattering from dodecanethiol. The lack of SERS signal from DDT was expected since Raman activity is enhanced in molecules with some π-bonding or
with large cross-sectional areas.74, 75 Thus,
26
because dodecanethiol is a straight chain, sp3 hybridized system, a great reduction in Raman activity is expected when it is used to replace the more complex and aromatic, π-bonded
environment of the oligonucleotide system. From Figure 2.2 it can be seen that Raman activity indeed dropped significantly after the alkanethiol substitution, including activity from the graphitic peaks. This point is highlighted specifically by subtracting the “As Fabricated” trace from the “Dodecanethiol” trace. The resulting Figure 2.2b shows large negative peaks at 1342 and 1585 cm-1 that have been attributed to the D and G bands of carbon.69, 70 In Figure 2.3 a significant reduction in the charge transfer through the nanogap is also shown. It can be deduced from this information that some (though not all) of the degraded oligonucleotide has been removed from the solid state nanogap. Repeated aggressive sonication in strong solvents like dimethylformamide (DMF) can be used to remove more of the molecular species at the nanogaps, resulting in a Raman spectrum that is featureless except for a small peak at 530 cm-1
Finally, the alkanethiol-substituted oligo sample was immersed in a 5 µM aqueous
solution of thiol modified 50-mer oligonucleotide and heated to 60°C for one hour. The sample was removed, rinsed, and the electronic and Raman spectrum were again recorded and are shown as green traces in Figures 2.2 and 2.3. The conductivity of the sample
that represents the silicon substrate.
27
increased while still remaining non-linear with respect to applied voltage (see Figure 2.3). Figure 2.2c shows the Raman spectrum created by subtracting the “Oligonucleotide” spectrum from the “Dodecanethiol” spectrum. The resultant spectrum shows characteristic nucleic acid peaks for cytosine (at 619, 1023 cm-1),76 adenine (at 1332 cm-1),77 thymine (at 992 cm-1),76 and guanine (at 1315, 1602 cm-1).77 This information verifies that some
oligonucleotide was added to the solid state nanogap. It is expected that this corresponds to a significant Raman enhancement factor. Unfortunately, to date Raman spectra for single stranded oligonucleotide is notoriously difficult to obtain78 and by our hands none have been collected on other substrates for comparison. Notice also that while all conditions share similar peaks in the range of the sp2 bands, besides the additional peaks below 1200 relative wavenumbers, the oligo sample exhibits a significant shift of the 1342 cm-1 peak to lower wavenumbers and a shift of the 1585 cm-1 peak to higher wavenumbers. This can be observed easily in Figure 2.2c. It is hypothesized that these features are due to the convolution of peaks from the remaining degraded oligonucleotide from the fabrication process and some overlapping peaks from the added oligonucleotide. It is expected that the shifts predominantly indicate the presence of C-N stretching and NH2 deformations,
28
2.4 Conclusion
29
Chapter 3: Statistically Significant Raman Detection of
Mid-Sequence Single Nucleotide Polymorphisms
This chapter highlights methodologies that enable statistically significant data to be collected for single nucleotide polymorphisms using surface enhanced Raman spectroscopy. Single-stranded oligonucleotides functionalized with 40 nm gold nanoparticles are hybridized with oligonucleotides adsorbed to a photolithographically defined gold surface thus creating a surface enhanced Raman environment around the DNA duplex. With this design
characteristic Raman spectra have been collected and explored for differences between DNA duplexes formed from complementary oligonucleotides, completely mismatched
30
3.1 Introduction
Currently, there are a variety of different schemes used in SNP detection,36 however, nearly all require a polymerase chain reaction step79 in order to produce enough enriched source material for analysis. Though it does provide good specificity and sensitivity,80 PCR is known for being difficult to integrate into the sequence analysis processes used for SNP detection and is often cited as a major limitation to throughput in SNP genotyping assays.81 As an alternative to PCR-based analysis, some researchers are exploring nanotechnology for SNP detection. A recent innovation using DNA functionalized with gold nanoparticles shows that DNA/nanoparticle solutions with mismatched terminal bases will precipitate and lose color when mixed.38
Others are turning to spectroscopic approaches like Raman spectroscopy for non-destructive sensitive detection. Raman spectroscopy is a sensitive detection technique that has the potential of reducing the need for PCR. While innately weak Raman signals,
fluorescence, and large background noise can make biological Raman applications difficult, advances in laser and filter technology and the advent of surface enhanced Raman
31
using the hybridization of sample DNA with probing DNA that has been modified with gold nanoparticles and specific Raman labels. Using this technique, Sun et al. were able to achieve detection sensitivities of down to 1 fM27. While much progress is being made,24, 39, 40
much has yet to be done to couple Raman techniques to the detection of SNPs.
Surface enhanced Raman spectroscopy (SERS) is a spectroscopic technique that amplifies and improves Raman signal within a very localized vicinity, generally around two closely spaced metal structures. In general SERS is inexpensive, relatively fast, and vastly increases detection sensitivity. A major difficulty hampering SERS analysis, however, is sample-to-sample variability. SERS analyses especially are adversely affected by the
existence of so-called “hot-spots” – a substrate-based phenomenon that can result in data that is uncharacteristic of the system under study and causes large sample-to-sample variations that can hinder statistically significant differential analyses.21, 24
DNA in general and specifically SNP systems are both biologically important and experimentally robust and therefore make for good model systems. By definition, if the appropriate nucleotide in a single base of DNA is replaced by another nucleotide with a
32
frequency greater than 1%,29 the mutation is classified as a single nucleotide
polymorphism.30 On a molecular level, polymorphisms can alter protein function, affect DNA repair, encourage genetic instability, and promote cancer.33 Studies suggest that SNPs account for 90% of polymorphisms29 in the human genome and have been associated with breast, lung, head, and neck cancers among others.35 As genetic markers SNPs are being used for mapping conditions as diverse as diabetes, multiple sclerosis, and obesity.30
The methodologies reported in this paper enable automated statistically significant detection of SNP using Raman spectroscopy. Specifically, gold nanoparticles in conjunction with photolithographically created gold substrates can be used in DNA hybridization
experiments to create a SERS environment around DNA of interest. With this configuration a separation between gold surfaces that is nominally controlled by the length of the oligos (typically moderate sized oligos are between 10 and 20 nm in length
60
33
3.2 Materials and Methods
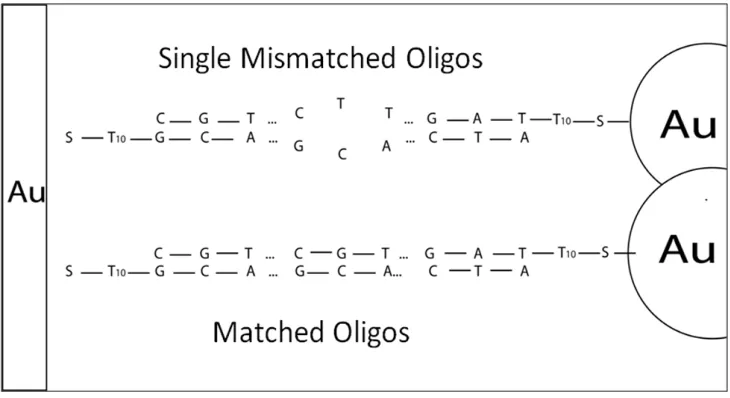
As seen schematically in Figure 3.1 the overall idea is to adsorb single stranded oligonucleotides (50-mers in length) to gold nanoparticles in aqueous solution and then place these solutions on noble metal features that are functionalized with either complementary, non-complementary, or complementary except for a single mismatched base
oligonucleotides. After several hours the samples are rinsed and Raman spectra collected. The scheme involves five main steps: 1) photolithographically preparing the substrate with gold features, 2) functionalizing the nanoparticles with “target” oligonucleotides, 3)
functionalizing the substrate with “capture” oligonucleotides, 4) hybridization of the oligo/nanoparticle solution with the substrate, and 5) Raman analysis.
34
3.2.1. Substrate Preparation 1. Through a combination of photolithography and electron beam deposition, a quartz wafer (SiliconQuest) was prepared and patterned with ~2-3 µm diameter circular gold spots (400 nm Au on ~2-30 nm Chrome) situated in arrays of 20
spots per array. The spots are placed in five rows of four spots with each spot distanced 5 µm from its nearest neighbor. The wafer was treated with 30%w/w peroxide for 1 hr
immediately prior to spotting in order to clean the surface.
3.2.2 Oligo Preparation 1 (Capture Strands). All oligos were purchased from IDT as 40 mer sequences supplemented with 10 thymine bases (T10) on the 5’ end for a total of 50 bases. The T10 section is intended to act as a spacer between the gold surfaces and the actual sequence thereby reducing non-specific binding and improving hybridization.27, 82
Dry DNA (from IDT) was first suspended in 1xTE buffer solution, pH 7.5 (IDT), then reduced by adding Reductacryl (Calbiochem) at a ratio of 1 mg oligo to 50 mg Recutacryl. The reduced solution was agitated for 30 minutes, filtered through a 0.22 µm
filter (Fisher), and then used to prepare a 1µM solution in the IDTE buffer. This solution was
spotted onto the dry micropatterned metal arrays on the quartz wafer which was then placed in a humid environment and incubated for 6 hrs at room temperature.
35
50 mer oligonucleotides with 5’ thiol modifications were used as capture strands. Two nearly identical sequences differing by only three bases around the site of mismatch were run for comparison. Capture strands for the first sequence, or the C-T sequence, had the sequence: 5’- Thiol – T10 – GC AGC TTA GAA TCG – C – ATA GCG CGA TAT GCA TCG ATG ACTA – 3’. Capture strands for the second sequence, named the A-G sequence, had a slightly altered sequence: 5’- Thiol – T10
3.2.3 Substrate Preparation 2. After incubation with capture strands, the wafer was rinsed by multiple submersions in DI water and dried under nitrogen. Then the wafer was spotted with a 1 mM solution of mercapto-1-hexanol (MHOH) (Sigma) to further reduce non-specific binding.
– GC AGC TTA GAA TCA – A – ATA GCG CGA TAT GCA TCG ATG ACTA – 3’.
27, 83
3.2.4 Oligo Preparation 2 (Target Strands). Concentrated gold nanoparticle solutions were prepared by centrifuging 6 mL of 40 nm diameter gold nanoparticles (Ted Pella) at 6000 rpm for 20 min and collecting the precipitate. Target oligo solutions were prepared by first reducing the target strands with Reductacryl using the same procedure as with capture strands and then adding them to the concentrated gold nanoparticle solutions. After 24 hrs, the gold/oligo solution was brought to 1 µM in 10 mM pH 7.5 phosphate
36
of 15 µL 4 M NaCl with vigorous mixing in between additions. After ~48 hrs, the target
solutions were washed in PB/T with 0.3 M NaCl twice by centrifugation (8000 rpm, 20 min) and redispersing sonications and brought up in the same solution.
Target strands were deemed complementary (matched), single mismatched, or non-complementary (completely mismatched) as described in Table 3.1. To explore the
robustness of the procedure and the effect of different sequences on the results, two different DNA sequences were used – one sequence designed to have a guanine-adenine mismatch and another designed to have a cytosine-thymine mismatch. All mismatches were placed at the fifteenth base position from the 5’ terminal. Procedure for functionalization with gold nanoparticles and hybridization with capture strands is similar to that developed by Sun et al. with some variations.27
3.2.5 Hybridization. Target strands were spotted onto the dry capture strand arrays prepared above, again put in a humid environment, and incubated at 40o
3.2.6 Raman Detection. Raman scattering was excited using a 12 mW red HeNe laser (Thorlabs) coupled to an inverted microscope (Nikon, Diaphot) with a 60x dry objective
37
(Olympus). The reflected Raman signal was analyzed through an imaging spectrograph (PI Acton, SpectraPro SP-2156) and detected with a liquid nitrogen cooled CCD camera (PI Acton, Spec-10:100BR/LN). The laser power at the sample measured 3 mW and the laser spot was about ~2 µm in diameter. Collection times were 20 s. GRAMS/AI 8.0 software
38
Table 3.1 Oligonucleotide Design for A-G and C-T Oligo Sequences
A-G Sequence
Complementary
5’ - Thiol – T10
Single Mismatch
– TAGT CAT CGA TGC ATA TCG CGC TAT – T – TGA TTC TAA GCT GC – 3’
5’ - Thiol – T10
Non-Complementary
– TAGT CAT CGA TGC ATA TCG CGC TAT – G – TGA TTC TAA GCT GC – 3’
5’- Thiol – T10
C-T Sequence
– GC AGC TTA GAA TCA – A – ATA GCG CGA TAT GCA TCG ATG ACTA – 3’
Complementary
5’ - Thiol – T10
Single Mismatch
– TAGT CAT CGA TGC ATA TCG CGC TAT – G – CGA TTC TAA GCT GC – 3’
5’ - Thiol – T10
Non-Complementary
– TAGT CAT CGA TGC ATA TCG CGC TAT – T – CGA TTC TAA GCT GC – 3’
39
3.3 Results and Discussion
This chapter describes efforts to create a statistically robust method for using Raman spectroscopy to explore the hybridization of oligo-modified nanoparticles and determine the feasibility of using this type of approach for SNP detection. The proposed mechanism
behind these experiments is that mismatched DNA will not bind as strongly as matched DNA and will be more susceptible to removal through stringent washes. Therefore, mismatched samples will have fewer hybridization events and less overall Raman signal. Differences between matched and mismatched spectra are determined by examining four different peaks that are characteristic for the oligonucleotides.
Several experimental considerations were implemented in an effort to reduce
ambiguity of the Raman data. Defined gold substrates were created from arrays of small (~2 µm diameter) photolithographically fabricated features. Electron beam deposition was used
40
nanoparticle–substrate interactions. Future efforts will examine substrates to increase Raman enhancement factors.
Effects of anomalous feature interactions are also diminished by simple data
processing. Eight random spectra were collected from three 20-spot arrays for each sample type – perfect match, single mismatch and complete mismatch. This resulted in the
collection of twenty-four spectra for each configuration. Data were smoothed and baseline corrected by subtracting an offset. Note that the offset was a straight line from the local minimum (created by the laser line notch filter) in the spectrum at ~200 relative
wavenumbers to the local minimum at ~2000 relative wavenumbers (past the region of observed Raman peaks). The “rubber band” method was not used for baseline correction as its human input makes it more susceptible to the artificial generation of statistically
significant data. Subsets of the six spectra closest to the median were then selected from each group in order to eliminate both high and low outliers. Finally, the subsets were averaged to determine overall intensity differences for plotting and the intensities of characteristic nucleic acid peaks were extracted for statistical analysis.
41
average intensity, single mismatched samples have less, and completely mismatched samples have almost none.
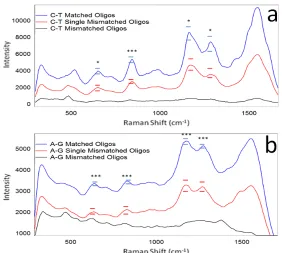
Figure 3.2. Raman spectra comparing the averaged median intensities of single-stranded oligos (matched, mismatched, and single-mismatched) hybridized to form double-stranded duplexes using the a) C-T and b) A-G sequences. Standard error bars are included for key peaks along with asterisks that indicate the level of statistical difference.
T-tests were applied to four peaks of interest within each sequence. For the C-T sequence these peaks included the guanine ring breathing at 650 cm-1,76, 77 the
42
guanine/thymine vibrations at 1285 cm-1.76 Statistically significant peaks in the A-G
sequence include thymine/adenine modes at 635 cm-1, 76, 77 the backbone peak at 831 cm-1,77, 84, 85
adenine/guanine stretches at 1179 cm-1,71 and guanine/thymine stretches at 1275 cm-1. 76, 77
An SEM analysis (data not shown) further supports the theory that more nucleotides are being hybridized in complementary samples than in single-mismatched samples. Images show greater surface area coverage of nanoparticles on the gold spot with complementary oligos, a reduced amount on the spot with single-mismatched oligos, and almost no particles on the completely mismatched sample. These images give additional confirmation on the number of strands that are hybridizing and on how representative the Raman signal is of hybridization events. Presumably this technique could be advanced to a point that would enable a correlation between particle counts/surface area coverage and Raman intensity.
43
3.4 Conclusions
A preliminary method capable of generating statistically significant data for detecting mid-sequence SNPs is reported in this work. Combining the virtues of photolithography, surface enhanced Raman spectroscopy, and comparatively simple surface chemistry
techniques, the process is also inexpensive and relatively fast. The merits of our technique, while here focused on the specific problem of SNP detection, contain underlying
44
Chapter 4: Using Surface Enhanced Raman Spectroscopy to
Probe for Genetic Markers on Single Stranded DNA
Methods capable of quickly and inexpensively collecting genetic information are of
increasing importance. In this chapter we report a method of using surface enhanced Raman spectroscopy to probe single stranded DNA for genetic markers. This unique approach is used to analyze unmodified genes of moderate length for genetic markers by hybridizing native test oligonucleotides into a surface enhanced Raman complex, vastly increasing
detection sensitivity as compared to traditional Raman spectroscopy. The Raman complex is formed by sandwiching the test DNA between 40 nm gold nanoparticles and a
45
4.1 Introduction
The detection of genetic markers has become ubiquitous in modern scientific research as a tool for examining the genetic relationships that underpin traits involving heredity, biological variability, disease susceptibility, and pharmacological efficacy to name a few. Because DNA sequence variations and base mismatches such as single nucleotide
polymorphisms (SNPs) have been associated with approximately 90% of polymorphisms in the human genome,29 researcher often use SNPs as markers for a variety of genetic diseases, 30
cancers, 35 and miscellaneous genetic curiosities.
The importance of improving the speed, specificity, and cost-efficiency of
methodologies used to collect genetic information directly correlates with the importance of the information itself. Though polymorphisms as genetic markers are traditionally probed using time-intensive Southern blot hybridizations and polymerase chain reaction (PCR) related methodologies,79 previously mentioned innovations using DNA functionalized with gold nanoparticles (AuNPs) have made preliminary steps in detecting terminal DNA mismatches.38 Unfortunately researchers were not able to use this technique with
mismatched bases closer to the middle of the sequence and the test DNA had to be modified to attach the nanoparticles.38
46
researchers have been using Raman to explore nearly every aspect of biology and
biomedicine86 - including DNA.87 Combining gold nanoparticle-based SERS with DNA opens several avenues of pure DNA analysis and subsequent gene detection methodologies.
Previous results from our lab used SERS to detect, with high levels of statistical confidence, differences between samples of complementary oligos and those formed from oligos with a mid-sequence base mismatch.52 However, a major drawback to the practical and clinical applicability of this technology is the need to add thiol modifications to each different oligo intended for analysis. Not only is it expensive to add thiol modifications to numerous target strands, the variability associated with the surface chemistry involved in functionalizing a large variety of oligonucleotides with gold nanoparticles gives rise to assorted degrees of clumping, precipitation, poor adsorption and other deleterious
interactions with the gold nanoparticles. We have found that using a single modified target oligo to test for multiple mutations reduces sample-to-sample variability, decreases the amount of preparation time, and decreases the need for costly reagents and modified DNA material.
47
48
4.2 Materials and Methods
The overall idea is to capture single stranded “test” oligonucleotides between closely spaced gold features. As depicted in Figure 4.1, a DNA test strand can be probed for
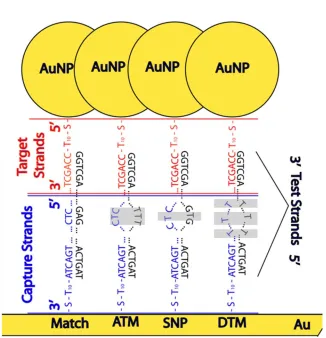
abnormal base mutations by hybridizing one highly conserved region of the strand to a gold surface-bound “capture” oligo and another region to a gold nanoparticle-bound “target” oligo thus creating a SERS environment around the test oligo. This was accomplished in a three step aqueous hybridization procedure using preparations similar to those previously developed27, 52 with several variations. Test samples were composed of the four types of DNA duplexes visualized in Figure 4.1 and defined in Table 4.1 – those formed from complementary oligos, those formed from oligos with a single mid-sequence base mismatch (SNP), those formed from oligos that have three delocalized mismatches (DTM), and those that have a polymorphic region of three adjacent mismatches (ATM). Resulting Raman spectra were compared for statistically significant intensity and peak position differences at four characteristic peaks as described below. The overall method involves eight main steps discussed further in the Methods section.
4.2.1 Substrate Preparation 1. As described elsewhere,52 ~2-3 µm gold spots (400
49
50
Figure 4.1. Visualization of the hybridization scheme used to create a SERS environment around DNA duplexes. Single stranded oligos are hybridized as either completely matched, with a single mismatch (SNP), with an adjacent triple mismatch (ATM), or with a
51
Table 4.1. Oligonucleotide Design for Matched and Mismatched Sequences
Sequence
Target Strand 5’ - Thiol - T10
Capture Strand
- CCA GCT TAGA - 3’
5’ - ATC GCA TGA GCT CAT ATG CAT CGA TGA CTA - T10
Complementary
- Thiol - 3’
3’ - GGT CGA ATC TTA GCG TAC TCG AGT ATA CGT AGC TAC TGAT - 5’
Single Mismatch
3’ - GGT CGA ATC TTA GCG TAC TCG - T - GTA TAC GTA GCT ACT GAT - 5’
Adjacent Triple Mismatched
3’ - GGT CGA ATC TTA GCG TAC TC - TTT - TAT ACG TAG CTA CTG AT - 5’
Delocalized Triple Mismatched
3’ - GGT CGA ATC TT - T - GCG T - T - C TCG AGT - T - TAC GTA GCT ACT GAT - 5’
52
Reductacryl (Calbiochem) then spotted onto micropatterned metal arrays on the quartz wafer which was then placed in a humid environment and incubated for 6 hrs at room temperature.
4.2.3 Substrate Preparation 2. After incubation the wafer was rinsed by multiple submersions in DI water and dried under nitrogen. Then the wafer was spotted with a 1 mM
solution of mercapto-1-hexanol (MHOH) (Sigma) in ethanol and allowed to sit overnight (~17 hrs) in order to limit nonspecific binding in later steps.27, 83 MHOH was rinsed with DI water by immersion and dried under nitrogen.
4.2.4 Oligo Preparation 2 (Target Strands). Target strands were designed to be complementary to the last ten bases on the 3’ terminus of the test strands. Therefore, target strands contained 20 bases – ten meant to hybridize with the linking strands and ten thymine spacers – and a thiol modification on the 5’ end. Procedure for functionalization with gold nanoparticles and hybridization with capture strands is similar to that developed by Sun et al. with some variations.27
The Target solution was prepared by adding concentrated DNA in IDTE to a solution of 40 nm gold nanoparticles (Ted Pella) such that the final DNA concentration of the target solution was 10 µM. After 24 hrs, the gold/oligo solution was buffered with a 10 mM pH 7.5
53
final salt concentration to 0.3 M. After ~48 hrs, the target solutions were washed in PB/T with 0.3 M NaCl twice with centrifugations (and redispersing vortexes) in between and again brought up to 10 µM in the same solution.
4.2.5 Oligo Preparation 3 (Test Strands). Test strands were deemed complementary (matched), single mismatched (SNP), adjacent triple mismatched (ATM), delocalized triple mismatched (DTM), or non-complementary (completely mismatched) based on how they matched to the capture strand, as described in Table 4.1. All mismatches were designed to be thymine-thymine or thymine-cytosine mismatches to minimize the possibility of alternate Watson-Crick base pairings such as the “wobble”.
Test Strands were also prepared by diluting the dry DNA to 1 µM solutions in IDTE.
Immediately following Substrate Preparation 2, the test strands were spotted onto appropriate arrays, again put in a humid environment, and incubated at 40oC for 4 hrs. The wafer was then rinsed by immersion in DI water and dried slightly with nitrogen.
54
immediately analyzed with Raman. Further water rinses after 24 hrs did not seem to have an effect on the Raman signal.
4.2.7 Raman Detection. Raman scattering was excited using a 12 mW red HeNe laser (Thorlabs) coupled to an inverted microscope (Nikon, Diaphot) with a 60x dry objective (Olympus). The reflected Raman signal was analyzed through an imaging spectrograph (PI Acton, SpectraPro SP-2156) and detected with a liquid nitrogen cooled CCD camera (PI Acton, Spec-10:100BR/LN). The laser power at the sample measured 3 mW and the laser spot was about 2 µm in diameter. Collection times were 20 s. GRAMS/AI 8.0 software
(Thermo) was used to average the spectra and for baseline correction.
4.2.8 Statistical Analysis. A two-sided, two-sample t-test (α = 0.05) assuming
55
4.3 Results
Twenty-four Raman spectra from each test sample were collected and processed as previously reported.52 To eliminate high and low outliers, subsets of seven median spectra were selected from each original group of 24. These median subsets were averaged to determine overall intensity for plotting and the intensities and peak positions of the four characteristic nucleic acid peaks were extracted for statistical analysis. Statistical
significance was determined (from p<0.01 to p<0.001, α = 0.05) for differences between each of the samples at the four selected peaks. These peaks include guanine ring breathing at 660 cm-1,71, 76 the phosphodiester backbone peak around 840 cm-1,77 a guanine stretch at 970
cm-1,71, 76, 77 and guanine vibrations at 1174 cm-1.76 Figure 4.2 more succinctly shows the
peak positions and standard error of these key peaks. Note that among all these peaks, the overall Raman intensity of the complementary sample is significantly greater than that of the single mismatched sample which is itself greater than the triple mismatched samples.
Significance levels are individually summarized in Table 4.2.
56
concludes the percent coverage of nanoparticles in the representative areas is 25.0% for the matched sample, 17.8% for the SNP sample, and 14.1% for the triple mismatched sample.