Respond to Light. (Under the direction of Dr. Alexander Deiters).
Highly complex synthetic gene circuits have been engineered in living organisms to develop systems with new biological properties. In order to program synthetic gene circuits to
perform their various functions, external control over their activity needs to be achieved. Any input for an engineered system must be accurate, precise and tunable to ensure stable output generation. Light serves as an excellent trigger to achieve precise control over synthetic systems as it can be regulated in wavelength, timing, intensity and location. Light-inducible systems are often generated through the installation of a light-cleavable photo-protecting (photocaging) group on a biologically active small molecule. The research herein describes various synthetic biological systems whose activity can be controlled by light through photocaged small molecules and other small molecule tools. Specifically we show the (1) control of gene expression in prokaryotic cells with photocaged inducer molecules, (2) control of protein function in pro- and eukaryotic cells through genetically encoded unnatural amino acids, (3) synthesis of small molecules for the control of miRNA function in
by
Laura Kimberly Gardner
A thesis submitted to the Graduate Faculty of North Carolina State University
in partial fulfillment of the requirements for the degree of
Master of Science
Chemistry
Raleigh, North Carolina 2012
APPROVED BY:
_______________________________ ______________________________
Alexander Deiters, PhD Reza Ghiladi, PhD
Committee Chair
DEDICATION
This work is dedicated to
My Mom and Dad who have always been supportive, loving and motivational
My brother who has always shown me to have multiple points of view
Fellow graduate students who have made this experience unforgettable
And to Steven Rogers, for being an excellent supporter, friend and teacher through my best
BIOGRAPHY
The author, Laura Gardner, was born on September 22, 1987 to Peter and Mary Jo Gardner in Hickory, NC. She moved to Wake County in 1995 and graduated from Apex High School in 2005. After graduation, she began her undergraduate degree at North Carolina State University and worked in the lab of Dr. Reza Ghiladi to study the catalase and peroxidase activities of KatG mutants from Mycobacterium tuberculosis. Additionally, she completed the chemistry honors program, received an undergraduate scholarship for research and was an active member of the NCSU rowing team. After graduating magna cum laude from the chemistry department in 2009, she chose to continue her graduate studies at North Carolina State University.
ACKNOWLEDGMENTS
I would like to acknowledge many people for helping me during my time in graduate school. In particular, I would like to acknowledge my advisor, Dr. Alex Deiters for being an excellent mentor and teacher during my graduate studies. I would also like to acknowledge Dr. Reza Ghiladi, my undergraduate advisor and graduate committee member, for introducing me to research and always giving fantastic advice and Dr. Robert Kelly, for developing such a great biotechnology program and support through the GAANN fellowship. I would also like to thank all members of the Deiters Lab who have made lab a place I really enjoy. In particular I would like to thank Colleen, Kalyn, Jeane, Meryl, Yan, Qingyang, and Jessica for being excellent friends, providing some of the best bake goods I’ve ever eaten and being great dancing partners; be it downtown or in the lab. I would also like to thank Rajendra for all his knowledge, advice, great stories and Nepalese food; Dr. Hank Chou for helping me with all of my cloning questions; and Andrew for making rocks shows much more fun. Additionally I would like to thank members of the Ghiladi and Melander labs for always lending a helping hand, and Alex P. for assistance with pyrotechnics.
TABLE OF CONTENTS
LIST OF FIGURES ... vii
LIST OF SCHEMES ... xv
CHAPTER 1: INTRODUCTION TO SYNTHETIC BIOLOGY ... 1
CHAPTER 2: PHOTOCHEMICAL CONTROL OF GENE EXPRESSION IN E. COLI ... 6
2.1 Introduction to light-activated gene expression... 6
2.2 Control of gene expression with a photocaged erythromycin ... 10
2.3 Photochemical control of DNA recombination in bacterial cells ... 24
2.3.1 Synthesis of a photocaged arabinose ... 28
2.3.2 In vivo control of DNA recombination with photocaged arabinose ... 30
2.4 Summary and outlook ... 35
2.5 Experimental methods ... 36
CHAPTER 3: UNNATURAL AMINO ACID MUTAGENESIS... 46
3.1 Introduction to unnatural amino acid mutagenesis ... 46
3.2 Incorporation of photocaged thio-tyrosine for novel bioconjugation reactions... 49
3.3 Expanding the eukaryotic genetic code ... 56
3.3.1 Incorporation of photocaged histidine ... 60
3.4 Summary and outlook ... 64
CHAPTER 4: SYNTHESIS OF MIRNA-21 INHIBITORS AS POTENTIAL
THERAPEUTICS ... 75
4.1 Introduction to miRNAs and the miRNA pathway... 75
4.2 Introduction to small molecule inhibitors of miRNA-21... 77
4.3 Synthesis of new oxadiazole inhibitors of miRNA-21 ... 79
4.4 Summary and outlook ... 90
4.5 Experimental methods ... 91
CHAPTER 5: CHEMICAL BIOLOGY APPLICATIONS OF THE HALOTAG PROTEIN... 97
5.1 Introduction to the HaloTag protein ... 97
5.2 Development of a Malachite-Green:HaloTag viscosity sensor ... 100
5.3 Control of protein degradation with hydrophobic HaloTag ligands... 110
5.4 Summary and outlook ... 117
5.5 Experimental methods ... 118
CHAPTER 6: SYNTHESIS OF A PHOTOCAGED CYSTEINE CROSSLINKER... 126
6.1 Introduction to cysteine bioconjugation... 126
6.2 Synthesis of a photocaged cysteine crosslinker ... 128
6.3 Summary and outlook ... 131
6.4 Experimental methods ... 131
LIST OF FIGURES
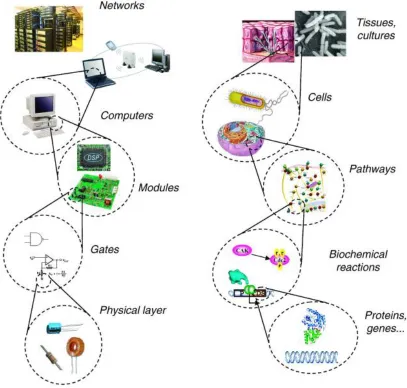
Figure 1.1. Computers and living organisms are constructed from a similar bottom-up
approach. Adapted from Mol Syst Bio. 2006, 2, 1 ... 2 Figure 1.2. Decaging of a biologically inactive molecule with 365 nm UV light... 3 Figure 2.1. Photocaged doxycycline 1 was used to achieve spatial control over GFP
expression. Adapted from ACS Chem. Biol. 2010, 5, 313 ... 8 Figure 2.2. The IPTG (isopropyl-β-D-thio-galactoside) inducible lac operon... 9
Figure 2.3. (A) Decaging of photocaged IPTG 2. (B) Bacterial lithography of GFP
expression; the left half of the plate was covered with a mask and the right half of the plate was exposed to UV light. Adapted from Angew. Chem. Int. Ed. 2007, 460, 4290... 9 Figure 2.4. (A) Erythromycin resistance gene cassette found in some strains of E. coli. (B)
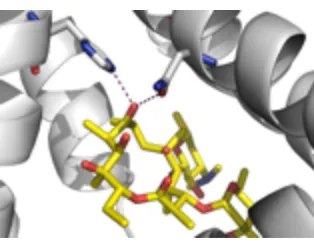
Engineered MphR(A)/promoter system for conditional expression of reporter genes in the presence of erythromycin. Adapted from Mol. BioSyst., 2011,7, 2554 ... 11 Figure 2.5. Crystal structure of the MphR(A) binding pocket with erythromycin (in yellow).
Adapted from Mol. BioSyst., 2011,7, 2554... 12 Figure 2.6. Two-plasmid system used in conjunction with photocaged erythromycin 7
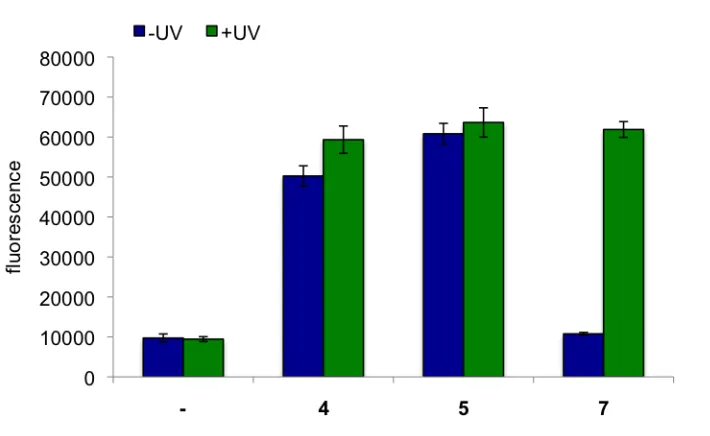
Figure 2.7. GFP expression in bacteria induced by erythromycin (4) (left) and the 9-oxime erythromycin (5) (right). Adapted from Mol. BioSyst., 2011,7, 2554 ... 15 Figure 2.8. Decaging of photocaged erythromycin. In the absence of UV irradiation, 7 does
not activate GFP expression. After 5 minutes UV irradiation, 96% of GFP expression is restored. Error bars represent standard deviations from three
independent experiments. Adapted from Mol. BioSyst., 2011,7, 2554... 16 Figure 2.9. Erythromycin inducible LacZ reporter plasmid, provided by the Cropp Lab
(VCU). Adapted from Mol. BioSyst., 2011,7, 2554... 17 Figure 2.10. Miller assay to quantify β-galactosidase activity of E. coli induced with
9-Oxime 5 or photocaged erythromycin 7; +/- UV irradiation. Photocaged erythromycin 7 induction + UV irradiation restored β-galactosidase activity to
levels of the positive control. Error bars represent standard deviations from three independent experiments. Adapted from Mol. BioSyst., 2011,7, 2554.... 18 Figure 2.11. Spatial control of GFPuv expression using a photocaged erythromycin 7. The
Figure 2.13. (A) Light-triggered bacterial AND gate and (B) truth table showing the resulting EGFP fluorescence imaged with a Typhoon scanner. Input I1 = excitation at 365 nm, input I2 = excitation at 483 nm, output O = emission at 509 nm. Adapted from Mol. BioSyst., 2011,7, 2554 ... 21 Figure 2.14. Irradiation-dependent band-pass filter of 7 based on EGFP expression. The
band-pass filter is indicated in green. The fluorescence is normalized to the highest signal and the error bars represent standard deviations from three independent experiments. Adapted from Mol. BioSyst., 2011,7, 2554... 22 Figure 2.15. UV toxicity timecourse. Adapted from Mol. BioSyst., 2011,7, 2554... 23 Figure 2.16. Site-specific recombination between double stranded DNA. Blue stars represent the catalytic center of the active recombinases (shown in yellow). Adapted from
Annu. Rev. Biochem. 2006, 75, 567 ... 25 Figure 2.17. Cre DNA recombinase recognizes two, 34 base-pair loxP sites and either inverts,
excises, or integrates the DNA between them; depending on their orientation. Adapted from ACS Chem. Biol. 2009, 4, 441 ... 26 Figure 2.18. Plasmids for assaying Flpe expression in E. coli. Addition of arabinose induces
expression of Flpe, that will then excise the LacZ gene from between two frt
sites. Without an origin of replication, the LacZ gene is lost and no β
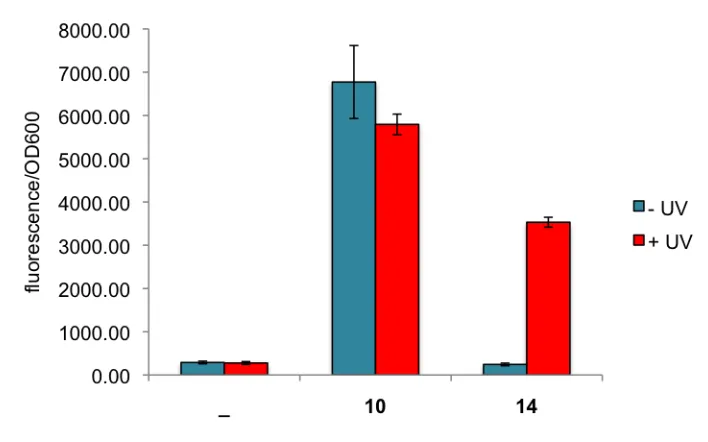
-galactosidase is expressed... 27 Figure 2.19. Decaging of 14 in liquid culture. Samples were irradiated for 15 minutes at 365
measured by a Biotek Synergy 4 platereader (483/509 ex/em). Approximately 60% of fluorescence was restored after irradiation. Error bars represent standard deviations from three independent experiments ... 31 Figure 2.20. Flpe recombination activity assay. (A) No compound, (B) 10, (C) 14 -UV, (D)
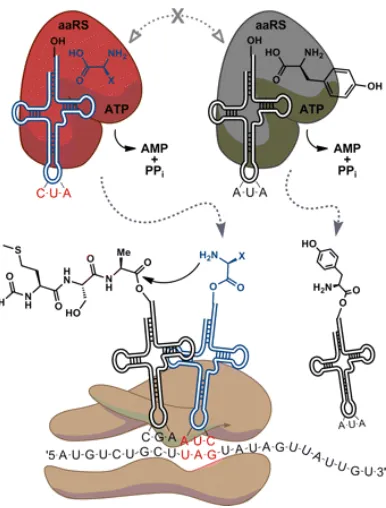
14 +UV (15 minutes) ... 32 Figure 2.21. Arabinose controlled eGFP expression in bacterial cells ... 34 Figure 3.1. Amino-acylation of an orthogonal tRNA (blue) by an evolved cognate tRNA
synthetase (red) for unnatural amino acid incorporation in response to an amber stop codon, UAG. X = unnatural amino acid side-chain. Adapted from J. Biol. Chem. 2010, 285, 11039 ... 48 Figure 3.2. Thio-reactive linkers; fluorescent dansyl 18 and PEG 19... 51 Figure 3.3. SDS-PAGE of ubiquitin expression. Lane 1: Molecular weight ladder. Lane 2: no amino acid added. Lane 3: 1 mM ONBY. Lane 4: 1 mM PCSY 16... 52 Figure 3.4. SDS-PAGE of myoglobin expression. Lane 1: Molecular weight ladder. Lane 2:
no amino acid. Lane 3: 1 mM ONBY. Lane 4: 1 mM PCSY 16... 53 Figure 3.5. SDS-PAGE of pEVOL-E10 + pBH161Y639TAG T7RNAP protein expression.
Lane 1: Molecular weight ladder, Lane 2: no amino acid, Lane 3: 1 mM ONBY, Lane 4: 1 mM PCSY 16... 54 Figure 3.6. Radioactively labeled RNA synthesis by wild-type T7RNAP or photocaged
UV, Lane 7: photocaged T7RNAP 5 min UV, Lane 8: photocaged T7RNAP 10 min UV, Lane 9: photocaged T7RNAP 15 min UV, Lane 10: photocaged
T7RNAP 20 min UV ... 55 Figure 3.7. SDS-PAGE of pEVOL-E10 + pETUbK48TAG6XHis protein expression. Lane 1:
Molecular weight ladder. Lane 2: no amino acid. Lane 3: 1 mM ONBY (0.1 mM IPTG induction). Lane 4: 1 mM ONBY (1 mM IPTG induction). Lane 5: 1 mM PCSY (0.1 mM IPTG induction). Lane 6: 1 mM PCSY (1 mM IPTG induction) .. ... 55 Figure 3.8. Schematic of amber suppression in the GAL4 gene to activate transcription of
reporter genes. Adapted from Chem Biol, 2003, 10, 511 ... 57 Figure 3.9. Reporter genes used in selections in S. cerevisiae. Gal4 recognizes all three of the promoters, but with varied affinity. Adapted from Chem Biol, 2003, 10, 511 .... 58 Figure 3.10. Photocaged histidines analogues 20 and 21 to be used for unnatural amino acid
incorporation ... 61 Figure 3.11. Phenotypes of known clones grown on selective media. (A) Various Synthetase
fragments, a 200 bp, 1.3 kb and 1.1 kb portion. Each portion contained 50 bp of overlap to the portion of the fragment flanking it. As seen in this gel, most amplification was specific and very few bands were observed from non-specific binding ... 64 Figure 4.1. The miRNA processing pathway. Adapted from Nat Cell Biol. 2009, 11, 228 .. 76 Figure 4.2. Schematic of assay used to screen for small molecule inhibitors of miR-21. (A) In
the presence of functional miR-21, the microRNA binds to its target sequence downstream of luciferase and decreases luminescence signal. (B) In the presence of a small molecule inhibitor of miR-21, the microRNA is unable to bind the target sequence and an increase in luminescence signal is detected. Adapted from
J. Am. Chem. Soc. 2010, 132, 7976 ... 78 Figure 4.3. microRNA inhibitors of miR-21 22 and 23, discovered from a small molecule
screen and subsequent SAR study ... 78 Figure 4.4. Initial hit miR-21 inhibitor from the NIH library screen... 79 Figure 4.5. Dose-response curves for the original miR-21 inhibitor 23 and the new
oxadiazole 24 miR-21 inhibitor ... 80 Figure 4.6. Bright Glo assay of miR-21 inhibitors 23 and 24. At 10 µM concentration, the
standard deviation. This assay was conducted by Colleen Connelly... 86 Figure 4.8. In vitro FLuc assay for 23 and 24, compared to the known Fluc inhibitor 45.... 88 Figure 4.9. In vivo FLuc inhibition of known inhibitor 45... 89 Figure 4.10. Levels of mature miR-21 in cells treated with 22 and 24 compared to a DMSO
control. This assay was performed by Colleen Connelly ... 90 Figure 5.1. (A) The HaloTag protein forms a covalent bond with HaloTag ligands through
active site residue D106. (B) Commercially available HaloTag ligands for fluorescent imaging and immobilization to a solid phase. Adapted from ACS Chem. Biol. 2008, 3, 373... 98 Figure 5.2. (A) ONB-HaloTag linker 46. (B) Photochemical activation of Cdc42 activity.
Reaction with X alone fails to block GTP binding. After the HaloTag protein is recruited, GTP is unable to bind and Cdc42 remains inactive. Activity is restored after UV irradiation removes 46. Adapted from ChemBioChem. 2009, 10, 2855... ... 99 Figure 5.3. Purification of the human kinases PKCγ and PI3Kγ by affinity tagging methods.
The arrow represents the expected molecular weight of the kinase after proteolytic cleavage. Adapted from Protein Express Purif. 2011, 76, 154 ... 100 Figure 5.4. SDS-PAGE of purified HaloTag protein. Lane 1: Molecular weight ladder. Lane
2: HaloTag protein ... 102 Figure 5.5. Labeling of HaloTag protein with fluorescent ligands; Lane 1: 1 hour labeling of
TMR linker 57... 105 Figure 5.6. Competitive binding assay for 59. Lane 1: molecular weight marker, Lane 2:
simultaneous reaction of reagents with 10-fold excess 59, Lane 3: sequential reaction of reagents with 10-fold excess 59, Lane 4: simultaneous reaction of reagents at equimolar concentrations, Lane 5: sequential reaction of reagents at equimolar concentrations, Lane 6: reaction of HaloTag with 57 only ... 106 Figure 5.7. (A) UV-visible absorption spectrum for 63, λmax = 605 nm. (B) 63 in solution ...
... 108 Figure 5.8. Toxicity study of 63 on E. coli at varying concentrations... 107 Figure 5.9. (A) Hydrophobic HaloTag ligand 64. (B) General procedure for controlling
protein degradation with a small molecule. A fusion of HaloTag:POI is reacted with 64 and then the fusion protein is targeted for degradation by the proteosome. Adapted from Nat. Chem. Biol. 2011, 7, 538 ... 111 Figure 5.10. Fluorescent images of HEK293T cells treated with 64 (1µM) or DMSO. This
LIST OF SCHEMES
Scheme 2.1. Synthesis of photocaged erythromycin 7... 13
Scheme 2.2. Synthesis of NPP-OH caging group... 29
Scheme 2.3. Synthesis of photocaged arabinose 14... 30
Scheme 2.4. Synthesis of 1,2,3,4-tetra-O-acetyl-L-arabinopyranose 15... 33
Scheme 3.1. Light activation of photocaged thio-tyrosine (PCSY) to yield thio-tyrosine 17. The amino acid 16 was synthesized by Rajendra Uprety (Deiters Lab)... 50
Scheme 4.1. Synthesis of the oxadiazole precursor 28... 81
Scheme 4.2. Synthesis of the miR-21 inhibitor 24... 82
Scheme 4.3. Synthesis of oxadiazole analogues 35-37... 84
Scheme 4.4. Synthesis of phenol oxadiazole 40... 85
Scheme 4.5. Synthesis of the known FLuc inhibitor 45... 87
Scheme 5.1. Malachite green (47) can fluctuate between a planar state when in a high viscosity environment and a propeller shape when in a low viscosity environment ... 101
Scheme 5.2. Synthesis of HaloTag linker 52... 102
Scheme 5.3. Synthesis of fluorescent HaloTag linker 54... 103
Scheme 5.4. Buchwald-Hartwig reaction to form the carbon-nitrogen bond ... 104
Scheme 5.5. Synthesis of the bezamide HaloTag linker 59... 105
Scheme 5.6. Carbodiimide coupling of HaloTag linker to benzoic acid ... 107
Scheme 5.8. Synthesis of the hydrophobic HaloTag ligand 64... 112 Scheme 5.9. Proposed route to synthesize the photocaged hydrophobic HaloTag linker ... 115 Scheme 6.1. Examples of cysteine biochemistry; reaction with haloacetyl groups (top) and
maleimide derivatives (bottom) to form thio-ether bonds ... 126 Scheme 6.2. Initial synthetic route to synthesize a photocaged cysteine crosslinker ... 128 Scheme 6.3. Second attempted synthetic route to synthesize a dimaleimide cysteine
CHAPTER 1 – INTRODUCTION TO SYNTHETIC BIOLOGY
Biological systems are composed of a series of complex networks, connected by interactions of DNA, RNA, amino acids and small molecules. In recent years, much emphasis has been put on exploring these convoluted pathways and understanding the precise mechanisms on which they operate. As the wealth of information on genetic circuitry has grown, so has the ability to manipulate these systems to carry out new functions.
Proteins, oligonucleotides and small molecules are the building blocks for synthetic biology, a discipline that strives to apply electrical engineering principles to the design and understanding of biological processes for the creation of new systems with useful properties.[1-3] Synthetic biology requires the same bottom-up approach of electrical engineering to construct these genetic circuits (Figure 1.1).[4] The fundamental hardware (DNA, RNA, protein) is used to create switches and gates via reactions and interactions. These gates and switches are connected to form genetic circuits such as operons and feedback loops, which when assembled together create the complex pathways of a cell.
over biological processes such as gene expression as they can be easily manipulated synthetically and allow for temporal control over a system as one can control the timing of addition.
Previously developed gene expression systems controlled by small molecules include antibiotic-inducible systems,[8] sugar-inducible systems[9] and biotin-mediated gene expression systems.[10] These methods allow for temporal control, but lack spatial control over gene expression. An alternative method to exhibit precise spatial control over gene expression is to use light as a trigger. To achieve photochemical control, a light-cleavable protecting group, termed “caging group”, is installed on a biologically active molecule to render it temporarily inactive.[11] The caging group can then be removed from the molecule after irradiation with UV light; a process called “decaging” (Figure 1.2). Traditionally an
ortho-nitrobenzyl group is the protecting group of choice as it can be applied to a variety of functional groups and is removed quickly after brief irradiation with UV light (365 nm).
Figure 1.2. Decaging of a biologically inactive molecule with 365 nm UV light.
ONB group can be placed on various functional groups including hydroxyls, carboxylates and amines, is easily synthesized, and can be modified to tune the absorbance maximum to longer wavelengths.[14]
The Deiters lab has a longstanding interest in using small molecules, in particular photocaged small molecules, as tools to modulate biological processes. In particular we are using small molecules and photocaged biomolecules to control gene expression and protein function in pro- and eukaryotic cells. In the presented research we aim to demonstrate:
1. Synthesis and application of photocaged small molecules to control gene expression in bacterial systems with high degrees of spatiotemporal control 2. Application of photocaged small molecules to construct a light-activated logic
gate and a bandpass filter for further applications of light-based synthetic gene circuits
3. Incorporation of photocaged amino acids into bacterial proteins to control protein function and specific bioconjugation events with light
4. Evolution of amino-acyl tRNA synthetases in both pro- and eukaryotic cells to selectively incorporate unnatural amino acids into proteins in vivo
5. Synthesis of small molecules inhibitors of microRNA-21 to regulate miRNA activity in mammalian cells
7. Synthesis of various functional ligands for use with the HaloTag protein as chemical biology tools
CHAPTER 2 – PHOTOCHEMICAL CONTROL OF GENE EXPRESSION IN E. COLI
2.1 Introduction to light-activated gene expression
Small molecule inducible gene expression systems are a fundamental method of gene regulation in pro- and eukaryotic organism.[9] These gene switches are comprised of a repressor protein that binds to a promoter region upstream of the gene of interest inhibiting gene expression. Binding of a small molecule induces a conformational change and releases the repressor from the DNA thereby inducing gene expression. These switches exhibit high specificity for the small molecule and its cognate repressor protein, tight regulation between ‘on’ and ‘off’ states, and low basal levels of gene expression.[9] Small molecule activated gene switches have long been used in traditional molecular biology to control expression of recombinant proteins. These features, as well as the ease of manipulation of small organic molecules, make small molecule inducers targets for photochemical control of gene networks. Light-inducible small molecule systems are often generated through the installation of a light-cleavable photo-protecting (photocaging) group on the small molecule inducer of gene expression, rendering the small molecule inactive until the caging group is removed through irradiation.
regulation can be separated from their endogenous genes and recombined to create new synthetic circuits. Since then, various other photocaged small molecules have been developed to created light-activatable molecular switches including a caged ecdysone,[15] a caged IPTG for use with the lac operon,[16] caged toyocamycin for ribozyme-mediated gene expression,[17] caged doxycycline for use with the Tet-on system,[18] and caged rapamycin for light-mediated FKBP/FRB dimerization.[19-21]
Various photocaged analogues of doxycycline have been shown to control gene expression in eukaryotic systems, including transgenic mice.[22] Recently, Koh et. al, reported a new photocaged doxycycline, NvOC-Dox, to create photolithographic patterns of gene expression in mammalian cells.[23]
Figure 2.1. Photocaged doxycycline 1 was used to achieve spatial control over GFP expression. Adapted from ACS Chem. Biol. 2010, 5, 313.
Figure 2.2. The IPTG (isopropyl-β-D-thio-galactoside) inducible lac operon.
A photocaged analogue of the inducer molecule, IPTG was synthesized to exhibit spatial and temporal control over the lac operon. After short irradiation with UV light, photocaged IPTG 2 is converted to IPTG 3 (Figure 2.3).
Figure 2.3. (A) Decaging of photocaged IPTG 2. (B) Bacterial lithography of GFP expression; the left half of the plate was covered with a mask and the right half of the plate was exposed to UV light. Adapted from Angew. Chem. Int. Ed. 2007, 460, 4290.
plated onto agar plates pretreated with photocaged IPTG 2. Half of the plate was covered with a mask, and the uncovered half was irradiated with UV light (365 nm, 25 W). The cells were then allowed to grow overnight before visualization. Distinct spatial control over GFP expression was observed (Figure 2.3).
This system introduced a new and facile method for controlling gene expression with light. As many genes used in recombinant protein expression are under control of the Lac
operon, this methodology can be applied to a multitude of genes and proteins, and can be used to study elements involved in transcription. This system was demonstrated to work in E. coli but can potentially be applied to plant and mammalian cells that also use the Lac operon [24,25].
2.2 Control of gene expression with photocaged erythromycin
cluster revealed that mphA, the gene that encodes Mph(A), is regulated by the regulatory protein MphR(A) that binds upstream of its own promoter (PmphR) to prevent transcription of mphA and of itself.[32] When erythromycin is present, MphR(A) binds the antibiotic, undergoes a conformational change and releases the operator, thus activating transcription of the mphA gene and initiating erythromycin resistance (Figure 2.4). This negative feedback loop effectively allows E. coli to confer erythromycin resistance only when the antibiotic is present.
Figure 2.4. (A) Erythromycin resistance gene cassette found in some strains of E. coli. (B) Engineered MphR(A)/promoter system for conditional expression of reporter genes in the presence of erythromycin. Adapted from Mol. BioSyst., 2011,7, 2554.
We generated a MphR(A)/promoter system (Figure 2.4) to enable conditional expression of three reporter genes (β-galactosidase, GFPuv and EGFP) in the presence of
that is incapable of binding to MphR(A), we will be able to achieve spatial and temporal control over gene expression by photochemically regulating ligand binding. This system is an alternative method for photochemically controlled gene expression, and can be used in systems that contain a lac operon that is necessary for cellular processes.
The crystal structure of the MphR(A)/erythromycin complex (PDB 3FRQ) shows important hydrogen bonding interactions between multiple amino acid residues and the oxygen atoms of erythromycin (Figure 2.5).[31] We postulated that installation of a sterically demanding ONB photocaging group would disrupt the hydrogen bonding between the protein and the ligand and prevent binding of erythromycin to MphR(A). The ONB group could then be removed by irradiation with UV light (365 nm), restoring erythromycin binding to MphR(A) and activating gene expression.
Yan Zou (Deiters Lab) synthesized the photocaged erythromycin 7 in two steps (Scheme 2.1) by reacting erythromycin 4 with hydroxylamine in the presence of triethylamine to obtain 9-oxime erythromycin 5. The 9-oxime derivative 5 was then reacted with the ONB-chloride 6 in the presence of potassium carbonate and acetone to yield 7.
Scheme 2.1. Synthesis of photocaged erythromycin 7.
resistance gene, mphA, is encoded on pJZ12 to allow for constant resistance to the antibiotic. The erythromycin-inducible mphR(A) promoter and the gene of interest are encoded on pMLGFP (Figure 2.6).
Figure 2.6. Two-plasmid system used in conjunction with photocaged erythromycin 7. pMLGFP encodes the mphR(A) promoter and the reporter gene, while pJZ12 encodes the mphA phosphotransferase. Adapted from Mol. BioSyst., 2011,7, 2554.
Figure 2.7. GFP expression in bacteria induced by erythromycin (4) (left) and the 9-oxime erythromycin (5) (right). Adapted from Mol. BioSyst., 2011,7, 2554.
Decaging of photocaged erythromycin 7 (1 µM) was then performed in liquid
cultures to determine the optimal amount of UV exposure. Cells containing pMLGFP and pJZ12 were grown to log phase (OD600 = 0.6) and induced with 5 or 7. Cells were then
Figure 2.8. Decaging of photocaged erythromycin. In the absence of UV irradiation, 7 does not activate GFP expression. After 5 minutes UV irradiation, 96% of GFP expression is restored. Error bars represent standard deviations from three independent experiments. Adapted from Mol. BioSyst., 2011,7, 2554.
To demonstrate that this system is applicable to multiple reporter genes, the LacZ
Figure 2.9. Erythromycin inducible LacZ reporter plasmid, provided by the Cropp Lab (VCU). Adapted from Mol. BioSyst., 2011,7, 2554.
To perform a Miller assay,[35] cells containing the LacZ plasmid and pJZ12 were grown to log phase at 37 °C, and then induced with either 5 (1 µM) or 7 (1 µM) . Cells were
then either irradiated for 5 minutes or kept in the dark, and then returned to 37 °C with
shaking for 6 hours. After 6 hours, cells were lysed and reacted with ortho- nitrophenyl-β-galactoside for 10 minutes to quantify β-galactosidase expression.[35] Miller units were
calculated according to the formula: 1000× (OD420-1.75×OD550)]/(T×V×OD600). T = time in
Figure 2.10. Miller assay to quantify β-galactosidase activity of E. coli induced with 9-Oxime 5 or photocaged erythromycin 7; +/- UV irradiation. Photocaged erythromycin 7 induction + UV irradiation restored β-galactosidase activity to levels of the positive control. Error bars represent standard deviations from three independent experiments. Adapted from Mol. BioSyst., 2011,7, 2554.
Spatial control was then attempted using the GFPuv reporter. LB agar plates, containing ampicillin and tetracycline were pretreated with 7 and allowed to dry. Cells containing the pMLGFP plasmid were seeded onto the plate, half the plate was covered with an aluminum foil mask, and the uncovered half was then irradiated for 5 minutes at 365 nm. The plate was then incubated overnight at 37 °C before visualization. Initial attempts of
Figure 2.11. Spatial control of GFPuv expression using a photocaged erythromycin 7. The left half of the plate was irradiated for 5 minutes at 365 nm, while the right half of the plate was covered with a mask. Adapted from Mol. BioSyst., 2011,7, 2554.
In order to address the autofluorescence issue, the GFPuv gene was exchanged for eGFP, a mutant form of the green fluorescent protein, that exhibits increased fluorescence and a significantly red-shifted excitation wavelength compared to GFP.[36] The plasmid pMLGFP was digested with SpeI and PmeI and purified by gel electrophoresis. The egfp
Figure 2.12. EGFP expression in a bacterial lawn exposed to (A) the 9-oxime erythromycin 5 and (B) the photocaged erythromycin 7 where half the plate was irradiated for 5 minutes at 365 nm. Adapted from Mol. BioSyst., 2011,7, 2554.
After demonstrating the MphR(A)/promoter in conjunction with 7 enables precise spatial and temporal control over gene expression, we then used this system to control bacterial signaling processes. Many of the modular components biological gene expression are analogous to engineered circuit devices. Genetic systems have previously been programmed to function as molecular computing devices, both in vitro[37,38] and in vivo.[39,40] In this context, logic gates are fundamental computational devices that generate outputs based on Boolean operations (AND, NOT, OR) between various inputs.[41] Recent developments in biological logic gates have paved the way for biological computing and engineering of synthetic biological circuits based on gene regulation.[1,37,42]
input signals and generates fluorescence emission at 509 nm as an output signal (O). The gate performs in agreement with its truth table (Figure 2.13), and thus sets the stage for the development of more complex photochemically controlled cellular circuits.
Figure 2.13. (A) Light-triggered bacterial AND gate and (B) truth table showing the resulting EGFP fluorescence imaged with a Typhoon scanner. Input I1 = excitation at 365 nm, input I2 = excitation at
483 nm, output O = emission at 509 nm. Adapted from Mol. BioSyst., 2011,7, 2554.
Another common circuit in logic devices is a band-pass filter.[43] Band-pass filters are commonly used in signal processing and concentration-dependent band-pass filters have been applied to mammalian cells to create stable gene expression patterns.[44] We hypothesized that our light-activated gene expression system could exhibit band-pass like behavior based on the fact that the reporter gene activity responds to the irradiation time in a dose-dependent fashion until a maximum response is reached. Additionally, prolonged irradiation will not further increase the signal, but in turn will reduce it to basal levels due to the toxicity of the extended UV exposure. To test our hypothesis, 7 (1 µM) was added to
W) for increasing periods of time, then allowed to express overnight. As expected, a band-pass shaped response was observed (Figure 2.14).
Figure 2.14. Irradiation-dependent band-pass filter of 7 based on EGFP expression. The band-pass filter is indicated in green. The fluorescence is normalized to the highest signal and the error bars represent standard deviations from three independent experiments. Adapted from Mol. BioSyst., 2011,7, 2554.
To ensure this dramatic decrease in gene expression after prolonged irradiation was due to toxicity of UV irradiation, Top10 E. coli cells were grown to log phase, irradiated for varying amounts of time and their OD600 monitored over a 24 h period (Figure 2.15). A
Figure 2.15. UV toxicity timecourse. Adapted from Mol. BioSyst., 2011,7, 2554.
2.3 Photochemical control of DNA recombination in bacterial cells
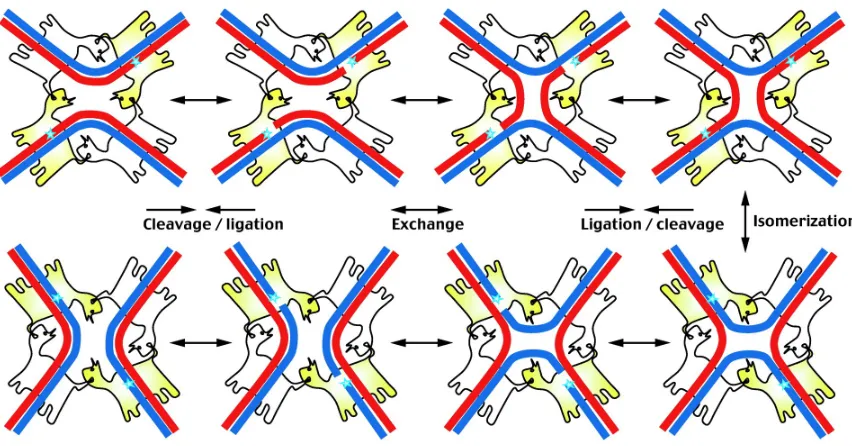
DNA recombination is essential to many processes in pro- and eukaryotic cells such as the development of the immune system, antibiotic resistance, maintaining plasmid copy number and the translocation of genetic elements.[46] Site-specific recombinase proteins mediate these recombination events by catalyzing strand exchange between defined DNA target sites.[47] Two recombinase DNA target sites are bound by a monomer of the enzyme. A catalytic residue in the enzyme active site then acts as a nucleophile to cause single strand cleavage at a phosphodiester bond of the DNA backbone on each DNA molecule. This reaction generates a new 3′ phosphotyrosine bond and a 5′ OH, which allows for strand
Figure 2.16. Site-specific recombination between double stranded DNA. Blue stars represent the catalytic center of the active recombinases (shown in yellow). Adapted from Annu. Rev. Biochem. 2006, 75, 567.
Figure 2.17. Cre DNA recombinase recognizes two, 34 base-pair loxP sites and either inverts, excises, or integrates the DNA between them; depending on their orientation. Adapted from ACS Chem. Biol. 2009, 4, 441.
Previously, several light-activated Cre enzymes have been developed, though photocaged hormones, a photocaged analogue of Cre, and a light inducible protein dimerization system.[50-52]
Cre has very low activity in E. coli, so to expand this technology to bacteria an alternative recombinase must be used. The S. cerevisiae Flippase recombinse (Flp), another member of the tyrosine family of recombinases, is analogous to Cre with the exception that it is functional in E coli as well as eukaryotic cells. Flp recognizes an 8 base-pair region flanked by two 13 base-pair sites, called frt sites, and excises/integrates or inverts the intervening DNA sequence. Construction of a photocaged version of Flp was also attempted in a similar manner to Cre, but protein could not be expressed (data not shown).
The pBAD33Flpe plasmid contains a thermostable copy of the recombinase under control of the arabinose inducible pBAD promoter.[54] The pBUI plasmid encodes a LacZ gene that is flanked by two frt sites. In the presence of arabinose, Flpe is expressed, the LacZ gene is excised and no β-galactosidase activity is observed (Figure 2.18).
Figure 2.18. Plasmids for assaying Flpe expression in E. coli. Addition of arabinose induces expression of Flpe, that will then excise the LacZ gene from between two frt sites. Without an origin of replication, the LacZ gene is lost and no β-galactosidase is expressed.
In the absence of arabinose, Flpe is not expressed, the LacZ gene remains in the pBU1 plasmid, and β-galactosidase activity is observed. The expression of Flpe can be easily detected in E. coli by blue and white screening, which requires the addition of X-Gal (5-bromo-4-chloro-3-indolyl-β-D-galactopyranoside) to the growth media. X-Gal is a substrate for β-galactosidase that turns from colorless to blue when cleaved by the enzyme.
over the previously described light-activatable Cre as it will be functional in E. coli as well as eukaryotes such as S. cerevisiae.
A photocaged arabinose will not only be applicable to the Flpe system, but to any system in which a pBAD promoter regulates gene expression. Arabinose-inducible systems function similarly to IPTG-inducible systems. In the absence of arabinose, the homodimeric AraC protein (encoded by araC) is binds DNA to form a loop slightly upstream of the promoter.[55] This DNA loop prevents RNAP from transcribing genes downstream of pBAD . In the presence of arabinose, the AraC protein binds the sugar and changes its conformation to allow RNAP to bind the promoter and begin transcription.
2.3.1 Synthesis of a photocaged arabinose
The 2-(2-nitrophenyl)propanol (NPP-OH) caging group was chosen as the photocaging group for arabinose over the traditional o-NB group for the following reasons: It has been reported that substitutions at the benzylic position lead to increases in photodeprotection rates,[56] and initial attempts to react arabinose with benzyl alcohol, 4-nitro benzyl alcohol and 2-4-nitro benzyl alcohol were unsuccessful.
Scheme 2.2. Synthesis of NPP-OH caging group.
Scheme 2.3. Synthesis of photocaged arabinose 14.
TLC confirmed decaging of compound 14 at a 1 mM concentration after 15 minutes of UV irradiation (handheld UV lamp, 365 nm).
2.3.2 In vivo control of DNA recombination with photocaged arabinose
Photocaged arabinose was then tested in E. coli for its ability to induce expression of genes under control of the arabinose-inducible pBAD promoter. Decaging was tested in Top10 cells transformed with pBADEGFP, which contains a copy of eGFP under control of pBAD. Cells were gown to log phase, and then induced with either arabinose 10 (100 µM) or
photocaged arabinose 14 (100 µM), and irradiated for 15 minutes at 365 nm. Cells were then
Figure 2.19. Decaging of photocaged arabinose 14 in liquid culture. Samples were irradiated for 15 minutes at 365 nm (25 W), followed by overnight protein expression. Fluorescence was measured by a Biotek Synergy 4 platereader (483/509 ex/em). Approximately 60% of fluorescence was restored after irradiation. Error bars represent standard deviations from three independent experiments.
Photocaged arabinose was then tested using the two-plasmid Flpe system.[53] pBAD33Flpe was transformed into competent cells harboring the plasmid pBUI and plated on LB agar plates containing the ampicillin (50 µg/mL) and chloramphenicol (34 µg/mL)
and pre-treated with either arabinose or photocaged arabinose (40 µL, 10 mM) and X-Gal (40
µL, 20% in DMF). One plate treated with photocaged arabinose was irradiated for 15
minutes. Plates were then incubated overnight at 37 °C. β-Galactosidase activity, and
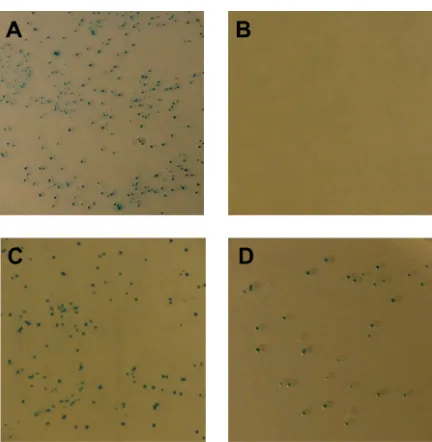
therefore Flpe expression, was measured by assessing the frequency of blue colonies. As expected, in the absence of any inducer molecule, β-galactosidase was expressed and
active Flpe was produced and no β-galactosidase was observed due to an intracellular recombination event (Figure 2.20 B). In the presence of photocaged arabinose 14, Flpe expression was blocked and β-galactosidase activity was inferred from blue colony color
(Figure 2.20 C). However, irradiated plates pre-treated with photocaged arabinose 14 did not show complete activation of Flpe expression, and appeared predominantly blue on X-Gal media (Figure 2.20 D).
Figure 2.20. Flpe recombination activity assay. A) No compound, B) arabinose 10, C) photocaged arabinose 14 -UV, D) photocaged arabinose 14 +UV (15 minutes).
minutes did not result in additional Flpe expression. After further investigation into the arabinose transport pathway, it was revealed that in bacterial cells arabinose undergoes an active transport pathway utilizing the AraE transport protein.[58,59] Thus, our photocaged arabinose is likely not recognized by the AraE protein and fails to enter the cell.
We then attempted to see if we could utilize a prodrug strategy to allow for passive transport of the photocaged sugar. Prodrugs are analogues of drugs molecules that are only activated in vivo and are used to alleviate solubility, membrane permeability or toxicity problems during drug delivery.[60] The most common form of chemical modification is the inclusion of esters functionalities to increase a drug’s lipophilicity. Ester bonds are often used to mask nucleophilic or charged functional groups and are easily cleaved in vivo by endogenous esterase enzymes.[60,61] Acetylated versions of various sugars have shown to have increased bioactivity over their free hydroxyl counterparts.[62,63]
We synthesized a simple tetra-acetylated version of L-(+)-arabinose in one step through reaction of the sugar with pyridine and acetic anhydride (Scheme 2.4).
The 1,2,3,4-tetra-O-acetyl-L-arabinopyranose (15) was then assayed for activation of gene expression in bacterial cells. E. coli containing pBADeGFP (Top10) were gown to log phase, and then induced with either arabinose 10 (100 µM) or 15 (100 µM) or uninduced.
Cells were then allowed to grow overnight before being harvested by centrifugation and lysed. Fluorescence was read on a plate reader (483/509 ex/em, Biotek Synergy 4 Microplate Reader) (Figure 2.21).
Figure 2.21. Arabinose controlled eGFP expression in bacterial cells.
2.4 Summary and Outlook
We have successfully used small molecules as a means to achieve photochemical control over genetic circuits at the transcriptional level. A photocaged erythromycin was developed to effectively achieve spatial and temporal control over gene expression and as a component of light-activatable switches in bacterial cells. The photocaged erythromycin and MphR(A)/promoter system can be translated into the construction of larger synthetic systems.
We have also successfully synthesized a photocaged analogue of the sugar arabinose as an additional means to photochemically control gene expression in E. coli through the control recombinase activity. We found that the photocaged arabinose was not able to fully restore gene expression levels in pBadsystems after irradiation, most likely due to the fact that arabinose is brought into E. coli through an active transport pathway. We believe the araE
2.5 Experimental Methods
Evaluation of erythromycin analogues. E. coli cells (GeneHogs DH10B) containing pJZ12 and pMLGFP were grown to saturation in LB broth containing ampicillin (50 µg/mL) and tetracycline (15 µg/mL). An aliquot (40 µL) was spread onto agar plates (10 cm) pre-treated with 40 µL of erythromycin or 9-oxime erythromycin (0.5 mg/mL in DMSO) and incubated overnight at 37 ºC, followed by visualization on a transilluminator (365 nm, 25 W).
Erythromycin decaging time course. E. coli (GeneHogs DH10B) containing pMLGFP and pJZ12 were grown at 37 °C overnight in LB media containing ampicillin (50 µg/mL) and
tetracycline (15 µg/mL). Cells were diluted 50-fold into a 25 mL culture and grown to OD600
= 0.6 at 37 °C. Compound (either caged erythromycin 4 or 9-oxime erythromycin 5 in
DMSO) was added to a final concentration of 1 µM. Cells (1 mL) treated with caged erythromycin were transferred to a 10 cm petri dish and irradiated at 365 nm for 30 sec, 1 min, 2 min, and 5 min. The cells were then transferred to a 96 well plate and grown for 12 hours at 37 °C, then pelleted by centrifugation and re-suspended in lysis buffer (100 µL, 50
mM Tris Base, 1 mM EDTA, 100 mM NaCl, 0.2% Triton X) and fluorescence was read on a plate reader (395/509 ex/em, Biotek Synergy 4 Microplate Reader).
and tetracycline (15 µg/mL). Cells were diluted 50-fold into a 25 mL culture and grown to OD600 = 0.6 at 37 °C. Compound (either caged erythromycin 7 or 9-oxime erythromycin 5 in
DMSO) was added to a final concentration of 1 µM. Half of the cells (1 mL) treated with caged erythromycin and 9-oxime erythromycin were transferred to a 5 cm petri dish and irradiated at 365 nm for 5 minutes, and the remainder of the cells were not irradiated. The cells were then grown for 6 hours at 37 °C, and the OD600 was recorded. Cells (100 µL) were
added to 900 µL of Z-buffer (60 mM Na2HPO4, 40 mM NaH2PO4, 20 mM KCl, 1 mM
MgSO4, 50 mM β-mercaptoethaonol), 25 µL of 0.1% SDS, 50 µL of CHCl3 and vortexed for
1 minute. O-nitrophenyl-β-D-galactoside (200 µL, 4 mg/mL) substrate was added to each sample and incubated at 30 °C for 10 minutes. Na2CO3 (500 µL, 1 M) was added to stop the
reaction. The absorption at 420 nm and 550 nm was recorded and Miller units were calculated using the following formula: (1000 × (Abs420 -1.75 × Abs550)/(reaction time in
minutes × final volume in mL × OD600). Error bars represent standard deviations of three
independent experiments.
Cloning of pMLEGFP. pMLGFP (3957 bp, 500 ng) was digested with SpeI and PmeI at 37
°C for 1 hour, and separated on a 1% argarose gel in TBE buffer at 80 V for 45 minutes. The
phosphorylated) primers (IDT). The PCR product was verified by gel electrophoresis with a band apparent at ~800bp, and was purified, digested with SpeI and purified again on an ion-exchange column (Qiagen). Digested pMLGFP (50 ng) was then ligated with the PCR-amplified EGFP in 1:6, 1:3, and 1:0 ratios using T4 DNA ligase (NEB). Ligations were performed at 4 °C overnight, and then transformed into GC5 competent cells. Clones from
the 1:6 ligation were sequenced to verify proper sequence and orientation of the EGFP gene. Positive clones were co-transformed into Top10 cells (genetically similar to DH10B) with pJZ12.
Bacterial logic gate. E. coli (Top10, Invitrogen) containing pMLEGFP and pJZ12 were at 37
°C overnight in LB media containing ampicillin (50 µg/mL) and tetracycline (15 µg/mL ).
Cells were diluted 50-fold into a 25 mL culture and grown to OD600 = 0.6 at 37 °C. 7 was
added to a final concentration of 1 µM. Cells that were to receive I1 were irradiated for 5
minutes (UVP High Performance Transilluminator, 365 nm, 25 W) in a petri dish (5 cm), and then were transferred to a 96 well plate, and grown overnight, as well as cells that were not irradiated. Cells were pelleted by centrifugation and resuspended in lysis buffer and were imaged on a Typhoon scanner.
with 7 or 5 (10 µL, 0.5 mg/mL in DMSO stock solution). Plates containing 7 were placed on a transilluminator (UVP High Performance Transilluminator, 365 nm, 25 W) and one half of the plate was covered with an aluminum foil mask. The other side of the plate was irradiated for 5 minutes at 365 nm. Plates were then incubated overnight at 37 °C, and then imaged for
EGFP expression. (Typhoon FLA 7000, GE; FAM filter 473 nm/[Y520]).
Bandpass filter experiment. E. coli (Top10, Invitrogen) containing pMLEGFP and pJZ12 were at 37 °C overnight in LB media containing ampicillin (50 µg/mL) and tetracycline (15
µg/mL). Cells were diluted 50-fold into a 25 mL culture and grown to OD600 = 0.6 at 37 °C.
7 was added to a final concentration of 1 µM to 15 mL of cells. 1 mL aliquots of cells were then transferred to separate petri dishes (5 cm) and irradiated for 0 sec, 1 sec, 10 sec, 100 sec, 500 sec, 1000 sec, 3000 sec and 4000 sec on a transilluminator (UVP High Performance Transilluminator, 365 nm, 25W), transferred to a 96 well plate and allowed to grow overnight at 37 °C. Cells were pelleted by centrifugation and resuspended in lysis buffer.
Fluorescence was read on a plate reader.
UV Toxicity Study. Top10 cells were grown in LB media to OD600 = 0.56 at 37 °C, and then
Synthesis of 2-(2-nitrophenyl)propanol (9). Triton B (40% in MeOH, 4.66 mL, 11.18 mmol) and paraformaldehyde (1.12 g, 37.30 mmol) were added to 2-ethylnitrobenzene 8 (1.00 mL, 7.46 mmol). The reaction mixture was heated under reflux for 24 h and then concentrated in vacuo. The reaction mixture was neutralized with HCl (1 M, 10 mL), and then extracted with EtOAC (3 × 10 mL). The combined organic layers were washed with saturated aqueous NaHCO3 (10 mL), brine (10 mL), dried over anhydrous Na2SO4, filtered
and concentrated in vacuo. The product was purified by silica gel chromatography eluting with hexanes/EtOAc mixture (4:1) to give 9 (550 mg, 40%) as a light yellow oil. The analytical data obtained matched reported literature (1H NMR, 13C NMR, CDCl3).[57]
Synthesis of 1,2,3,4-tetra-O-benzoyl-L-arabinopyranose (11). Triethylamine (3 mL, 21.52 mmol) was added at 0 ºC to a solution of L-(+)-arabinose 10 (500 mg, 3.33 mmol) and DMAP (0.5 mg, .004 mmol) in DCM (2 mL). Benzoyl chloride (2.3 mL, 19.95 mmol) was added to the reaction mixture at 0 ºC over 5 min. The reaction was stirred at r.t. overnight and then quenched with MeOH (1 mL) at 0 ºC. The solvent was then evaporated in vacuo and the reaction mixture was resuspended in EtOAc (15 mL). The solution was then washed with aqueous HCl (15 mL, 1M), saturated aqueous NaHCO3 (15 mL), and brine (15 mL), and then
dried over anhydrous Na2SO4, filtered and concentrated in vacuo. The product was purified
(1.47 g, 86%) as a light yellow solid. The analytical data obtained matched reported literature (1H NMR, 13C NMR, CDCl3).[64]
Synthesis of 2,3,4-tri-O-benzoyl-α-bromo-L-arabinopyranose (12). 1,2,3,4-tetra-O -benzoyl-L-arabinopyranose 11 (500 mg, 0.88 mmol) was dissolved in DCM (2.3 mL) and 200 µL of HBr (33% in AcOH) was added dropwise to the solution at 0 ºC. The reaction was
stirred at 0 ºC for 2 h, and then diluted in DCM (15 mL), washed with ice water (10 mL), saturated aqueous NaHCO3 (10 mL) and brine (10 mL) and dried over anhydrous Na2SO4.
After filtration, the solvent was evaporated in vacuo to yield 12 as an off-white sticky solid (335 mg, 72% yield). The analytical data obtained matched reported literature results (1H NMR, 13C NMR, CDCl
3).[64]
Synthesis of 2,3,4-tri-O-benzoyl photocaged arabinose (13). 2,3,4-tri-O-benzoyl-α -bromo-L-arabinopyranose 12 (100 mg, 0.19 mmol) was dissolved in DCM (500 µL) and
cooled to 0 ºC. Silver trifluoromethanesulfonate (98 mg, 0.38 mmol) was added to the solution and the reaction mixture was stirred for 5 min at 0 ºC. 2-(2-nitrophenyl)propanol 9 (52 mg, 0.29 mmol) was added at 0 ºC, and the reaction mixture was stirred in the dark. After 36 h, the reaction was diluted in DCM (5 mL), washed with saturated aqueous NaHCO3 (5
mL), brine (5mL) and dried over anhydrous Na2SO4. The product was purified using silica
3.58-3.78 (m, 2H), 3.86 (d, J = 5.4 Hz, 2H), 3.90-3.99 (m, 1H), 5.30 (dd, J1 = 9.9 Hz, J2 = 3.6 Hz, 1H), 5.65-5.69 (m, 2H), 5.82-5.90 (m, 1H), 7.19-7.60 (m, 15H), 7.82-7.90 (m, 2H), 7.97 (d, J = 6.9 Hz, 1H), 8.08 (d, J = 6.9 Hz, 1H). LRMS: m/z calcd for (C35H31NO10) [M+Na]+:
648.99; found: 648.20
Synthesis of photocaged arabinose (14). 2,3,4-tri-O-benzoyl photocaged arabinose 13 (45 mg, 0.07 mmol) was dissolved in DCM (400 µL). In a separate vial NaOMe (14 mg, 0.26
mmol) was dissolved in 100 µL MeOH, and the solution was added to the first solution and
stirred at r.t. for 16 h. The reaction mixture was then neutralized with Dowex ion exchange resin (50WX8 50-100 mesh). The resin was filtered and washed with DCM and the combined washings were concentrated in vacuo. The product 14 was crystallized from ether as a white solid (13 mg, 56% yield). 1H NMR (400 MHz, CD3OD): δ = 1.36 (dd, J1 = 7.5 Hz,
J2 = 4.5 Hz, 3H), 3.19 (m, 1H), 3.40 (dd, J1 = 6.5 Hz, J2 = 0.9 Hz, 2H), 3.55-3.70 (m, 3H), 3.78-3.80 (m, 2H), 4.71-4.74 (m, 1H), 7.38-7.42 (m, 1H), 7.62-7.64 (m, 2H), 7.71-7.72 (m, 1H). 13C NMR (300 MHz, CD3OD): δ = 16.9, 34.2, 63.0, 68.9, 69.4, 72.5, 73.2, 99.8, 123.5,
127.2, 128.3, 128.6, 132.4, 137.7. LRMS: m/z calcd for (C14H19NO7) [M+Na]+: 336.11;
found: 336.10.
samples for TLC after each time point. Samples were then run on TLC (MeOH:DCM 1:9) and visualized with a UV lamp. Complete decaging was observed after 15 min, with ~50% decaging observed after 5 min.
Decaging of photocaged arabinose in bacterial cells, liquid culture. E. coli (Top10) containing pBAD-eGFP were grown at 37 °C overnight in LB media containing ampicillin
(50 µg/mL). Cells were diluted 50-fold into a 25 mL culture and grown to OD600 = 0.6 at 37
°C. Compound (either 10 or 14 in DMSO) was added to a final concentration of 100 µM.
Cells (4 mL) containing either arabinose, caged arabinose or no compound were transferred to a 10 cm petri dish and irradiated for 15 minutes (UVP High Performance Transilluminator, 365 nm, 25W). After irradiation the cells were grown in a 96-deep well block and incubated overnight at 37 °C, their OD600 read, then pelleted by centrifugation and re-suspended in lysis
buffer (100 µL, 50 mM Tris Base, 1 mM EDTA, 100 mM NaCl, 0.2% Triton X) and fluorescence was read on a plate reader (483/509 ex/em, Biotek Synergy 4 Microplate Reader). The fluorescence was normalized to OD600.
Decaging of Photocaged Arabinose in Bacterial Cells, on agar plates. E. coli (Top10) containing pBAD-eGFP were grown at 37 °C overnight in 3 mL LB media containing
Transilluminator, 365 nm, 25W). All plates were then incubated overnight and fluorescence was visualized on a Typhoon scanner (Typhoon FLA 7000, GE; FAM filter 473 nm/[Y520]).
Flpe Recombination Activity Assay in Bacterial Cells. Plasmids pBUI and pBAD33Flpe were transformed into Top10 cells and plated on media containing ampicillin (50 µg/mL) and chloramphenicol (34 µg/mL). A single colony containing both plasmids was inoculated into 3 mL of LB containing ampicillin (50 µg/mL) and chloramphenicol (34 µg/mL) and grown overnight at 37 °C. Agar plates containing ampicillin (50 µg/mL), chloramphenicol (34
µg/mL) and preteated with 40 µL X-Gal (20% in DMF) and either 10 µL of 10 or 14 (100
µM) were prepared. After the plates had been allowed to dry, one plate treated with photocaged arabinose was irradiated on a transilluminator for 15 min (UVP High Performance Transilluminator, 365 nm, 25W). After irradiation, 10 µL of a 1:1000 dilution of the overnight culture was plated on the plates and incubated overnight at 37 °C. Plates
were then stored at 4 °C for 4-6 h to develop the blue color, and then photographed.
Synthesis of 1,2,3,4-tetra-O-acetyl-L-arabinopyranose (15). Pyridine (1.06 mL, 13.33 mmol) was added to a solution of L-(+)-arabinose 10 (800 mg, 5.33 mmol) and catalytic DMAP (0.5 mg, 0.004 mmol) in DCM (3 mL) at 0 ºC. Acetic anhydride (3.00 mL, 31.79 mmol) was added at 0 ºC over 5 min to the solution. The reaction mixture was stirred at r.t. overnight and then diluted in saturated aqueous NaHCO3 (10 mL) and extracted with Et2O
dried over anhydrous Na2SO4, filtered and the solvent was evaporated in vacuo yielding 15
as white sticky solid (1.68 g, 99% yield). The analytical data obtained matched reported literature (1H NMR, 13C NMR, CDCl3).[65]
Activation of gene expression via an acetylated arabinose prodrug. E. coli (Top10) containing pBADeGFP were grown at 37 °C overnight in LB media containing ampicillin
(50 µg/mL). Cells were diluted 50-fold into a 10 mL culture and grown to OD600 = 0.6 at 37
°C. Compound (either 10 or 15) was added to a final concentration of 100 µM. The cells
were grown in a 96-deep well block and incubated overnight at 37 °C, then pelleted by
CHAPTER 3 – UNNATURAL AMINO ACID MUTAGENESIS
3.1 Introduction to unnatural amino acid mutagenesis
Proteins are essential molecules in living cells. Examples of proteins are enzymes, antibodies, toxins and they are involved in signal transduction, transcription, cell motility and numerous other cellular functions.[66] Though the number and functions of proteins is vast, natural proteins are comprised of only the 20 canonical amino acids (and in some rare cases selenocysteine and pyrrolysine) that are encoded by 61 3-base codons. These 20 amino acids suffice for some proteins, but many proteins must undergo post-translational modifications such as methylation, phosphorylation, and glycosylation.[67] By expanding the genetic code of prokaryotes and eukaryotes with new amino acids we will gain great insight into protein structure and function as well as develop enhanced proteins with novel biological properties.[67,68]
Additionally, proteins represent excellent targets for the engineering of light-activated cellular networks as site-specific modification of active residues can be achieved through the
Previous methods of introducing amino acids outside of the 20 natural amino acids (termed ‘unnatural’ amino acids) into proteins required in vitro methods such as solid phase peptide synthesis or the injection of chemically-acylated tRNAs into living cells.[67] These methods allowed for the development of novel proteins, but have various limitations. For instance, solid phase peptide synthesis can only yield proteins of limited size and the injection of chemically-misacylated tRNAs is limited by the stoichiometric amount of aminoacylated tRNA available as it cannot be reacylated in vivo.
As a requirement for selective UAA incorporation, a tRNA/aaRS pair must be evolved to be orthogonal to all endogenous tRNA/aaRS pairs of the host cell (Figure 3.1). An orthogonal pair requires that the synthetase only charges its cognate tRNA with the unnatural amino acid of interest and the tRNA is not acylated by any other aaRS naturally occurring in the host organism.[75] The engineered synthetase will charge its tRNA with the unnatural amino acid for incorporation into the growing polypeptide chain by the ribosome, in response to an amber stop codon, UAG.
To incorporate UAAs into proteins in vivo, a two-plasmid system is often used for prokaryotic systems.[76] One plasmid encodes the evolved synthetase and its corresponding suppressor tRNA. The second plasmid contains the gene of interest, usually under control of an inducible promoter, which has a codon mutated to the amber stop codon. Without amber suppression, the resulting protein will be truncated. To express full-length protein, the two plasmids must be co-transformed into cells and grown in media containing the unnatural amino acid.[76]
Previous UAAs that have been incorporated have introduced much new functionality to proteins including photocrosslinking moieties, fluorophores, bioconjugation handles and photocaged amino acids.[68] Various photocaged amino acids have been incorporated into E. coli and S. cerevisiae.[70,77] Using this technology, the Deiters lab has developed a variety of photocaged proteins that can be controlled with light.[51,78-80]
3.2 Incorporation of photocaged thio-tyrosine for novel bioconjugation reactions
synthetase pair could be engineered that would selectively incorporate the UAAs. After decaging, the fluorinated tyrosine residues were then revealed.
We hypothesize that by using a photocaging group as a mask; as well as a means for spatiotemporal control over protein function, we will be able to incorporate thio-tyrosine 17 into proteins. After irradiation of the photocaged thio-tyrosine 16, a thio-tyrosine residue is generated (Scheme 3.1) Thio-tyrosine contains a thiophenol which is known to have an increased nucleophilicity and acidity compared to phenol.[83]
Scheme 3.1. Light activation of photocaged thio-tyrosine (PCSY) to yield thio-tyrosine 17. The amino acid 16 was synthesized by Rajendra Uprety (Deiters Lab).
in our lab by Rajendra Uprety: a fluorescent probe 18 for labeling and a PEG 19 for protein stabilization (Figure 3.2).
Figure 3.2. Thio-reactive linkers; fluorescent dansyl 18 and PEG 19.
Thio-tyrosine was first incorporated into the small protein ubiquitin (8 kDa) using the pSUP-E10 plasmid. This plasmid, developed by the Schultz lab,[76] contains 6 copies of the tRNA gene and one copy of a mutated ONBY synthetase (evolved by the Cropp Lab at VCU).[81] To test protein expression, BL21(DE3)PLysS cells harboring pSUP-E10 and pETUbK48TAG were grown in LB media containing chloramphenicol (34 µg/mL) and
ampicillin (50 µg/mL) to log phase, then ONB-tyrosine (ONBY) or PCSY 16 were added to
Figure 3.3. SDS-PAGE of ubiquitin expression. Lane 1: Molecular weight ladder. Lane 2: no amino acid added. Lane 3: 1 mM ONBY. Lane 4: 1 mM PCSY 16.
Initial studies revealed that PCSY was incorporated with similar fidelity to ONBY. The E10 synthetase gene was then cloned into the more efficient pEVOL plasmid.[84] The pEVOL system differs from the original pSUP system in the number of synthetase genes and tRNA genes. pEVOL contains two copies of the synthetase gene; one inducible and one constitutively expressed, and only one copy of the tRNA gene. pEVOL-E10 was created by exchanging the two copies of the ONBY synthetase from pEVOL-ONBY for the E10 synthetase genes. Putative clones were sequenced to confirm both copies of the E10 gene were in proper alignment and orientation. A positive clone was then transformed into BL21G cells and made competent for further experiments.
We then attempted to incorporate 16 into myoglobin, another small (17 kDa) protein, with a TAG site engineered on the surface of the protein. A solvent accessible location for the thio-tyrosine residue is essential for bioconjugation reactions. pET24MyoD4TAG was transformed into BL21G cells harboring pEVOL-E10, and protein expression was conducted in LB media (pH = 7.4) containing chloramphenicol (34 µg/mL), kanamycin (50 µg/mL),
and either ONBY or PCSY 16 (1 mM). Protein expression was induced at log phase (OD600≈
purified on Ni-NTA resin, followed by analysis on a 12% SDS PAGE gel stained with coomassie blue (Figure 3.4).
Figure 3.4. SDS-PAGE of myoglobin expression. Lane 1: Molecular weight ladder. Lane 2: no amino acid. Lane 3: 1 mM ONBY. Lane 4: 1 mM PCSY 16.
Initial protein expression yielded very low amounts of myoglobin (<1 mg/L expression culture). Changes in plasmid systems (between pSUP-E10 and pEVOL-E10), expression times, temperature, IPTG concentration, amino acid concentration, pH, media and purification methods failed to give significant amounts of myoglobin.
We then used the pEVOL-E10 system to express T7 RNA polymerase (T7RNAP, 99 kDa). pBH161Y639TAG, a plasmid containing a 6X his-tagged T7RNAP mutated to contain an amber stop codon,[79] was transformed into BL21G cells containing pEVOL-E10. Cells harboring both plasmids were then used to inoculate 25 mL of LB media containing ampicillin (50 µg/mL) and chloramphenicol (34 µg/mL), and either ONBY or PCSY 16 (1
mM). Cells were grown to log phase (OD600 = 0.6), and protein expression was induced with
harvested by centrifugation, lysed and protein was purified on a Ni-NTA resin. Samples were analyzed on a 12% SDS-PAGE gel stained with coomassie blue (Figure 3.5).
Figure 3.5. SDS-PAGE of pEVOL-E10 + pBH161Y639TAG T7RNAP protein expression. Lane 1: Molecular weight ladder, Lane 2: no amino acid, Lane 3: 1 mM ONBY, Lane 4: 1 mM PCSY 16.
Figure 3.6. Radioactively labeled RNA synthesis by wild-type T7RNAP or photocaged T7RNAP. Lane 1-3: WT T7RNAP, Lane 4: photocaged T7RNAP 0 min UV, Lane 5: photocaged T7RNAP 1 min UV, Lane 6: photocaged T7RNAP 2 min UV, Lane 7: photocaged T7RNAP 5 min UV, Lane 8: photocaged T7RNAP 10 min UV, Lane 9: photocaged T7RNAP 15 min UV, Lane 10: photocaged T7RNAP 20 min UV.
We then returned to the protein ubiquitin for bioconjugation studies. The previous ubiquitin expression plasmid, pETUbK48TAG, did not contain a 6X his-tag for facile nickel affinity chromatography. A 6X his-tagged UbK48TAG was supplied to us from our collaborators in the Cropp lab (VCU). Unfortunately, protein expression levels of ubiquitin with PCSY were similar to that of myoglobin using either pSUP-E10 or pEVOL-E10 (Figure 3.7). Bioconjugation studies are being currently carried out with PCSY 16 in the Cropp lab.