SHIRLEY, JAMES DANIEL. Effects of Dynamic Automation Function Allocations on Operator Situation Awareness and Cognitive Workload in UAV Control. (Under the direction of Dr. David Kaber).
As unmanned aerial vehicles (UAVs) become increasingly more complex in functional capabilities, system designs place increasing attentional and information processing demands on operator(s). These issues will be exacerbated by an interest in multiple vehicle control by
Cognitive Workload in UAV Control.
by
James Daniel Shirley
A thesis submitted to the Graduate Faculty of North Carolina State University
in partial fulfillment of the requirements for the degree of
Master of Science
Industrial Engineering
Raleigh, North Carolina 2018
APPROVED BY:
____________________________ ______________________________ Dr. David Kaber Dr. Karen Chen
Chair of Advisory Committee
ii BIOGRAPHY
James Shirley earned his Bachelor of Science in Industrial Engineering at North Carolina State University in 2016. During his junior year of undergraduate study, he began working as a research assistant in the Ergonomics Lab at NC State through the direction of Dr. David Kaber. Upon graduation, he received a fellowship appointment from the National Institute for
iii ACKNOWLEDGMENTS
First and foremost, I would like to express my sincerest gratitude to Dr. David Kaber for his invaluable guidance and advice throughout both my undergraduate and graduate student career. He was always able to answer my questions, even when I couldn’t find the right words to describe the problem.
Next, I would like to thank Dr. Karen Chen and Dr. Jing Feng for graciously serving on my committee and taking such an interest in my thesis work. I would also like to thank Wenjuan Zhang, Yulin Deng, and Na Young Kim, who assisted in bringing this research to fruition. In particular, I’ll always appreciate Wenjuan teaching me so many little time saving tools around the office, even down to setting up Doodle polls.
I’d like to thank all of the friends that I’ve met in graduate school, including: Amy Wadeson, David Feltner, and Tyler Rose, who have graduated. I also thank Melissa White, Joseph Agor, Kyle Hovey, Kyle Parret, Sidd Nambiar, Katy Smith, and Lena Abu El Haija who will be graduating soon. I’ll never forget the lunch runs across Hillsborough Street and the long nights working on assignments that should have been started earlier.
iv TABLE OF CONTENTS
LIST OF TABLES ... vi
LIST OF FIGURES ... vii
INTRODUCTION... 1
1.1 Background ... 1
1.2 Classification of Levels of Automation ... 2
1.3 Human “Out-of-the-Loop” Performance Problems ... 3
1.4 Review on Adaptive Automation Functions ... 4
1.5 Problem Statement ... 6
METHODOLOGY ... 7
2.1Participants ... 7
2.2 Apparatus ... 8
2.2.1Software ... 8
2.2.2 Workstation Setup ... 10
2.3 Mission Scenarios ... 11
2.3.1 Flight Path ... 12
2.3.2 Environmental Icons ... 13
2.3.3 Named Areas of Interest ... 13
2.3.4 In-Flight Parameters... 14
2.3.5 Scenario Structure ... 15
2.4 Tasks ... 16
2.4.1 Situation Awareness Queries ... 16
2.4.2 Subjective Workload Ratings ... 17
2.4.3 Aircraft Detection ... 18
2.4.4 Alarm Handling ... 19
2.4.5 Flight Arrival Time Calculation... 20
2.5 Experimental Design ... 21
2.6 Independent Variables ... 22
2.7 Dependent Variables ... 22
2.8 Hypotheses ... 23
2.9 Procedure ... 24
2.10 Data Analysis ... 26
RESULTS ... 28
3.1 Situation Awareness... 28
3.2 Workload... 29
DISCUSSION ... 31
4.1 Situation Awareness... 31
4.2 Workload... 33
CONCLUSIONS ... 35
5.1 Application ... 35
5.2 Limitations ... 35
5.3 Future Work ... 36
REFERENCES ... 37
APPENDICES ... 40
vi LIST OF TABLES
Table 1.1 “Hierarchy of levels of automation applicable to dynamic cognitive and
vii LIST OF FIGURES
Figure 2.1 Mission Planner interface ... 9
Figure 2.2 Prototype interface ... 9
Figure 2.3 Physical apparatus setup ... 11
Figure 2.4 Scenario 1 ... 12
Figure 2.5 Environmental icons ... 13
Figure 2.6 Generic scenario timeline ... 15
Figure 2.7 Situation awareness query screen ... 16
Figure 2.8 Subjective workload prompt screen ... 17
Figure 2.9 An example of a completed aircraft detection task at hard difficulty ... 18
Figure 2.10 An alarm notification window ... 19
Figure 2.11 A flight arrival time message window ... 21
Figure 3.1 Mean aircraft detection accuracy for different automation modes ... 28
Figure 3.2 Mean change in SA query accuracy when transitioning from hard to easy ... 29
Figure 3.3 Mean flight projection accuracy for different automation modes ... 30
1 INTRODUCTION
1.1 Background
Unmanned aerial vehicles (UAVs) are becoming more complex as a result of increasing functionality and information processing capabilities. As a result, ground control stations (GCSs) and vehicle control interfaces have also increased in physical size and complexity in order to provide pilot(s) with all information necessary to fly craft safely and ensure mission success. Many military UAVs also require multi-personnel teams to maintain, launch, and pilot a UAV platform. The complexity of a platform and need for team coordination can place substantial physical and mental demands on operators, particularly while the vehicle is in-flight. In response, many platforms have implemented automation as a method for offloading low-level control functions from a pilot. Automation has been widely applied, particularly, to information
acquisition tasks, such as vehicle system monitoring. This allows pilots to focus on higher-level decision-making tasks. Advances in automation have also allowed for the introduction of decision-based automation, such as target identification and mission scheduling, which has further pushed the UAV pilot into the role of a supervisory controller (Clauss, 2014).
Recognizing the advances of automation, the US military is seeking to increase the number of UAVs controlled or supervised by a single operator (Office of the Secretary of Defense, 2005). An objective is to utilize automation to reduce the current manpower
2 Barnes, and Harper-Sciarini, 2011). Specifically, pilot over reliance on automation functions and features can lead to severe reductions in situation awareness and “out-of-the-loop” performance problems (Endsley and Kiris, 1995). While some research has looked into rectifying this issue through interface design, common fixes have focused on fixed level of automation manipulations (Chen, Barnes, and Harper-Sciarini, 2011; Miller and Parasuraman, 2007). Related to this, some researchers have called for investigation of the utility of dynamic automation function allocations or adaptive automation to support operator SA in such complex systems control (Kaber et al., 2006; Hou et al., 2011).
1.2 Classification of Levels of Automation
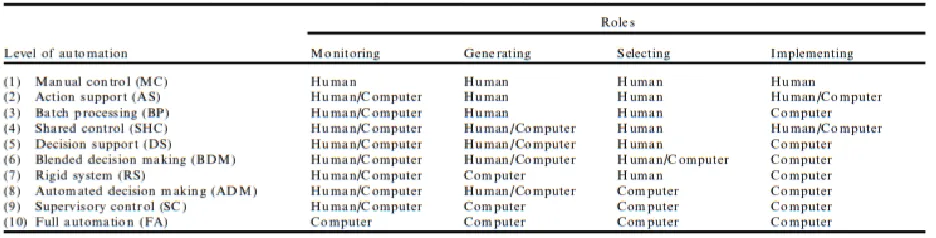
Before addressing human performance problems associated with use of highly automated systems, it is necessary to define levels of automation (LoAs), ranging from low, intermediate, to high automation. Endsley and Kaber (1999) developed a taxonomy of LoAs (Table 1.1), based on prior research by Sheridan and Verplanck (1978) that focused on defining forms of computer aiding and functions for supporting humans in control of teleoperated systems.
Table 1.1 “Hierarchy of levels of automation applicable to dynamic cognitive and psychomotor control task performance” (Kaber and Endsley, 1999).
The LoAs in Endsley and Kaber’s (1999) taxonomy represent a general progression of system automation sophistication from manual control to “full automation” by distributing the information processing functions of “monitoring” system states, “generating” options,
3 studies (e.g., Kaber and Endsley, 2004), considered levels 2-3 as low automation and levels 9-10 as high automation, with levels 4-8 serving as intermediate automation. Level 1 (i.e., manual control) was not considered to represent automation because no automation features are present in the system.
Kaber and Endsley (2004) compared their taxonomy with another taxonomy from
Parasuraman, Sheridan and Wickens (2000) that focused on the allocation of automation, or lack thereof, to four system functions, including: information acquisition, information analysis, decision selection, and action implementation. These system functions were very similar to the information processing functions that Endsley and Kaber (1999) identified. Parasuraman, Sheridan, and Wickens (2000) suggested that an optimal LoA, or generalized assignments of functions to an operator and machine, could be chosen based on human performance outcomes as well as automation reliability and risks.
Unfortunately, UAV control and mission tasks are rarely of the same type and typically require human performance of different information processing functions at various times. This poses a need for altering the allocation of functional responsibilities to a computer and human operator over time in order to maintain optimal performance. In this case, adaptive automation may provide a promising alternative for addressing human “out-of-the-loop” performance problems associated with high LoAs, as discussed in the next section.
1.3 Human “Out-of-the-Loop” Performance Problems
In many highly automated systems, automated functions fail to convey critical
4 example, a UAV target recognition subsystem may have the capacity to detect moving objects on the ground and to classify objects as “friendly” or “hostile” but the subsystem may not provide any information on why a target is labelled as hostile. A human operator, on the other hand, may need more information to verify a hostile or friendly presence, such as target shape or the pattern of target movement, or other visible qualities. In other situations, when the UAV operator is simply reliant on the automation, without questioning the basis for certain system states, if an off-nominal event occurs, they may be caught in a state of degraded situation awareness. This can lead to time delays in acquiring the necessary information to make a decision (Endsley, Onal, and Kaber, 1997) as well as errors in action.
High automation can also promote operator over trust of a system and pilot disconnecting from tasks that they presume are reliably managed by automation. They may also ignore mission information that they do not deem relevant to their own task performance. Consequently, other research has shown that when automated system do fail, operators are less likely to trust those system in the future for the same or similar tasks and they will second-guess or double-check displayed system outputs (Ruff, Narayanan and Draper, 2002; Calhoun, Draper, and Ruff, 2009). This situation can undermine the intended objective of automation features for reducing operator workload and increasing accuracy and reliability of system performance.
1.4 Review on Adaptive Automation Functions
5 automated functions. Related to this, some research has focused on dynamic function allocations (DFAs), or switching responsibility for tasks between the automation and a human operator, over time to improve performance (Kaber and Endsley 2004). Also referred to as adaptive
automation, a number of studies have demonstrated the benefits of DFAs in various systems. In a piloting and image analysis task simulation, Calhoun et al. (2011) noted that adaptive automation improved mission performance while reducing overall pilot cognitive workload. Kaber et al. (2006) found that adaptive automation was effective for supporting low-level information processing functions (i.e. information acquisition and basic actions) in an air traffic control-like simulation. Many of the tasks that have been investigated in previous studies of adaptive
automation (e.g. piloting tasks, radar monitoring, etc.) are very similar to UAV operational tasks. Regarding the switching of function allocations during system performance, Afergan et al. (2014) conducted a study utilizing brain signals as a way to determine when to increase or decrease the number of UAVs that an operator was responsible for monitoring. The authors increased or decreased simulated UAV control task difficulty when operators indicated signs of boredom or high workload, respectively. Their results indicated that this adaptive system behavior reduced the number of vehicle collisions and improved error detection rates over non-adaptive automation conditions.
It should be noted, that despite the number of studies applying adaptive automation to UAV control tasks, adaptive automation itself is most often applied to information analysis tasks rather than decision-making tasks. This situation suggests a need for further research on
6 1.5 Problem Statement
The aim of this thesis research was to demonstrate the potential for DFAs in a UAV control simulation to reduce operator workload (i.e., the benefits of automation use) while
improving pilot situation awareness (SA; i.e., avoiding the out-of-the-loop performance problem) in multitasking scenarios with decision-making tasks. Regarding the US military interest in achieving single pilot control of multiple UAVs, research has typically indicated that human performance issues increase with an increasing number of UAVs under supervisory control at any given time (Calhoun, Draper, and Ruff, 2009; Chen, Barnes, and Harper-Sciarini, 2011; Ruff, Narayanan, and Draper, 2002). As such, the present research only addressed a 1:1 vehicle-to-human ratio so as not to confound results with known human factors issues. In addition to the literature reviewed above, an experiment was designed and conducted to collect human
performance measures under various UAV automation conditions. The experiment was to provide a basis for assessing the utility of DFAs for workload and SA management.
7 METHODOLOGY
2.1 Participants
UAVs are utilized in a broad marketspace, ranging from civilian applications to military battlefield operations. Due to this variety in application, UAV GCSs and vehicle designs are diverse and many individual features depend on the platform in use. However, a substantial amount of prior research has focused primarily on military vehicles. With this in mind, the present study focused on a sample with some military experience. NC State offers three Reserve Officers’ Training Corps (ROTC) programs: Army, joint Navy/Marine Corps, and Air Force. Participants were recruited from the ROTC programs at NC State to better simulate the demographics and decision-making behaviors of pilots of military UAVs. A convenience sample was drawn from these programs.
During initial planning for the experiment, a power analysis revealed that 24 participants would be required to achieve statistical sensitivity to automation manipulations. (The power analysis was conducted based on pilot study data of six participants.) These 24 participants (23 male, 1 female; mean age = 20.3 yrs., S.D. = 2.5) were recruited from the three branches of the local NC State ROTC. Participants were required to have 20/20 or corrected vision, no colored vision impairment, familiarity with the general usage of computers, and active status as an ROTC student in order to take part in the study. Gender balancing was not pursued in execution of the experiment, as individual differences in responses to the human-computer interaction tasks were not expected to be significant.
8 experience with UAV GCSs. Among the participants, 22 reported no prior experience with or knowledge of GCS software. One participant reported hearing of GCS software but no personal use of it. One participant reported limited experience with a GCS, but indicated it was a civilian platform.
2.2 Apparatus 2.2.1 Software
The UAV GCS simulation used in the experiment was a prototype based on the ArduPilot Mission Planner software. ArduPilot is a series of open source, inboard UAV autopilot
electronics with firmware that can control platforms ranging from fixed-wing aircraft to vertical takeoff and landing craft. In 2009, the first boards were developed and released into the public domain by 3DRobotics (Berkley, CA). In 2010, the Mission Planner software was released as an associated GCS in order to provide operators with real-time vehicle feedback and control
options. While not directly developed or utilized for military applications, both the ArduPilot electronics and the Mission Planner GCS are used for professional surveying and imaging purposes, which are similar to military reconnaissance missions. Furthermore, the GCS features of the Mission Planner software mirror those that would be found in military UAVs (e.g. primary flight display, digital flight instruments, multi-function control and display units, etc.).
9 specific aspects of mission scenarios that participants were asked to monitor. Furthermore, a dedicated task bar and emergency control menu were included to support aircraft detection, time calculation, and alarm handling tasks, which participants were required to complete during the experiment. Specific details on these in-flight tasks can be found in Section 2.4. This interface configuration was held fixed throughout all of the experimental trials as part of this research, so the overall design and usability was not expected to have an influence on response measures for various modes of vehicle control automation.
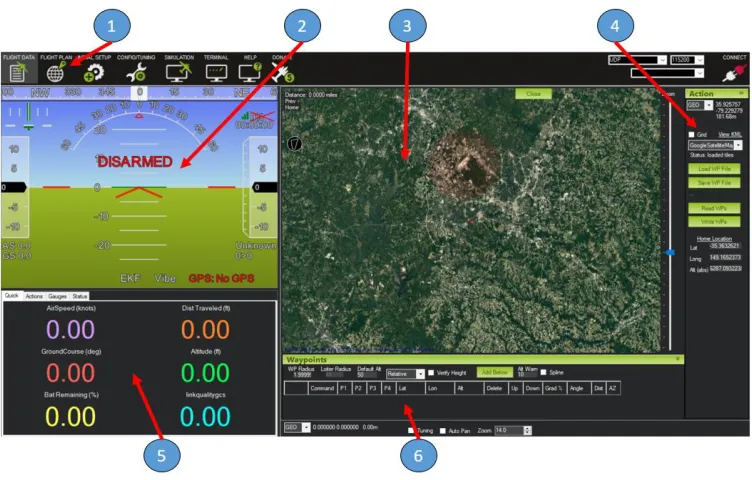
10
Figure 2.2: Prototype interface - (1) primary flight display (PFD), (2) mission map, (3) emergency controls, (4) flight parameter display, (5) waypoint display table, (6) mission task bar.
Camtasia (Okemos, Michigan) recording software was used to create screen recordings of participant interactions with the simulation software. This recording software also allowed for audio capture of participant verbal responses to situation awareness (SA) queries posed during test trials (see Dependent Variables section (2.7)). Camtasia did not introduce any visual
elements to the interface but instead ran in the background during experiments. Video recordings of the participants were not captured as they were not considered necessary for the performance evaluations.
2.2.2 Workstation Setup
11 (See Figure 2.3). They were allowed to move items on the table to make the setup more
comfortable and could adjust the position of their seat as well. This setup was isolated from experimenters via office-like cubicle walls. The monitor in front of the participants displayed the prototype interface and the mission scenarios. This monitor served as a ‘duplicate display’ for a secondary laptop used by the experimenters and was located out of participant view on the other side of the cubicle walls. In general, the setup allowed experimenters to monitor participant interactions with the simulation in real time and begin or terminate mission scenarios when necessary. Participants used the mouse and keyboard to interact with the simulation directly as required by the mission scenario tasks. A pen and paper was provided for use in time calculation task in the case that participants were unable to complete the task mentally. Participants were only allowed to use the pen and paper for the calculation task and were instructed not to use it for writing down UAV parameters, flight waypoint information and other scenario data.
Figure 2.3: Physical apparatus setup.
2.3 Mission Scenarios
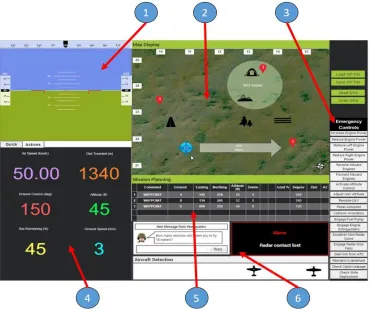
12 named areas of interest (NAIs), flight parameters, situation awareness (SA) queries, and in-flight tasks. The following sections present information on each of these scenario features. SA queries and the in-flight tasks are discussed in Section 2.4. The order in which the scenarios were presented is discussed in Section 2.5. Figure 2.4 shows an image of the prototype interface for Scenario 1, which will be used as an example reference in discussion of the various scenario features.
Figure 2.4: Scenario 1
2.3.1 Flight Path
13 The UAV flew directly to each of the five waypoints in numerical order before returning to the launch point. Waypoints along the flight path were indicated with red, pointed, numbered bubbles in the mission map (see Figure 2.4). Participants were made aware of the flight path in advance via a mission scenario document, but were not allowed to change the flight path during a test trial.
2.3.2 Environmental Icons
Each mission scenario contained a set of environmental icons (see black icons in mission map as part of Figure 2.4; see standalone icons in Figure 2.5), which were intended to represent likely targets of interest in a real reconnaissance scenario. The icons were placed randomly around the mission map and included: a forest, a hill, a civilian, a river, and a road. Each scenario contained a combination of 10 total icons, pseudo-randomly distributed. The
randomization was constrained so that all icons appeared at least once and none could appear more than four times during a single scenario. These limits were set to ensure some consistency in the level of monitoring difficulty among all experiment trials. That is, if one scenario
contained 10 roads, then many of the SA queries regarding the environmental icons would be significantly easier than scenarios with a distribution of types of icons, whereas other SA queries might be impossible to answer. An example of one of the pseudo-randomized icon distributions can be seen in Figure 2.4 and is described as follows: Scenario 1 contained one forest, three hills, one civilian, two rivers, and three roads. A table containing all scenarios and their environmental icon distributions can be found in Appendix A.
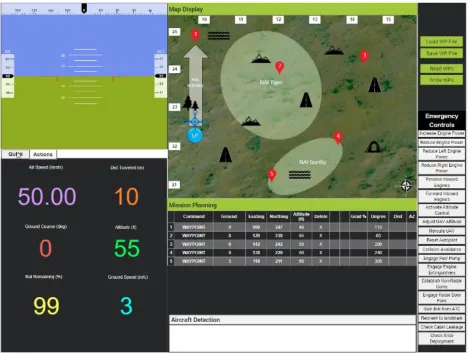
14 2.3.3 Named Areas of Interest
Each scenario contained three NAIs. Furthermore, there were two types of NAIs. The first type of NAI was an axis of travel, which represented a general direction of vehicle flight and was placed between two waypoints. This axis appeared as a white, semi-opaque arrow. The second type of NAI were zones of interest. These zones on the map were highlighted via circular or ellipsoid, light green colored shapes. It is typical for military missions to utilize a naming scheme when referring to distinctive mission features. In the present simulation, axes were named according to NATO phonetic alphabet identifiers (e.g., “Alpha”), and zones were named according to randomly selected, commonly known animals. The zones were placed to generally include at least one waypoint and one environmental icon, although they could contain more. No NAIs overlapped with each other. The NAIs served as an additional means to test participant SA, specifically comprehension of mission status (e.g., “Is the UAV currently inside of an NAI?”) and perception of items on the mission map (e.g., “What is the name of one NAI in this scenario?”).
2.3.4 In-Flight Parameters
Throughout the mission, the UAV would display six vehicle-related flight parameters: Air speed, distance travelled, ground course, altitude, battery life remaining, and ground speed. These parameters were included because they are the same parameters displayed in the Mission Planner interface and were considered to be the most relevant system critical information. Each parameter would update upon takeoff, 10 seconds after takeoff (e.g., upon reaching “stable flight”), and at each waypoint. Additionally, the vehicle’s distance travelled and battery
15 to limitations of the Just-in-Mind prototyping software. Consequently, updates occurred at 35-second intervals. Participants were instructed to monitor the flight parameters, as they served as a basis for completing some tasks or answering SA questions.
2.3.5 Scenario Structure
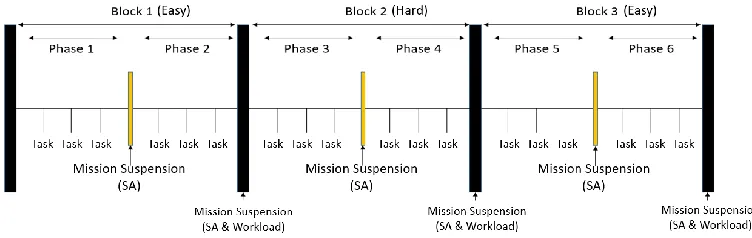
Each mission scenario consisted of three blocks of tasks of different difficulties. The tasks in the first block were easy, followed by hard tasks in the second block, followed by a third block of easy tasks. Each of these blocks also contained two “phases of operation” for the
vehicle. Each phase represented the path from one waypoint to the next. For example, Phase 1 of Block 1 consisted of the UAV flying from the Launch Point to Waypoint 1. After each phase, the simulation was suspended for 60 seconds. Participants were told that the UAV was loitering at the current waypoint. The participant’s monitor displayed three SA queries. Between blocks, the simulation was suspended for 80 seconds and participants were prompted to provide a subjective workload rating in addition to responding to SA queries. Furthermore, each phase of operation included one of each of the mission tasks that participants were required to perform (e.g., aircraft detection, alarm handling, and calculation), presented in random order. They were given 20 seconds to complete each task and only one task was presented at a time. Consequently, there were two instances of each type of tasks per block, and six instances in total. Figure 2.6 shows a generic timeline for all mission scenarios. Scenarios lasted 15 minutes and 30 seconds each.
16 2.4 Tasks
As described above, during the simulation scenarios, participants were required to respond to SA queries, provide subjective workload ratings, and complete three embedded subtasks representing common of UAV operations: hostile aircraft identification, emergency alarm handling, and flight arrival time calculation. The SA queries and workload responses were collected during pauses in the simulation. There was no overlap in the times participants had to complete responses.
2.4.1 Situation Awareness Queries
While the simulation was paused after each phase, the vehicle control interface would be covered by another grey screen for 60 seconds, which presented the three SA queries (See Figure 2.7). Each query represented one of three different levels of SA (e.g., perception, comprehension, and projection) defined by Endsley (1995). This SA assessment approach was based on the situation awareness global assessment technique (SAGAT) also developed by Endsley (1995).
Figure 2.7: Situation awareness query screen
17 18 queries per level, meaning all queries were used exactly twice during the course of the
experiment. Random assignment ensured that queries occurred in all scenario phases without repetition in the same scenario. That is, if the question, “How many Hill targets are present?” occurred in the first set of queries for Scenario 1, then that query could not reoccur for the remainder of Scenario 1, but it could occur once more in any of the other scenarios to be
completed by a single participant. A table containing all SA queries can be found in Appendix B. 2.4.2 Subjective Workload Ratings
After completion of each block in a scenario, participants were presented with another grey screen prompting them to provide a subjective rating of their overall cognitive workload on a scale from 0 to 100 (see Figure 2.8). The value of 0 represented no workload at all and 100 represented extremely high workload. Participants were given 20 seconds to verbally provide this rating before the simulation resumed and the screen disappeared. Vidulich and Tsang (1987) previously used this single axis scale.
18 2.4.3 Aircraft Detection
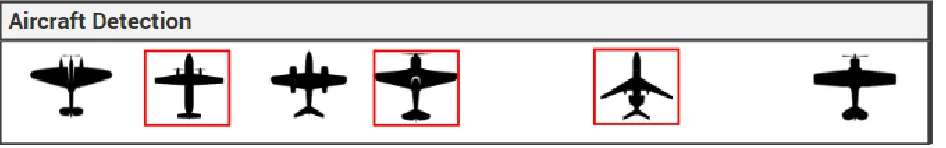
The aircraft detection task presented participants with a number of unique aircraft icons. From these icons, participants selected any icons representing hostile aircraft and avoided selecting icons that represented friendly aircraft (See Figure 2.9). Aircraft were selected by clicking on icons in the mission task bar. Once a selection was made, the icon was outlined in “red” and it could not be unselected for the remainder of the phase. There were 8 icons in total, 4 hostile and 4 friendly. These designations remained consistent during the experiment and across participants. Participants were provided with images of all icons during familiarization with the interface and they were allowed time to memorize their features. Furthermore, participants were given additional time after the training mission to review the aircraft icon designations before starting experimental trials. Once testing began, participants did not have access to these documents.
Figure 2.9: An example of a completed aircraft detection task at hard difficulty
Two levels of difficulty were applied to this task, easy and hard. Under the easy condition, two icons (1 hostile and 1 friendly) were randomly selected and presented in the aircraft detection window in the mission task bar. Under the hard condition, six icons (3 hostile and 3 friendly) were randomly selected and presented in the aircraft detection window. In another UAV study, Roberts et al. (2010) utilized a similar (target stimulus) identification task, which required pilots to compare information in their working memory with perceived
19 their recollection of friendly and hostile icons with the icons presented on the aircraft detection window in order to make a decision.
2.4.4 Alarm Handling
The alarm management task required participants to react to off-nominal events by engaging or disengaging vehicle subsystems via the emergency control menu. When an alarm was triggered, a red-bordered message window (See Figure 2.10) containing a description of the malfunction or event popped-up in the mission task bar. Participants had 20 seconds to select an appropriate emergency control. The emergency controls represented a set of canned responses that real-world vehicles are capable of executing through low-level on-board automation
functions. For example, one emergency control was “Increase engine power”. If this option was selected in a real-world operating scenario, on-board vehicle automation would increase the flow rate of fuel to the engine (i.e., throttle up). It is important to note, however, that although
emergency controls represented canned control actions, clicking one of the options in the simulation had no other effect than to dismiss the alarm message window.
Figure 2.10: An alarm notification window
The content of the simulated alarms as well as the emergency control options were generated based on the Aviation Safety Reporting System (ASRS) database for manned aircraft incidents. This database highlights common causes of vehicle system malfunctions and actions that can be taken to prevent or correct malfunctions. Once the alarms were formulated,
20 interface according to real-world vehicle subsystems that would be affected control actions. There were six total groupings and 19 total control options, including: altitude control (3
options), route control (3 options), engine and fuel systems (7 options), communication systems (4 options), and other systems (2 options). This ordering was included in the task instructions, so participants were aware of function groupings. A table with all possible alarms and their
solutions (i.e., associated emergency controls) can be found in Appendix C.
Two LoAs, including low and high, were applied to the alarm task during experiment trials. The low LoA provided no assistance in resolving alarm events, requiring the participant to decide among all possible alarm options. The high LoA highlighted three emergency controls in red, bolded font within the same subsystem grouping of controls in order to make them more salient to a participant. This set of controls always contained the correct answer to the current alarm task, and participants were made aware of this situation. Thus, they were instructed to choose an option from the highlighted set when it appeared on screen. Endsley and Kaber (1999) defined this type of automation as a “rigid system”, where the computer formulates a strict set of possible actions and the operator chooses among them without generating other options.
2.4.5 Flight Arrival Time Calculation
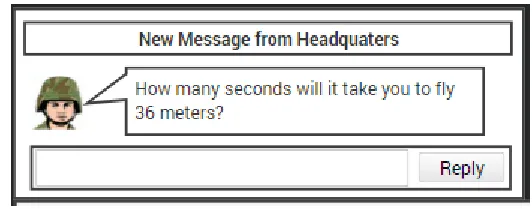
Another common task for UAV pilots is estimating a time of arrival at a specified destination. In the present UAV control simulation, a message window (see Figure 2.11)
appeared in the interface with a message from “headquarters”. The message asked participants to provide a time estimation (in seconds) for the UAV to fly a specified distance. In order to
21 speed was 3 meters per second (m/s), then their answer would be 3 seconds. The vehicle’s
ground speed only varied in integers between 1 and 9 m/s, so the divisor was always a single digit number.
Figure 2.11: A flight arrival time message window
There were two difficulty levels for this calculation task. The easy difficulty posed a two-digit dividend that left no remainder (e.g., 18 divided by 3). The hard difficulty posed a three-digit dividend that left a remainder (e.g., 891 divided by 8). Participants were alloted 20 seconds to respond once a message window appeared, and were instructed to round their answers to one decimal place, if the division resulted in a remainder. As mentioned in Section 2.3.2, the
participants were provided with a pen and some blank paper to support task performance, if they could not complete it mentally. This type of task has been used in previous studies, which found that including larger numbers and remainders in mathematical problems causes the difficulty to increase (Murata and Iwasc, 1998; Osburn, 1946). Furthermore, this embedded calculation subtask served to measure reserve attentional capacity and, therefore, was considered an objective measure of overall operator workload (Wickens et al., 1998).
2.5 Experiment Design
22 for each participant. The objective of the design was to minimize any potential influence of the scenario design on the automation treatment. Appendix D contains the randomization table for all 24 participants.
2.6 Independent Variables
There were two controlled manipulations for this experiment, including: in-flight subtask difficulty (IV1) and level of task automation (IV2). The subtask difficulty manipulation (IV1) was included in order to increase or decrease pilot workload (the hard and easy conditons, respectively) such that the task automation could be assessed for any capability to mitigate workload under the harder difficulty condition. The in-flight subtask difficulty was set at either easy or hard difficulty for each block in a scenario. All scenarios followed the same distribution of easy and hard subtasks. The first block of all scenarios had easy aircraft detection and
calculation tasks. The second block of all scenarios had hard aircraft detection and calculation tasks. Finally, the third block of all scenarios had easy aircraft detection and calculation tasks. Under the low automation condition, no automation assistance was applied to the alarm task, regardless of the difficulty of the block. Under the DFA mode, automation was dynamically applied depending on the difficulty level of the block. That is, automation assistance for the alarm task was applied under the hard difficulty and switched off during the easy difficulty. The high automation condition applied the automation assistance for the alarm task to all scenario blocks.
2.7 Dependent Variables
23 considered objective measures of operator situation awareness. DV1 was calculated as the
average accuracy response across all SA queries (i.e., Levels 1, 2 and 3) in a block (6 responses in total). This response was expressed as a percentage of the correct answers to the total number of queries presented. DV2 was also averaged across observations within a trial block.
Workload metrics included the overall subjective workload rating (DV3) and calculation response accuracy with a 5% deviation allowance (DV4). DV4 was considered as an objective measure of workload. Since DV3 was only collected once per block, the data did not need to be aggregated. DV4 was aggregated for each trial block in the same manner as DV2.
2.8 Hypotheses
Based on the literature presented in Section 1, the following hypotheses were generated: H1. The DFA condition will result in better overall operator SA, indicated by higher SA query accuracy than the high automation condition.
H2. The DFA condition will result in better overall operator SA, indicated by higher aircraft detection task accuracy than the high automation condition.
H3. The DFA condition will result in better overall operator SA, indicated by a greater increase in SA query accuracy when transitioning from the hard difficulty to the easy difficulty than the high automation condition.
H4. The DFA condition will result in better overall operator SA, indicated by a greater increase in aircraft detection accuracy when transitioning from the hard difficulty to the easy difficulty than the high automation condition.
24 H6. The DFA condition will result in lower overall operator cognitive workload,
indicated by higher calculation task accuracy than the low automation condition.
H7. The DFA condition will result in lower overall operator cognitive workload, indicated by a smaller increase in subjective workload responses than the low automation condition when transitioning from the easy difficulty to the hard difficulty.
H8. The DFA condition will result in lower overall operator cognitive workload,
indicated by a smaller decrease in calculation accuracy than the low automation condition when transitioning from the easy difficulty to the hard difficulty.
2.9 Procedure
Participants first completed an informed consent form, including basic information regarding the experiment, compensation, rights as an experiment participant, and a brief description of the experiment content (i.e., flying simulated UAV missions). After consenting, participants completed a demographic survey reporting their age, gender, visual acuity,
experience with UAV GCS software, and time in the ROTC program. Participants were then given an overview of their mission and instructed on using the simulated GCS interface controls. Furthermore, participants were given instructions on sampling vehicle flight parameters, which were needed for completion of the calculation task and in responding to SA queries. An
experimenter explained the three subtasks participants were required to complete, along with the methods for completing the tasks. Participants were also given time to memorize the
25 were shown all possible hostile and friendly aircraft icons for the aircraft detection task and given time for familiarity. Participants were instructed that they would not have access to any mission or training documents during the experimental trials.
Participants completed a training trial to become familiar with the mission procedure and subtasks. This trial was a shortened version of full test trials with only two task performance blocks vs. three. The trial contained one easy block followed by a hard block, with automation applied to the hard block. This was to ensure that participants were exposed to all variations of the automation and task difficulties in a single training trial. Participants were allowed to repeat the training if needed; however, all participants were able to complete the training trial without substantial errors on their first attempt. Once complete with the training, participants were again presented with the aircraft icons to confirm their knowledge of hostile and friendly aircraft.
To further limit the influence of possible learning effects, directly following the training trial, participants completed a “pseudo-trial”, which was identified for them as a full experiment trial. The pseudo-trial included two task performance blocks and did not involve recording of data for analysis purposes.
26 2.10 Data Analysis
A repeated measures Analysis of Variance (ANOVA) was applied to all dependent variables. Since individual differences in the subjective workload ratings were likely, participant data for DV3 was transformed into Z-scores using the mean and standard deviation calculated for all workload responses for a participant that were recorded during the experiment. Shapiro-Wilk’s test was applied to determine normality of the residuals generated from participant data and Bartlett’s test was applied to determine homoscedasticity in order to satisfy assumptions of the ANOVA procedure. Diagnostics revealed violations of these normality and homoscedasticity assumptions for all dependent variables, including the derived workload Z-scores. As such, the ANOVA was applied to ranks of the data for a non-parametric analysis. There were a total of 432 observations for DV1 and DV2 (24 participants * 6 scenarios * 3 blocks). All subjective workload responses (DV3) were excluded for one participant because they failed to follow instructions on providing the workload response. As a result, there were 414 subjective workload observations. Six observations were excluded from DV4 due to failures to respond by
participants, resulting in 426 observations.
27 easy was used to assess differences in cognitive workload among low and high automation vs. DFAs.
The initial statistical model included IV2 as a main effect, participant as a blocking factor, and trial number as a covariate. Trial number was later removed from the analysis due to an insignificant effect on the results. An alpha value of 0.05 was used to determine significance in all analyses. Tukey’s Honestly Significant Difference (HSD) test was chosen for post-hoc analysis due to its conservativeness in determining significant groupings. If significant effects did appear, Tukey’s HSD produced lettered groupings (e.g. “A”, “AB”, or “B”) for the
automation modes. Automation modes with the same Tukey’s grouping letter were not
significantly different. For example, if DFA was classified as “AB”, then it would be considered not significantly different from any modes classified as “A” or “B”.
The final statistical model was as follows:
𝑋𝑖𝑗 = μ + α𝑖 + 𝛽𝑗+ 𝐸𝑖𝑗𝑘
Where µ = grand mean; αi = automation mode (i = 1…3); βj = participant (j = 1…24);
28 RESULTS
3.1 Situation Awareness
The situation awareness analyses were based on four response measures. Of these measures, the overall SA query accuracy (H1) and aircraft detection accuracy during difficulty transition (H4) did not yield significant results, according to the ANOVA procedure.
Regarding H2, ANOVA results revealed a significant effect of automation mode on aircraft detection task accuracy (F (25, 406) = 12.62, p = 0.0447, β = 0.3996). Comparison of parametric and nonparametric results revealed that the parametric analysis did not show a significant difference among automation modes. Thus, nonparametric results are reported here. Post-hoc analyses using Tukey’s HSD tests revealed participants using the high LoA to be less likely to accurately identify all hostile aircraft than the low LoA (see Figure 3.1). Accuracy under the DFA condition was not significantly different from either high or low LoA. Analysis also revealed that there were significant individual differences among participants.
29 Regarding H3, ANOVA results revealed a significant effect of automation mode on changes in SA query accuracy when transitioning from the hard to easy difficulty block (F (24, 71) = 1.65, p < 0.0001, β = 0.002). Comparison of parametric and nonparametric results revealed no difference in the pattern of automation outcomes, so parametric results are reported. Post-hoc analyses using Tukey’s HSD tests revealed that participants using the high automation condition improved in SA response accuracy, whereas the DFA condition resulted in a slight decrease in SA response accuracy (see Figure 3.2).
Figure 3.2: Mean change in SA query accuracy when transitioning from hard to easy. (Error bars represent one standard deviation.)
3.2 Workload
The workload analysis was also based on four response measures. Of these measures, the subjective workload response ratings (H5), the degree of subjective workload change during transitions in task difficulty (H7), and the calculation accuracy during transitions (H8) did not produce significant results, according to the ANOVA procedure.
Regarding H6, ANOVA results revealed a significant effect of automation mode on flight time projection task accuracy (F (25, 400) = 2.59, p = 0.0163, β = 0.2681). Comparison of
30 outcomes, so parametric results are reported. Post-hoc analyses using Tukey’s HSD tests
revealed participants to be less accurate under the high static automation than the low static or DFA conditions (see Figure 3.3). The analysis did not reveal a significant difference in
participant accuracy between the low LoA and DFA conditions. Analysis also revealed that there were significant individual differences among participants.
31 DISCUSSION
4.1 Situation Awareness
Of the four hypotheses related to situation awareness, one was partially supported by the results but the remaining three were not supported. The first hypothesis (H1) stated that the DFA condition would result in higher SA query accuracy than high automation. This contention was not supported, as the ANOVA did not show any significant differences among the automation conditions. This finding is not in line with previous research, which has shown adaptive
automation to result in improved SA over high, static levels of automation (Kaber and Endsley, 2004; Parasuraman, Cosenzo, and deVisser, 2009). One possible explanation is that the SA queries were presented all at once and on the same screen. It is possible that the initial questions may have impacted participant working memory such that they were less likely to answer the latter questions accurately, regardless of the automation condition.
32 The third hypothesis (H3) stated that the DFA condition would result in a greater increase in SA query accuracy during transitions in task difficulty than high automation. This contention was not supported, as SA increased under the high automation condition but decreased under the DFA condition. This finding also differed from previous research (Kaber and Endsley, 2004) indicating that adaptive automation led to improved SA over high LoAs. One likely reason for this result is that the automation made the alarm subtask easier, allowing participants more time to concentrate on the system display and improve SA. Furthermore, although the tasks
transitioned to being easier, the lack of automation provided by the DFA condition during the easy block may have contributed to the decrease in SA under that condition, as participants had to allocate greater attentional resources on completing subtasks.
33 4.2 Workload
Of the four hypotheses related to participant workload, none were supported by the statistical results. The fifth hypothesis (H5) stated that the DFA condition would result in lower subjective workload ratings than low automation. This contention was not supported, as the ANOVA did not reveal significant differences among the automation modes. This outcome may be due to the automation only being applied to one subtask (i.e., alarm handling) to generate the DFA and high automation conditions. With the combined workload of the other subtasks and monitoring tasks, the applied automation may not have been sufficient for participants to subjectively notice a difference in cognitive workload.
The sixth hypothesis (H6) stated that the DFA condition would result in greater
calculation accuracy than low automation. This expectation was not supported by the ANOVA results. There was a significant effect of the automation condition on accuracy in the calculation subtask; however, this effect was only apparent for the high automation condition, which
produced significantly lower accuracy than the DFA or low automation conditions. Although the calculation measure was focused on assessing workload, the measure required some operator SA, specifically awareness of current vehicle ground course in order to provide an accurate response to queries. This situation represents additional evidence of an out-of-the-loop performance problem that was not present under the DFA condition.
34 Supplemental analysis of the workload response was conducted for the different blocks of task difficulty with the objective of identifying any carryover effects (see figure 4.1). In general, it was observed that workload for all automation conditions started low, increased with task
difficulty, and then levelled off. This trend suggests that the automation application may not have been sufficient to mitigate perceived workload, regardless of the level of subtask difficulty.
Figure 4.1 Mean subjective workload response for automation conditions by level of difficulty
35 CONCLUSIONS
Prior research has found adaptive automation conditions to be useful in addressing complex system operator situation awareness and workload problems under high and low modes of automation, respectively (Kaber & Endsley, 2004). In this study, an experiment was
conducted to evaluate the usefulness of DFAs in decision-making scenarios for UAV operations. A total of 24 students from the local ROTC programs participated in the experiment. The DFA condition showed some promise for supporting greater operator SA by reducing out-of-the-loop performance problems in simulated UAV operations, specifically in the aircraft detection subtask. The findings of this research, in part, support the use of adaptive automation, specifically a dynamic allocation of automation functions as a solution to out-of-the-loop performance problems.
5.1 Application
At the present time, the U.S. military is seeking to implement multiple UAV control by individual pilots for future combat missions. In order to achieve this objective, there is a need to design and implement substantial vehicle automation in order to manage pilot workload and achieve optimal performance. However, significant human factors issues still exist in single vehicle control by pilots, which need to be addressed before multiple vehicle control can be achieved. This research further demonstrates the potential for pilot workload overload or out-of-the-loop performance problem under low and highly automated vehicle control conditions. The research also demonstrates some of the benefits of DFAs in addressing these issues.
5.2 Limitations
36 (e.g., between blocks), the automation could not be set to take over in real-time. This situation limited the possibility of implementing real-time automation switching in the case that a participant indicated higher workload. Furthermore, the prototyping tool did not allow for a dynamic primary flight display, which pilots would be accustomed to in a real-world interface. Inclusion of a continuously updating PFD might have enhanced the fidelity of the simulator. Since the PFD content was static, except for the vehicle parameter information, it is likely that participants rarely used the PFD to aid in their understanding of the UAV status. Having said this, the particular limitation was likely not detrimental to the findings of the study. The
information found on the PFD was redundant to the main information displays and only severed to improve performance and simulation fidelity.
Another limitation of this study may have been that participants were able to develop mental models of the automation assistance in various scenarios. Participants were not instructed on which scenarios would provide automation assistance, but it is possible that they were able to detect when a scenario involved consistent assistance (e.g., high static automation), occasional assistance (DFA), or no assistance (low static). If this were the case, it is possible that such mental models influenced participant SA or workload responses, based on their expectation of how much assistance the automation would provide.
37 Finally, although the flight time projection subtask was considered an objective measure of workload, the subtask did require some level of SA to complete. Therefore, it was not a pure indicator of workload. Rather, the results of the analysis suggest that there was a combined effect of the participants’ engagement (SA) and their cognitive workload when completing the task. Modification of the task, such that the SA component was not required, could resolve this limitation. However, using the vehicle’s ground speed parameter to complete the task was intended to promote task realism.
5.3 Future Work
Future studies of adaptive automation conditions and LoAs may benefit from the addition of real-time physiological workload monitoring (e.g., EEG) to enable a more dynamic
assessment of operator workload in task scenarios. It would be interesting to know what levels of workload in UAV control are optimal for changing automation features and allocating functions between human and machine to achieve the greatest performance. Using EEG could provide a more direct measure of participant workload during an experiment, which may facilitate more sensitive analysis of automation conditions.
39 REFERENCES
Afergan, D., Peck, E. M., Solovey, E. T., Jenkins, A., Hincks, S. W., Brown, E. T., Jacob, R. J. (2014). Dynamic difficulty using brain metrics of workload. In: Proceedings of the 32nd annual ACM conference on Human factors in computing systems, pp. 3797-3806. ACM. Calhoun, G. L., Draper, M. H., & Ruff, H. A. (2009). Effect of level of automation on unmanned aerial vehicle routing task. In Proceedings of the Human Factors and Ergonomics Society Annual Meeting (Vol. 53, No. 4, pp. 197-201). Sage CA: Los Angeles, CA: SAGE Publications.
Calhoun, G. L., Ward, V. B., Ruff, H. A. (2011). Performance-based adaptive automation for supervisory control. In: Proc Hum Factors Ergon Soc Annu Meet, Vol. 55, No. 1, pp. 2059-2063. Los Angeles, CA: SAGE Publications.
Chen, J. Y., Barnes, M. J., & Harper-Sciarini, M. (2011). Supervisory control of multiple robots: Human-performance issues and user-interface design. IEEE Transactions on Systems, Man, and Cybernetics, Part C (Applications and Reviews), 41(4), 435-454.
Clauss, S., & Schulte, A. (2014). Task delegation in an agent supervisory control relationship capability awareness in a cognitive agent. 2014 IEEE International Conference on Systems, Man, and Cybernetics (SMC). doi:10.1109/smc.2014.6974013.
Endsley, M. R. (1995). Measurement of situation awareness in dynamic systems. Human factors, 37(1), 65-84.
Endsley, M. R. (1995). Toward a theory of situation awareness in dynamic systems. Human factors, 37(1), 32-64.
Endsley, M. R., Kaber, D. B. (1999). Level of automation effects on performance, SA and workload in a dynamic control task. In: Ergonomics, Vol. 42, No. 3, pp. 462-492. Endsley, M. R., Kiris, E. O. (1995). The out-of-the-loop performance problem and level of
control in automation. In: Human factors, Vol. 37, No. 2, pp. 381-394.
Endsley, M. R., Onal, E., & Kaber, D. B. (1997). The impact of intermediate levels of automation on situation awareness and performance in dynamic control systems. In Human Factors and Power Plants, 1997. Global Perspectives of Human Factors in Power Generation., Proceedings of the 1997 IEEE Sixth Conference on (pp. 7-7). IEEE. Hancock, P. A., Mouloua, M., Gilson, R., Szalma, J., & Oron-Gilad, T. (2007). Provocation: Is
the UAV control ratio the right question?. Ergonomics in Design, 15(1), 7.
40 Kaber, D. B., & Endsley, M. R. (2004). The effects of level of automation and adaptive
automation on human performance, situation awareness and workload in a dynamic control task. In: Theor Issues Ergon Sci, Vol. 5, No. 2, pp. 113-153.
Kaber, D. B., Perry, C. M., Segall, N., McClernon, C. K., Prinzel III, L. J. (2006). SA
implications of adaptive automation for information processing in an air traffic control-related task. In: Int J Ind Ergon, Vol. 36, No. 5, pp. 447-462.
Miller, C. A., & Parasuraman, R. (2007). Designing for flexible interaction between humans and automation: Delegation interfaces for supervisory control. Human factors, 49(1), 57-75.
Murata, A., & Iwase, H. (1998). Evaluation of mental workload by fluctuation analysis of pupil area. In Engineering in Medicine and Biology Society, 1998. Proceedings of the 20th Annual International Conference of the IEEE (Vol. 6, pp. 3094-3097). IEEE.
Office of the Secretary of Defense, “Unmanned Aircraft Systems (UAS) Roadmap, 2005-2030.” Washington DC: DoD
Osburn, W. J. (1946). Levels of difficulty in long division. The Elementary School Journal, 46(8), 441-447.
Parasuraman, R., Cosenzo, K. A., & De Visser, E. (2009). Adaptive automation for human supervision of multiple uninhabited vehicles: Effects on change detection, situation awareness, and mental workload. Military Psychology, 21(2), 270.
Parasuraman, R., Sheridan, T. B., & Wickens, C. D. (2000). A model for types and levels of human interaction with automation. IEEE Transactions on systems, man, and
cybernetics-Part A: Systems and Humans, 30(3), 286-297.
Porat, T., Oron-Gilad, T., Rottem-Hovev, M., & Silbiger, J. (2016). Supervising and controlling unmanned systems: A multi-phase study with subject matter experts. Frontiers in
psychology, 7, 568.
Roberts, D. M., Taylor, B. A., Barrow, J. H., Robertson, G., Buzzell, G., Sibley, C., & Baldwin, C. L. (2010). EEG spectral analysis of workload for a part-task uav simulation.
In Proceedings of the Human Factors and Ergonomics Society Annual Meeting (Vol. 54, No. 3, pp. 200-204). Sage CA: Los Angeles, CA: SAGE Publications.
Ruff, H. A., Narayanan, S., & Draper, M. H. (2002). Human interaction with levels of automation and decision-aid fidelity in the supervisory control of multiple simulated unmanned air vehicles. Presence: Teleoperators & Virtual Environments, 11(4), 335-351. de Visser, E., & Parasuraman, R. (2011). Adaptive aiding of human-robot teaming: Effects of
41
43 APPENDIX A
Environmental Icon Distribution
Icon Type
Scenario #
S1 S2 S3 S4 S5 S6 Total per
Experiment
Civilian 2 2 1 2 3 2 12
Forest 4 1 1 2 1 3 12
Hill 1 2 3 2 3 1 12
River 1 2 2 3 2 2 12
Road 2 3 3 1 1 2 12
Total per
44 APPENDIX B
Situation Awareness Query Bank SA
Level
Query
1 Are you currently in an NAI? 1 Have you passed through the Axis? 1 How many Civilian targets are there? 1 How many Forest targets are there? 1 How many Hill targets are there? 1 How many River targets are there? 1 How many Road targets are there?
1 What is the name of one NAI in this scenario? 1 What is the name of the Axis in this scenario? 1 What is your current air speed?
1 What is your current altitude?
1 What is your current battery remaining? 1 What is your current distance travelled? 1 What is your current ground course? 1 What is your current ground speed? 1 What waypoint are you at currently? 1 What waypoint is at the end of the Axis? 1 What waypoint is the origin of the Axis?
2 How many Civilian targets are inside of an NAI? 2 How many Forest targets are inside of an NAI? 2 How many Hill targets are inside of an NAI? 2 How many River targets are inside of an NAI? 2 How many Road targets are inside of an NAI?
2 In what direction is the farthest environmental target from your current location? 2 In what direction is the LP from your current location?
2 In what direction is the nearest environmental target from your current location? 2 In what direction is the next waypoint from your current location?
2 In what direction is the previous waypoint from your current location?
2 To reach a groundspeed of 5.1 meters/second, should you accelerate or decelerate? 2 To reach an airspeed of 60 knots, should you accelerate or decelerate?
2 To reach an altitude of 55ft, should you ascend or descend?
2 What is (are) the least common environmental target(s) in this scenario? 2 What is (are) the most common environmental target(s) in this scenario? 2 What is your current mission completion percentage?
2 What type of environmental target is closest to your vehicle? 2 What type of environmental target is farthest from your vehicle?
3 If the vehicle travelled directly east from its current location, would it encounter any environmental targets?
45 3 If the vehicle travelled directly south from its current location, would it encounter
any environmental targets?
3 If the vehicle travelled directly west from its current location, would it encounter any environmental targets?
3 If there were another vehicle in your path at the altitude of xxx, would it be easier to increase or decrease your altitude to avoid a collision?
3 In order to proceed to the next waypoint, will your vehicle need to make a right or left turn?
3 What will your mission completion percentage be at the next waypoint? 3 What will your vehicle's approximate groundcourse be on the way to the next
waypoint?
3 While heading to the next waypoint, will your vehicle encounter any Civilians? 3 While heading to the next waypoint, will your vehicle encounter any Forests? 3 While heading to the next waypoint, will your vehicle encounter any Hills? 3 While heading to the next waypoint, will your vehicle encounter any Rivers? 3 While heading to the next waypoint, will your vehicle encounter any Roads? 3 Will your vehicle cross over its previous path on the way to the next waypoint? 3 Will your vehicle cross over the Axis on the way to the next waypoint?
3 Will your vehicle pass through any NAIs on the way to the next waypoint? 3 With the vehicle's current battery usage, will it run out of battery before reaching
the LP?
46 APPENDIX C
Alarms and Solutions
Alarm Categories Alarm Event Correct Emergency Control
Altitude Control
Autopilot failed holding altitude
Activate altitude control Saturated airspace ahead at
current vertical level
Adjust UAV altitude UAV ballooning up with
severe updraft
Reduce engine power
Route Control
UAV route deviation Reroute UAV Incorrect autopilot waypoint
tracking
Reset autopilot Unrecognized vehicle in route Collision avoidance
Engine and Fuel Issues
Right engine failed – UAV yaw to right
Reduce left engine power Left engine failed – UAV
yaw to left
Reduce right engine power Aircraft entered a spin due to
asymmetric power
Reverse inboard engines High fuel pressure Engage fuel pump
Acceleration lost Increase engine power Engine on fire Engage engine extinguishers Engine overheat Reduce engine power
Communication System
Radar contact lost Establish non-radar Coms Radar cooling system off Engage radar door fans
UAV lost link Regain link from ATC Compass card malfunction Reorient to landmark Other Cabin pressurization problem Check cabin leakage
47 APPENDIX D
Scenario Form of Automation and Trial Randomization Scenario # Form of
Automation
Repetition # 1 Low Static 1 2 Low Static 2
3 DFA 1
4 DFA 2
5 High Static 1 6 High Static 2 Participant # Trial 1 Scenario Trial 2 Scenario Trial 3 Scenario Trial 4 Scenario Trial 5 Scenario Trial 6 Scenario
1 5 2 6 3 1 4
2 2 3 6 1 4 5
3 2 6 3 5 1 4
4 3 1 5 6 4 2
5 6 3 2 5 1 4
6 5 6 2 1 4 3
7 4 6 1 5 3 2
8 4 3 6 1 2 5
9 4 5 6 3 2 1
10 3 5 2 1 4 6
11 1 6 2 3 5 4
12 1 3 2 5 4 6
13 6 4 3 2 1 5
14 2 4 5 3 1 6
15 4 3 1 6 2 5
16 4 2 5 6 1 3
17 2 5 1 4 6 3
18 5 1 4 6 3 2
19 5 4 2 6 3 1
20 1 2 4 5 6 3
21 1 5 2 6 4 3
22 5 1 2 4 3 6
23 1 6 2 4 5 3