ABSTRACT
RAMAROSON, MIALY FANJAMALALA. Development and Application of Mass Spectrometry Methods for Expression Proteomic Analysis of Marek’s Disease Virus Infection. (Under the direction of Michael B. Goshe).
The ability of mass spectrometry to identify and quantify proteins from complex samples has rendered it an indispensable tool in the field of proteomics. The goal of this study is to develop and apply liquid chromatography - tandem mass spectrometry methods for expression proteomic analysis of Marek’s Disease Virus (MDV) infection.
Marek’s disease (MD) is a lymphomatous disorder caused by MDV and has been a major problem for the poultry industry for the last 60 years. In natural infection, MDV, a highly oncogenic cell-associated α-herpesvirus, is inhaled with the feather and dust.
Pathogenesis involves cytolytic and latent phases of infection, followed by virus reactivation leading to T-cell transformation and lymphoma development in the lymphoid and nervous tissues, skin and visceral organs of susceptible chickens. In contrast, athough MD-resistant birds are infected by the virus, the virus remains latent and the birds show no clinical signs of the disease. MD has been controlled by vaccination, but because MD-resistant birds can still spread the virus horizontally, a continued evolution of more virulent filed strains is cause for concern of future vaccination efforts. This has forced the exploration of different avenues for therapeutics including a better understanding of the host immunity interaction with the virus during disease pathogenesis.
be subject to feedback controls by the expressed proteins. In addition, no information is obtained regarding the levels of corresponding protein expression or their post-translational modifications. Consequently, proteome analyses provide a more comprehensive platform to study MDV infection. In this report, we describe the development and application of several proteomic methods to study MDV infection.
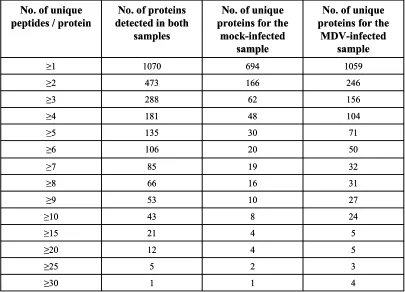
A comparison of MDV-infected chicken fibroblast (CEF) cells with mock-infected CEF cells using a modified multi-dimensional analysis revealed 3561 unique
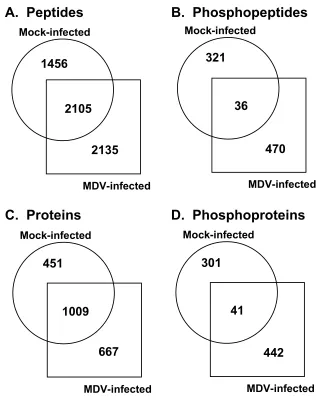
non-phosphorylated peptides, representing 1460 chicken proteins, in a mock-infected sample compared to 4240 unique non-phosphorylated peptides, representing 1676 proteins, in an MDV-infected sample. Of these unique peptides, 59% from the mock- and 50% from the MDV-infected samples were detected in both samples, and for the represented proteins, 69% from the mock- and 60% from the MDV-infected samples were common to both samples. Although the study was a qualitative proteomic analysis, the results suggested that MDV infection introduced some notable changes in the host proteome.
An isotope-coded labeling reagent was developed for quantitative proteomics. This novel cysteine (Cys)-targeting label combined the simplicity of solid-phase labeling and an acid-based cleavage reaction for labeled peptide release. The label successfully and
consistently labeled 10 of 35 Cys on bovine serum albumin after reaction conditions were optimized with a model Cys peptide. Application of the isotope-coded labeling approach to CEF cells revealed that additional optimization would be needed for proteome analysis. Therefore, a label-free approach was pursued.
Development and Application of Mass Spectrometry Methods for Expression Proteomic Analysis of Marek’s Disease Virus Infection.
by
Mialy Fanjamalala Ramaroson
A dissertation submitted to the Graduate Faculty of North Carolina State University
in partial fulfillment of the requirements for the degree of
Doctor of Philosophy
Biochemistry
Raleigh, North Carolina 2011
APPROVED BY:
_______________________________ ______________________________
Dr. Michael B. Goshe Dr. Dennis Brown
Chair of Advisory Committee
DEDICATION
To my parents who have never ceased to be a source of encouragement, love, and support throughout the years, and to Bebe who was my inspiration to finally get this done and is now
BIOGRAPHY
Mialy Ramaroson was born in Madagascar, and spent the majority of her childhood in Africa. Growing up in Botswana in the mid-1990s made her aware of the HIV/AIDS
ACKNOWLEDGMENTS
I would like to take this opportunity to acknowledge the many people who have supported me through the duration of my Ph.D. career.
I would first like to express my sincere gratitude to my advisor, Dr. Michael B. Goshe for his patience in teaching new concepts, his willingness to listen to various concerns within the group, and his dedication in mentoring young scientists. I would also like to thank my committee members, Dr. Sunny Liu, Dr. Dennis Brown and Dr. Robert Rose for their support and encouragement throughout the years despite their busy schedules, and their dedication towards making me a better scientist.
I would also like to thank the Goshe lab members, both past and present: Dr. Erik Soderblom, Dr. Uma Kota, John Gantt, Koyi Chien, Fan Liu. Coming to work with you all has made for some very interesting times, and I thank each and every one of you for the good days, but also for being there to get me through the bad ones.
I would like to give a special thanks to Kevin Blackburn. You are an essential part of my Ph.D. career as I’ve learnt so much from you, and I will forever be grateful!
I would like to thank Pamela Francis for all that she has done to help me out with the paper work I’ve had to deal with over the years as an international student. You are amazing and I am so thankful for you!
to Karen, Maria and Sarah for guaranteeing that “tonight’s gonna be a good night!”…and more.
I would also like to thank the Hornbaker family for opening their hearts and home to me ever since I begged Molly to be my friend. Thank you for giving me a second place to call home. In the same breath, I would like to thank Kathleen MacKenzie for being so gracious and supportive over the past few years, even from so far away.
TABLE OF CONTENTS
LIST OF TABLES………xi
LIST OF FIGURES……….xii
CHAPTER 1: An introduction to mass spectrometry-based proteomic strategies and Marek’s Disease Virus infection………...……….1
1.1. Introduction to proteomics..………...2
1.1.1. Instrumentation.……...………...2
1.1.2. Fragmentation.………...……….3
1.1.3. Bottom-up vs. top-down proteomics.……….5
1.1.4. Quantitative proteomics.………...8
1.1.4.1. Stable isotope coding.………...………...9
1.1.4.2. Label-free quantitative proteomics.………...………15
1.1.4.2.1. Quantification based on spectral counting.………...……..15
1.1.4.2.2. Quantification based on peak intensity.………...16
1.1.4.3. Label free quantification by LC-MSE.………...18
1.1.5. Viral proteomics.………...20
1.2. Introduction to Marek’s disease.……...……….21
1.2.1. Disease history.………..….……..22
1.2.2. Marek’s Disease Virus....………...23
1.2.2.1. Virus Classification.………...………23
1.2.3. Pathogenesis of MDV infection.………...25
1.2.3.1. Pattern of virus infection with oncogenic virus (Serotype-1)………25
1.2.3.2. Pattern of virus infection with nononcogenic MDV (Serotype 2) and HVT (Serotype 3)……….………...………27
1.2.4. Host immune responses to infection.………...27
1.2.5. Important MDV genes.……….………30
1.2.6. Marek’s disease virus resistance.………..32
1.2.7. Proteomics in the study of MDV infection....………...…33
1.3. Aim of dissertation project………….………34
1.4. References………...35
CHAPTER 2: Changes in the Gallus gallus proteome induced by Marek’s Disease Virus…61 2.1. Abstract.………...62
2.2. Introduction.………...63
2.3. Experimental procedures.………..64
2.3.1. Materials.………..64
2.3.2. Proteome extraction by acetone precipitation.………..65
2.3.3. Trypsin digestion.………...65
2.3.4. Strong cation exchange chromatography peptide fractionation.………...66
2.3.5. Microcapillary reversed-phase LC/MS/MS analysis of SCXC fractioned peptides………..66
2.3.7. Determination of GRAVY values, transmembrane domain and
subcellular localization.………...………...69
2.4. Results.………...69
2.4.1. Proteomic comparison of mock-infected and MDV-infected CEF cells……..69
2.4.2. Fractionation efficiency during multidimensional LC/MS/MS analysis.…...72
2.4.3. Bioinformatic comparison of mock-infected and MDV-infected CEF cells…73 2.4.4. Functional comparison between proteins and phosphoproteins of mock-infected and MDV-infected CEF cells.………...………...…..75
2.5. Discussion………...76
2.5.1. Protein identification using multidimensional LC/MS/MS analysis…..……..76
2.5.2. Assessing peptide separation and protein detection………..78
2.5.3. Consequences of data-dependent acquisition………...80
2.5.4. Protein and phosphoprotein differences between mock-infected and MDV-infected cells………...…...82
2.6. Conclusions………...84
2.7. Acknowledgements………86
2.8. References………..……87
CHAPTER 3: Development of a cysteine-specific isotope-coded acid cleavable solid phase tag for quantitative proteomics.……….105
3.1. Abstract.……….….…….106
3.2. Introduction.……….107
3.3.1. Materials.………..………..109
3.3.2. Synthesis of the CIAST reagent.……….110
3.3.3. CIAST reactivity assay.………..111
3.3.4. CIAST labeling of Cys-peptide.……….112
3.3.5. Preparation of BSA peptides.………..112
3.3.6. Solid phase extraction.………113
3.3.7. CIAST labeling of BSA peptides.………...113
3.3.8. Release of isotopically labeled peptides by acid cleavage.……….114
3.3.9. LC/MS/MS analysis of labeled peptides……….114
3.3.10. Peptide identification………115
3.4. Results and discussion.………....115
3.5. References..………..119
CHAPTER 4: Quantitative proteomic analysis of virus reactivation of lympoblastoid cells transformed with Marek’s Disease Virus………136
4.1. Abstract.………...137
4.2. Introduction.……….137
4.3. Experimental procedures.………143
4.3.1. Materials.………143
4.3.2. Tumor cell line growth and MDV reactivation…..……….143
4.3.3. Protein extraction.………...143
4.3.4. Mass Spectrometry analysis………...……….144
4.3.6. Feature extraction……….………...146
4.3.7. Protein annotation…...………...……….146
4.3.8. Identification of similar protein expression patterns………..147
4.3.9. Protein localization and functional analysis………...147
4.4. Results and discussion……….148
4.4.1. Sample preparation……….……148
4.4.2. Differential protein expression patterns………...…...149
4.4.3. Protein localization………...150
4.4.4. Protein functional analysis………....………...………...…151
4.4.5. MDV protein identification……….152
4.5. Conclusion…….………...153
4.6. Acknowledgements………..155
LIST OF TABLES
CHAPTER 2
Table 2.1. Proteins identified for the mock-infected and MDV-infected samples based on the number of unique peptides determined by SCXC-µrpLC/MS/MS analysis……..90 Table 2.2. Gallus gallus proteins identified by 3 or more unique peptides, detected
only in the mock-infected sample………...91 Table 2.3. Gallus gallus proteins identified by 3 or more unique peptides, detected
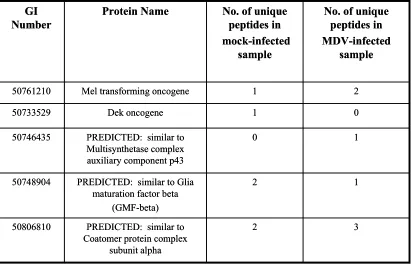
only in the MDV-infected sample……….92 Table 2.4. Gallus gallus proteins previously identified to be important in
LIST OF FIGURES
CHAPTER 1
Figure 1.1. Peptide sequence elucidation from fragmentation mass spectra.……….53 Figure 1.2. Schematic of the bottom up and top down approaches to protein
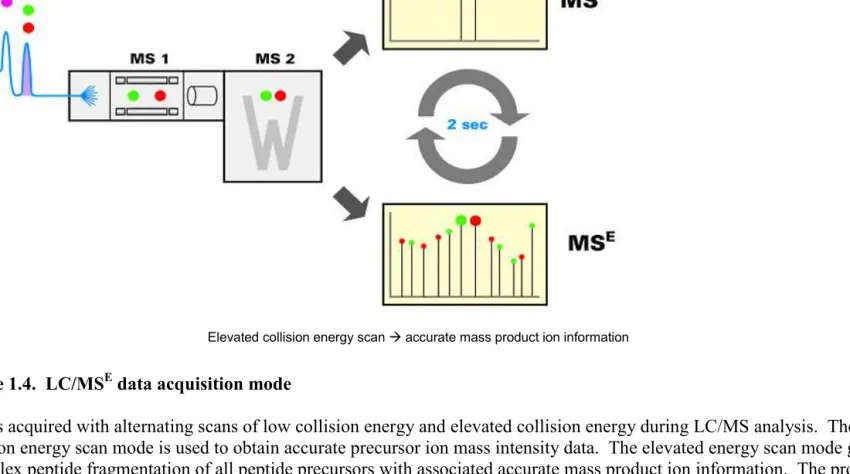
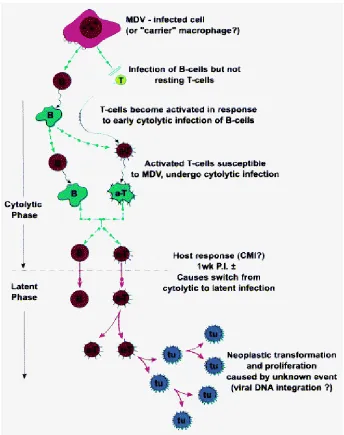
identification………..55 Figure 1.3. Quantitative proteomics workflows……….57 Figure 1.4. LC/MSE data acquisition mode………59 Figure 1.5. Schematic representation of a hypothesis of sequential events in
lymphocytes with MDV……….60 CHAPTER 2
Figure 2.1. Gallus gallus peptide and protein comparison between mock-infected
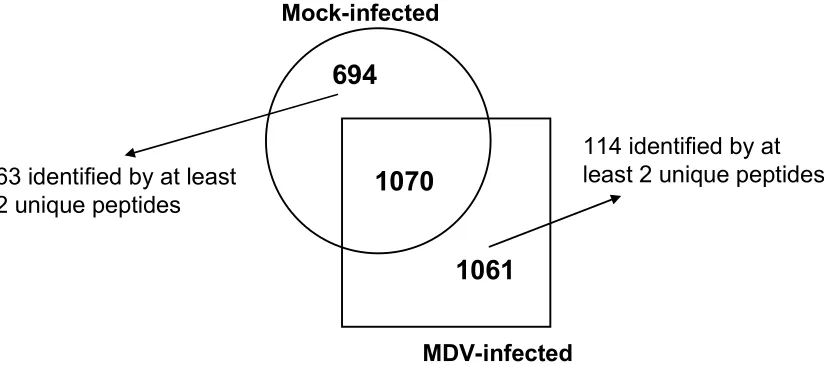
and MDV-infected samples……….…..94 Figure 2.2. Overall Gallus gallus protein comparison between mock-infected
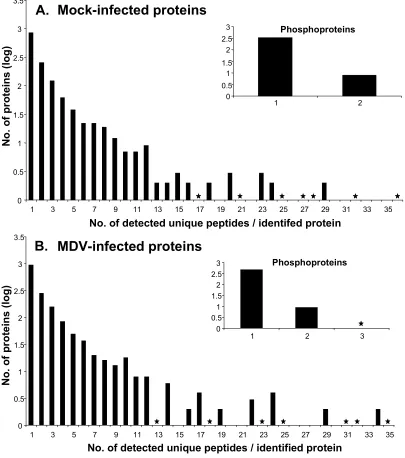
and MDV-infected samples………...95 Figure 2.3. Protein sequence coverage obtained from the mock-infected and
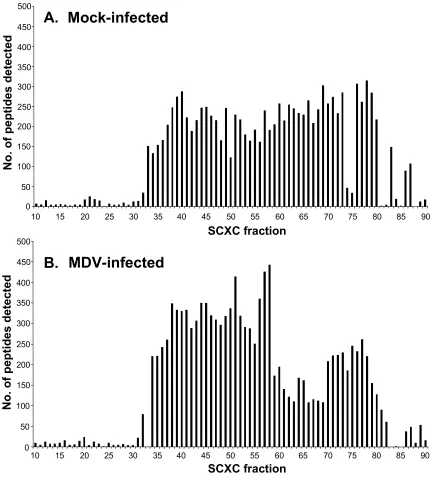
MDV-infected cells………96 Figure 2.4. SCXC peptide distribution for the mock-infected and MDV-infected
samples………...97 Figure 2.5. Peptide GRAVY distribution based on SCXC fractionation………...98 Figure 2.6. Protein and phosphoprotein GRAVY distribution for the mock-infected
Figure 2.7. Distribution of identified membrane proteins based on TMD assignment
by HMMTOP………...100
Figure 2.8. Distribution of identified membrane proteins based on TMD assignment by WoLF PSORT……….102
Figure 2.9. Protein subcellular localization obtained for the mock-infected and MDV-infected samples………104
CHAPTER 3 Figure 3.1. Schematic representation of methods for stable-isotope protein labeling for quantitative proteomics………121
Figure 3.2. Scheme of experiment employing the isotope-coded affinity tag (ICAT) technology……….……..123
Figure 3.3. Scheme of experiment employing the solid-phase isotope tagging (SIT) approach………...124
Figure 3.4. Cysteinyl peptide labeling using acid-labile isotope-coded extractants (ALICE)………...………..125
Figure 3.5. Synthesis of CIAST reagent………...………126
Figure 3.6. Mechanism for the release of the labeled peptide from cleavage of the Rink linker by TFA………..127
Figure 3.7. Tyrosine labeling by proximity………..………128
Figure 3.8. Determination of CIAST labeling capacity………131
Figure 3.9. ILGF-I labeling with the heavy version of the CIAST reagent………..132
CHAPTER 4
Figure 4.1. Protein recovery comparison between extraction methods…..………..160
Figure 4.2. 1-D SDS PAGE fractionation of cellular proteins……….…………162
Figure 4.3. Principal component analysis of aligned data to reveal replicate outliers……..163
Figure 4.4. Principal component analysis of precombined peptide data.………...………..164
Figure 4.5. Principal component analysis of precombined protein data……...………165
Figure 4.6. Peptide sequence elucidation by Rosetta biosoftware………..…..166
Figure 4.7. Clustering of differentially expressed proteins in RP2.………..………167
Figure 4.8. Clustering of differentially expressed proteins in CU115………..………169
Figure 4.9. Protein expression profile from feature intensity data……….………..171
Figure 4.10. Cellular localization distribution of annotated differentially expressed proteins from RP2 and CU115……….173
Figure 4.11. Cellular localization distribution of annotated differentially expressed proteins at 0 h, 12 h and 36 h post-virus reactivation in RP2………174
Figure 4.12. Cellular localization distribution of annotated differentially expressed proteins at 0 h, 12 h and 36 h post-virus reactivation in CU115………...176
Figure 4.13. Significant molecular and cellular functions assigned to identified differentially expressed proteins in CU115 at 0 h post-virus reactivation..……...178
CHAPTER 1
1.1. Introduction to proteomics
The systematic separation, identification, and characterization of the proteins present in a tissue or biological sample is called ‘proteomics’. This can be used to identify
biomarkers and to investigate signaling pathways. Among the various techniques with which proteins can be investigated on a large scale, mass spectrometry (MS) analysis has been established as the primary analytical tool because of its ability to handle the complexities associated with the proteome [1]. Other techniques such as two-dimensional gel
electrophoresis (2-DE), two-hybrid analysis, and protein microarrays fail to achieve the depth of informative proteome analysis possible with MS. This section will focus on the
application of MS to proteomics, including advances in the realm of quantification.
1.1.1. Instrumentation
Fundamentally, MS measures the mass-to-charge ratio (m/z) of gas-phase ions. Mass spectrometers consist of an ion source that converts analyte molecules into gas-phase ions, a mass analyzer that separates ionized analytes on the basis of the m/z ratio, and a detector that records the number of ions at each m/z value. The development in the late 1980s of
time-of-flight (TOF) mass analyzer, and Fourier-transform ion cyclotron resonance (FTICR) mass analyzer [5, 6]. In addition, ‘hybrid’ instruments have been designed to combine the capabilities of different mass analyzers. These various instruments vary in their physical principles and analytical performance [7].
1.1.2 Fragmentation
Tandem mass spectrometry (MS/MS) is a key technique for protein or peptide sequencing and post-translational modification (PTM) analysis. For MS/MS analysis, peptides are fragmented for sequence elucidation. Fragments can be generated in a number of ways. Collision-induced dissociation (CID) has been the most widely used MS/MS technique in proteomics research. In this method, gas-phase peptide/protein cations are internally heated by multiple collisions with neutral, non-reactive gas molecules, typically argon, helium or nitrogen. This leads to peptide backbone fragmentation of the C(O)-N bond resulting in a series of b-fragment and y-fragment ions, sufficient information for peptide sequencing (Figure1.1) [8]. Because of the slow-heating, energetic feature associated with this method, the internal fragmentation and neutral-losses of H2O, NH3, and labile PTMs are common. This also results in limited sequence information for large peptides (>15 amino acids) and intact proteins [9].
Another fragmentation technique, electron-capture dissociation (ECD) was
fragmentation resulting in richer product ion spectra and better sequence coverage, and the specific fragmentation feature of ECD preserves labile PTMs such as phosphorylation [11]. Therefore, it has become a powerful tool for top-down analysis of intact proteins and
detection and localization of PTMs [12-14]. However, ECD is most often constrained to the expensive, highly sophisticated FTICR instruments.
1.1.3. Bottom-up vs. top-down proteomics
Protein identification via MS is usually carried out in the form of whole-protein analysis (‘top-down’ proteomics) or analysis of enzymatically or chemically produced peptides (‘bottom-up’ proteomics) as seen in Figure 1.2 [22]. To date, various more efficient and effective MS-based proteomic strategies have been developed to tackle different
biological and analytical challenges among which the separation of peptides and proteins is a key element for both bottom-up and top-down approaches. These separation strategies involve multiple steps such as reversed-phase, size-exclusion, isoelectric focusing,
electrophoresis, and ion exchange at the protein level and/or peptide level, conducted off-line or on-line with mass spectrometric analysis.
prefractionation and peptides are separated by multidimensional chromatography followed by tandem mass spectrometric analysis, typically using rapidly scanning analyzers [28, 29].
The latter approach, commonly referred to as ‘shotgun proteomics’, has gained popularity in the proteomics field over the last decade. Tandem mass spectra are collected for as many peptides as possible, and the results are then searched by an algorithmic comparison against a database of proteins derived from genomic sequencing to identify the peptides [8]. The resolution and peak capacity of the multidimensional separation techniques are crucial to the success of the analysis [30]. Among these techniques, the multidimensional protein identification technology (MudPIT) [28], typically featuring cation exchange
chromatography coupled to a reverse phase column in line with a mass spectrometer, is now widely implemented and has been applied to analyses of complete cell lysates, organisms, tissue extracts, subcellular fractions, and other subproteomes [7]. More recent advances in MudPIT include improved peptide separation by ultra-high-pressure LC [31] and anion-and-cation mixed-bed ion exchange techniques [32].
abundance to be preferentially sampled, while information regarding the proteins represented as low abundance peptides in the complex mixture is commonly not obtained.
The proteomics strategy known as the top-down approach involves gas-phase ionization of intact proteins and subsequent high-resolution mass measurement of intact protein ions followed by their direct fragmentation inside the mass spectrometer (mainly FTICR) without prior digestion [33]. In theory, this approach places the entire sequence of the protein under examination, and consequently should enable a more complete
characterization of protein isoforms and any PTMs than the bottom-up approach.
Modifications are directly observed by the mass discrepancy between the measured mass and the DNA sequence predicted value.
A key to the top-down approach is the ability to fragment intact proteins. The
development of ECD using FTICR has greatly improved the dissociation efficiency for small to medium-sized proteins, but the tertiary structure of larger proteins complicates analyses. Han et al. demonstrated that the top-down approach can be used to analyze proteins as large as 229 kDa by ‘prefolding dissociation’ to dissociate 240 residues from each terminus [34]. Work from the Kelleher and Hunt laboratories has shown that the top-down approach, and a related ‘middle-down’ strategy using limited digestion to produce larger peptides (>5 kDa), have the capability of tackling challenging biological problems such as deciphering the ‘histone code’, which involves the characterization of combinatorial acetylations,
methylations, and phosphorylations [35, 36]. The development of new instrumentation and MS/MS techniques has also expanded demonstrations of the top-down approach on
Although the top-down approach is powerful in protein modification analysis, it is primarily performed with direct infusion of a single protein or simple protein mixture [separated off-line], therefore, the analytical throughput and efficiency for large-scale proteome analysis is still a major challenge. To address these limitations, increasing efforts have been made to improve the front-end separation of complex protein mixtures and automated database searching informatics [41, 42].
1.1.4. Quantitative proteomics
In 2-DE experiments, the staining patterns of proteins from two samples are
compared and 'up-' and 'downregulated' proteins are identified: band or spot intensity is used as the measure of quantitation [43]. However, 2-DE has limitations, such as low resolution and bias against membrane proteins. Furthermore, the dynamic range of protein expression can vary by as much as 7 to 12 orders of magnitude within a biological sample, and 2-DE can only visualize the most abundant of these proteins [44]. As a result, 2-DE gels have largely been superseded by MS-based proteomics in quantitative studies.
The dominant sample analysis workflow in MS-based proteomics utilizes site-specific enzymatic proteases such as trypsin to digest proteins to peptides. Peptides are fragmented in the mass spectrometer and the resulting product ion spectra are used to retrieve the corresponding peptide sequence from a database. Protein identification is
the absence of a protein, as the peptides may simply be below the threshold of detection [45]. This protein identification scheme provides a very limited picture of protein abundance in a sample. Although sensitive MS-based proteomic approaches readily identify a large number of proteins, bypassing the gel-visualization step preclude any measure of protein abundance in the sample. Moreover, most changes resulting from a targeted perturbation of a biological system are only significant if some quantitative information is obtained, and biology in general and systems biology in particular increasingly require quantitative data as an input for modeling [46].
Proteomic quantitative data can be measured as either the absolute amount of the protein in the sample or the relative change in protein amount between two samples. Absolute quantification is the determination of the amount of the substance in question. In relative quantification, the amount of a substance is defined in relation to another measure of the same substance, such as a fold change of protein abundance resulting from an induced perturbation.
1.1.4.1. Stable isotope coding
onto peptides or proteins, and 4) having cells incorporate the label metabolically. Regardless of the method chosen for labeling, the mass difference imparted by the stable isotope atoms should at least result in a 4-Da mass shift of the 'heavy' from the 'light' peptide, to minimize quantitative errors from isotopic overlap [49]. Deuterated peptides can be resolved during reversed-phase chromatography, and therefore the more expensive 13C- and 15N-based
reagents may be preferable, as the 13C- and 15N-labeled peptides most often coelute with their 12
C/14N counterparts, allowing a more straightforward comparison at specific retention times. The quantitative ratios can be determined from a relative comparison of signal intensities of the heavy and the light peptide.
The simplest approach for the introduction of stable isotope-coded peptides is to chemically synthesize them and add (i.e. spike) known quantities into the sample as internal standards. This was demonstrated by Desiderio and co-workers in the early 1990s for the quantification of neuropeptides [50], in extension of the well-established stable isotope-dilution approaches used in the pharmaceutical industry for the quantification of small molecules. Gygi and co-workers used an absolute quantitation strategy to quantify the phosphorylation status of separase during the Xenopus cell cycle [51]. To reduce
approach is usually limited to a small number of preselected proteins which are often discovered by a proteome-wide analysis.
The stable isotopes necessary for quantification can also be introduced into the peptides during proteolytic digestion [54]. The water molecule introduced during trypsin digestion will contain 18O if the digestion is performed in H218O water [55]. However, one or both carboxyl oxygens may be exchanged, leading to variability in the quantification. If only one 18O atom is incorporated, the mass offset of 2 Da is not sufficient to separate the isotopic envelopes, complicating quantification [56]. As a result, the 18O method has not been widely applied in quantitative proteomics.
Another approach to introduce stable isotope labels is to chemically modify the two proteomes under study - one with a light and the other with a heavy chemical reagent. In chemical modification-based approaches, stable isotope-bearing chemical reagents are targeted toward reactive sites on a protein or peptide. The prototypical example for
quantification of complex mixtures [49]. On the other hand, some proteins contain no cysteinyl residues while others have to be quantified on the basis of a single peptide. The large ICAT tag significantly influences fragmentation spectra [58], complicating peptide identification, and the deuterium tag results in separation of light and heavy peptides during reversed-phase chromatography [59]. Subsequent versions of the ICAT approach made the method more practical by substituting a cleavable and coeluting tag [60, 61]. A myriad of other labeling strategies have been developed, including a HysTag method. This method uses a 6x histidine tag to allow enrichment, a 2-thiopyridyl disulfide group to react with thiols, a deuterium-labeled alanine and a tryptic cleavage site to limit the size of the tag. This peptide reagent has been used to quantify cell-surface proteins in mouse brain [62]. With multiple reactive functional groups available in a given polypeptide chain and a choice of different labels, the quantitative tag can be specifically designed.
Apart from cysteine's sulfhydryl group, the primary amines or the carboxylic groups have been successfully labeled [63]. Amino and carboxyl group-directed approaches can, in principle, quantify every observed peptide. In addition, phosphoprotein isotope-coded affinity tags (PhIAT) [64], which combine stable isotope and biotin labeling to enrich and quantitatively measure differences in phosphorylation states of proteins have been applied in various phosphoproteomic studies [65].
fragmentation spectra [68]. These tags produce fragment ions of mass 114, 115, 116 or 117 Da in the 4-plex kit, or 113-121 Da in the 8-plex kit [commercially available from
InVitrogen], but through a carbonyl balance group, have the same initial mass [69]. Because labeled peptides from different states are isobaric, the mass spectra are relatively simple, and differential behavior is only revealed in fragmentation spectra. Moreover, this multiplexing strategy allows analysis of up to eight separately labeled pools of protein in a single analysis, increasing analytical throughput [70]. In this method, however, good peptide separation is paramount, as coeluting peptides of similar mass would contribute to the same reporter ions, complicating quantification [71].
In some approaches, the mass offset necessary to distinguish peptides from the two states is achieved by derivatization with two chemically different tags rather than an isotopic variant of the same tag. For example, lysines may be derivatized with an amidine label that only differs by a methylene group [72]. Although economical, these strategies can severely compromise accuracy of quantification because the two different tags generally have different reaction rates toward substrates, have distinct retention characteristics in chromatography and contribute to different ionization and extraction efficiencies of the derivatized peptides. If such strategies are used, the experiment should, at a minimum, be repeated using reverse labeling [73].
with stable isotope-labeled versions before the start of the experiment [74]. To achieve this, stable isotopes are introduced in growth media of living cells and become incorporated into all cellular proteins through cell growth and protein turnover. The number of stable isotopic atoms introduced is constrained by the chemical structure of these metabolic precursors. Cells are grown in light and heavy media, and give rise to two cell populations, which are distinguishable only by MS [75].
A principal advantage of metabolic incorporation over chemical labeling is that the label is present in live cells. Cells from state A and state B can be mixed before lysis, fractionation and purification, eliminating the variability of these steps on the accuracy of quantification. Stable isotope labeling by amino acids in cell culture (SILAC) has proven to be a simple yet very powerful metabolic labeling approach to quantitative proteomics. Amino acids containing stable isotopes, such as arginine bearing six 13C atoms, are supplied in growth media, thereby introducing this heavy amino acid to newly synthesized
tyrosineor methionine can also be labeled to study relative levels of protein methylation [78, 79].
1.1.4.2. Label-free quantitative proteomics
Although stable isotope-coded strategies have been widely used in quantitative proteomics, they often require expensive labeling reagents and additional sample preparation steps, suffer from an experimental dynamic range limitations of ~20:1 as well as an imposed limit on the multitude of samples in a single experiment. By contrast, label-free
quantification strategies are relatively simple, requiring no additional experimental steps or complex chemical labeling reactions. Also, the label-free approaches are amenable to complex study designs, as they are applicable to all types of biological samples and not limited by sample numbers [80]. Currently, there are two widely used and fundamentally different label-free strategies: quantification based on identification frequency, and quantification based on peak intensity. Unlike isotope-labeling methods, label-free approaches are susceptible to errors during parallel sample processing and suffer from analytical variability. To minimize these reproducibility problems and to ensure accurate quantification, these label-free methods are typically performed on the latest generation of mass spectrometers featuring high resolution, high mass measurement accuracy and high scanning rates, coupled to robust and high performance chromatography equipment.
1.1.4.2.1. Quantification based on spectral counting
abundance in which the spectral count of observed peptides is normalized to the number of observable peptides for the protein under consideration (Figure 1.3b) [48][81]. Since quantification by identification frequency is based on a data-dependent acquisition [DDA] mode of analysis, there are several factors that can influence quantification using this approach. For example, the dynamic exclusion of ions that have already been selected for fragmentation limits the number of spectra acquired per peptide ion and therefore limits the number of spectral counts. In addition, a larger protein will generate more measurable peptides than a smaller one. Other factors that can influence the correlation between spectral counts and protein abundance are peptide ionization efficiencies, unaccounted PTMs as well as the intrinsic random nature of DDA analysis based on its duty cycle [82, 83].
1.1.4.2.2. Quantification based on peak intensity
In an MS experiment, the intensity of the signal as the peptide elutes from the
chromatographic column can be plotted over time. The area under this curve is the extracted ion current (EIC) and, for the same peptide and experimental conditions, is linearly related to its amount. It is not possible to predict the MS detector response to any particular peptide because of unknown extraction and peptide ionization properties and therefore EICs of different peptides of the same protein are also very different. However, the average of the three most intense peptide EICs of a protein is a quantitative measure [84]. These
between two states. Although comparing intensities between different peptides is not possible because of different extraction yields during sample preparation and different ionization efficiencies, these sources of error do not apply when comparing the same peptide in different chromatographic runs. The two proteomes to be compared are processed and analyzed one after another and in exactly the same way. Intensities of the same peptide observed in two separate runs as equivalent spectral features are compared to determine their relative abundance, prior to sequence determination (Figure 1.3c) [48]. In complex mixture analysis using DDA, not all peptides are selected for fragmentation in every run. Therefore, a critical requirement is the ability to find and quantify the peptide in different runs, even if it has only been sequenced in one. Modern high mass measurement accuracy and
high-resolution mass spectrometers, as well as the development of the required software, now make this task much more feasible [85].
nonsystematic errors and are therefore less accurate. Some of these limitations can be minimized by normalizing between runs with spiked-in calibrants or by using abundant signature peptides as standard markers between runs [63].
1.1.4.3. Label free quantification by LC/MSE
The accurate mass and time tag (AMT) approach developed by the Smith group is a two stage strategy that exploits the high mass measurement accuracy and sensitivity of FTICR [86]. The first step is to generate a list of potential ‘mass and time tags’ that are tryptic peptides identified from the proteome of an organism, tissue or specific cell type by conventional LC/MS/MS analysis. This list of potential peptides is validated by FTICR-MS analysis to create an AMT database which assigns an accurate mass and an
LC-normalized elution time (NET) for each signature peptide. In the second step, the accurate mass NETs from each LC-FTICR-MS analysis is searched against the AMT database for peptide identification, and the intensity of the peptides from each analysis is used to calculate protein abundances.
More recently, a variation of label-free quantification known as LC/MSE was
protein identification (Figure 1.4). Unlike data-dependent LC/MS/MS, where the most abundant precursors in an MS scan are sequentially subjected to MS/MS fragmentation, MSE utilizes parallel, multiplex fragmentation where all peptide precursors are simultaneously fragmented throughout the chromatographic separation process regardless of intensity. This allows identification of lower abundance peptides and provides increased proteome coverage and dynamic range of protein identification compared to data-dependent LC/MS/MS. In addition, the LC-MSE mode of acquisition preserves the chromatographic profile of all the detected peptides and their associated fragment ions in a consistent and reproducible fashion [89]. These attributes of the LC/MSE approach enables the use of the integrated peptide peak area measurements for protein quantification. In combination with high resolution and reproducible chromatographic methods such as Ultra Performance LC (UPLC), this data-independent approach is better suited for quantification. Quantification using the LC/MSE approach is based on the principle that both the precursor ions and product ions share the same chromatographic elution profile and apex retention time. With the afforded mass measurement accuracy on both the product and precursor ions, the product ions are time-aligned and correlated to precursor ions to generate a list of exact mass retention time
1.1.5. Viral proteomics
There have been many studies using microarrays to profile cellular changes at the transcriptional level in response to viral infection or expression of an individual viral protein [92, 93]. However, there is a need to determine changes in the proteome, in part because changes observed in mRNA abundance do not always correspond to changes at the protein level [94]. In addition, many viral proteins affect protein turnover without affecting the transcription rate of the protein, for example, by promoting or interfering with
polyubiquitination [95].
upon EBV infection and expression of a single EBV protein, EBNA2, suggesting that it has a major role in affecting the cellular proteome in EBV infection [100].
Several groups used mass spectrometry-based approaches to identify differences in the abundances of host proteins after viral infecrion. Go et al. [101] used ICAT and 18O labeling coupled with LC/MS/MS to monitor changes in Drosophila melanogaster cells infected with flock house virus and found 150 proteins that were upregulated and 66 proteins that were downregulated. Baas et al. [102] used MS/MS after various chromatographic separations to identify changes induced by influenza virus infection of macaques and reported several changes for the 3,548 proteins identified. Bartee et al. [103] examined the effects of expressing Kaposi’s sarcoma associated herpesvirus membrane-associated K5 ubiquitin ligase protein in human cells using SILAC and identified over 100 cellular proteins, including 4 that were constantly down-regulated in the plasma membrane. More recently, SILAC was the method used to study changes in the avian nucleolar proteome in infectious bronchitis virus-infected cells [104].
In the field of virology, detection of virus-induced changes in cellular proteome has been greatly facilitated by 2-DE approaches, ICAT and SILAC mass spectrometry methods. These advances have enabled a more comprehensive characterization of virions, virus-virus and virus-host interactions involved in infection and pathogenesis [105].
1.2. Introduction to Marek’s disease
herpesvirus-2 or Marek’s disease virus (MDV), is a cell-associated α-herpesvirus that shares many of its biological properties with the lymphotropic oncogenic γ-herpesviruses such as Epstein-Barr virus and Kaposi’s sarcoma-associated virus in humans [106]. This makes MDV an excellent experimental model in viral oncology [107].
MD affects both commercial and backyard poultry and may result in death or severe production loss, thus making it the most costly viral disease in the poultry industry [108] [109]. Release of cell-free virus from the feather follicle epithelium (FFE) through shedding of feathers and skin flakes from infected chickens has been shown to be the mechanism by which the virus is spread [110]. Natural infection is unavoidable, as it occurs through
inhalation of this MDV-infective dander [111]. Although a vaccine was developed in the late 1960s, new MDV strains of higher virulence have rendered the vaccine less effective and increased the re-emergence of the disease [112, 113].
This section provides an overview of the disease and the virus, as well as recent advances in the MDV research field.
1.2.1. Disease history
MD kills more birds than any other viral disease and causes severe production loss in both layer and meat divisions of the poultry industry. It is a highly contagious viral
addition, due to similar pathology, confusion arose between MD and lymphoid leukosis, a neoplastic condition of the haemopoietic system of the domestic chicken. It was only after the World Veterinary Poultry Association conference in 1960 that MD was distinctly defined, and subsequent comparative studies using lymphoid leukosis virus and the agent of MD showed that each of these agents produced characteristic and distinct disease patterns [116].
Today, various signs and symptoms of the disease can be observed, ranging from enlarged reddened feather follicles and white bumps on the skin that form brown crusty scabs, progressive paralysis of the leg or wing from a lymphoid infiltration of peripheral nerves, eye lesions that lead to blindness, tumors on visceral organs such as heart, gonads, muscles and lungs, to atherosclerosis and a compromised immune system [117, 118]. Although a vaccine was developed in the late 1960s, new MDV strains of higher virulence have challenged efforts to regulate the disease by vaccination.
1.2.2. Marek’s Disease Virus 1.2.2.1. Virus Classification
Consistent with this classification, MDV genomes are linear double-stranded DNA molecules 160 to 18- Kbp in length, consisting of two unique regions flanked by inverted repeats [120, 121]. In addition, the replication origins of the serotype 1 MDV, serotype 2 MDV and HVT have structures similar to other α-herpesviruses [122, 123]. MDV makes for an excellent experimental model in viral oncology, as it harbors some obvious similarities with the Epstein-Barr virus and Kaposi’s sarcoma-associated herpesvirus in humans.
1.2.2.2. Oncogenic properties, attenuated strains, and vaccines
MDV is classified into three serotypes based on agar precipitation and
immunofluorescence. Serotype 1 MDV (MDV-1) includes all oncogenic strains and their attenuated derivatives. Serotype 2 MDV (MDV-2) consists of naturally occurring non-oncogenic strains. Serotype 3 MDV is a turkey herpesvirus (HVT) [124, 125]. Marek’s disease is controlled by live attenuated vaccines derived from apathogenic non-oncogenic strains of MDV from serial passages in cell cultures. Although effective in preventing the development of lymphoid tumors and protecting against mortality, none of the currently available vaccines are able to completely block virus multiplication and shedding at the FFE. This phenomenon has driven the continued evolution of more virulent field strains of MDV-1 [126, 127] [113].
passages using chicken kidney cell cultures [129]. By 1971, a new vaccine based on HVT (Fc126 strain) proved to be more effective, and it was licenced initially in the U.S.A. and quickly adopted worldwide [130]. In 1969, Rispens et al. [131, 132] reported that
inoculation of an MDV-1 isolate of low pathogenicity into day-old MD susceptible chicks protected them from mortality and gross pathological lesions. An attenuated vaccine strain, designated CVI988 (also called Rispens strain), was developed and licenced in 1973, but it was not launched in the U.S.A. until 1994. In early studies, the HVT and Rispens vaccines provided similar protective benefits [133, 134], but later the Rispens vaccine was shown to provide better protection against highly virulent strains of MDV [135]. The first MDV-2 licensed vaccine was the SB-1 strain [136] which was originally introduced in the mid-1980s in combination with the HVT vaccine. The SB-1/HVT bivalent vaccine was reported to provide superior protection against ‘very virulent’ (vv) MDV-1 field strains compared with the administration of either vaccine separately [137, 138].
1.2.3. Pathogenesis of MDV infection
1.2.3.1. Pattern of virus infection with oncogenic virus (Serotype-1)
Many infectious diseases proceed in a direct fashion from infection to a specific pathological expression. In MD, infection leading to lymphoma formation in susceptible birds is complex, generally comprising of four sequential phases: 1) early cytolytic, 2) latency, 3) late cytolytic, and 4) transformation [140]. Although the first two stages are essentially distinct, and latent infection in certain cell types is a prerequisite to
transformation, both latent and transforming infections may exist intermixed with cytolytic infections in different cell populations in the later stages, as lymphomas are developing. In addition, a permanent immunosuppression develops concurrent with the late cytolytic phase.
second week and results in damage to primary lymphoid organs. Beginning as early as 12-14 dpi to as late as several weeks or even months after infection, lesions may be observed in a number of lymphoid organs, visceral organs, muscle, skin, the eye, peripheral nerves, and brain. By this stage, a permanent immunosuppression affecting both humoral and cell-mediated immunity is generally apparent and may be so severe as to permit lethal infections with other organisms in the absence of any lymphomatous lesions.
1.2.3.2. Pattern of virus infection with nononcogenic MDV (Serotype 2) and HVT (Serotype 3)
There are 3 types of nononcogenic virus that can be compared with the oncogenic serotype-1 MDV: attenuated serotype-1 MDV, naturally nononcogenic serotype-2 MDV, and serotype-3 HVT strains. They all have a general pattern of tissue and organ infection
comparable to the oncogenic serotype-1 variant, but attenuated MDV and HVT greatly differ in the complete absence of productive, cytolytic infection in lymphoid organs or other tissues, despite being able to be isolated from latently infected cells in lymphoid organs or blood. Serotype-2 viruses cause a low level of cytolytic infection of lymphoid organs during the early infection period, but then the infection becomes latent [142]. In addition, serotype-2 viruses can spread horizontally, while attenuated MDV and HVT cannot [143].
1.2.4. Host immune responses to infection
production. Specific immune responses are antigen-dependent and require lymphocyte activation to produce specific antibodies and antigen-specific CD4+ and CD8+ T cells. However, this division is not always clear, as some cytokines can be part of the non-specific response system but also part of the specific responses when released by antigen-specific cytotoxic T cells (CTL) [144].
The shift from a lytic infection mainly in B cells to a latent phase in the activated T cells, is poorly understood, but it is likely regulated by the initial host immune responses to infection. It is speculated that host-virus interaction and subsequent immune responses play a critical role in latency regulation. Studies have shown that impairment of immune
responses during the early cytolytic infection delays establishment of latency with an
extended lytic cycle and destruction of T and B cells, resulting in immunosuppressive effects [145]. Cytokines, macrophages, NK cells, cytotoxic T ymphocytes, and antibodies all play important roles in the outcome of MDV infection.
Studies show that interferon (IFN)-γ expression as well as interleukin (IL)-6 and IL8 transcriptional levels are upregulated in the spenocytes of MD susceptible birds upon infection [146]. The transcriptional activities of IL-6 and IL-8 were not detected in MD-resistant birds, suggesting that they are driving factors in maintaining latent infection in resistant birds and leading to T-cell transformation in susceptible birds. In addition, the expression level of inducible nitric oxide synthase (iNOS) that catalyzes the production of nitric oxide (NO) is positively influenced by increased transcriptional activity of IL-8 and IFN-γ, which correlates with the findings that the production of NO by activated
reported as a chemoattractant to signal T cells towards the site of infection [148]. A continuous depletion of macrophages over the progression of the disease results in an increased incidence of MD-related complications and tumor development. Chemokines, such as macrophage inflammatory protein 1 β (MIP1β) and K203, are upregulated in resistant chickens which may in turn increase the production of IFN-γ via NK cells [149]. NK cells have also been reported to play a critical role in controlling early infection with enhanced cell activity and overall overexpression of NK lysine and granzyme A observed by 3-4 dpi [150].
Although immune responses to MDV infection are predominantly cell-mediated, antibody-mediated virus neutralization and antibody-dependent cell cytotoxicity (ADCC) are essential components of the humoral immune response, specifically when MDV antigens are expressed on cell surfaces and target those infected cells for destruction [155]. Previous studies showed that antibodies to MDV glycoprotein B (gB) can inhibit virus penetration of host cells, syncytia formation, and cell-to-cell spread, all of which help to localize infection [156, 157]. Although ADCC-like responses have been reported for MDV, neither the effector cells nor the antigens have been characterized [145].
1.2.5. Important MDV genes
MDV replication follows the strictly regulated pattern of herpesvirus replication in which immediate early (IE) genes are transcribed first. Their gene products transactivate the early genes needed for DNA replication followed by the activation of late genes coding for the structural proteins. Many genes in the repeat areas are unique for serotype 1 MDV strains and have been implicated in the transformation of T cells or the establishment and maintenance of latency [158, 159].
resulting in damage to the primary lymphoid organs and immunosuppression. In those infected birds that develop tumors, transformation of latently infected CD4+ T cell occurs [162]. Transformed cells contain a greater number of viral DNA copies (at least 10-20) than latently infected cells [158] and a number of viral genes are expressed. The transformed cells form tumors and ultimately lead to the death of the host.
A few viral genes have been identified as contributors to the transformation of T cells and the maintenance of that state. During attenuation of an oncogenic MDV by passage in cell culture, the protein termed the ‘A’ antigen disappeared [129]. For this reason, it was first believed to be associated with pathogenicity. However, it was later shown to be a
glycoprotein, a homologue of gC of HSV, that was produced in small amounts by attenuated virus [163, 164]. A mutation in the gC gene of MDV greatly reduced its oncogenicity in chickens [165], and studies of pathogenesis of attenuated MDVs have suggested that
attenuation greaty reduces the efficiency of infection, or replication in lymphocytes [166]. It is possible that the change in the regulation of gC is at least partly responsible for this
reduced infection of lymphocytes and could be contributing to the reduction in oncogenicity. An important feature of the MDV genome is a region of 132 base pair direct repeats which are amplified upon attenuation of the oncogenic virus through serial passage in cell culture [167]. This region encodes MDV-specific genes that are expressed in transformed cell lines, namely Marek’s EcoRI-Q bZIP transactivator (meq), MDV-encoded IL-8 (vIL-8) [169], infected cell protein 4 (ICP4) [160-161] and an origin of lytic replication (Ori) [170]. The Ori regulates the early lytic expression of the phosphoprotein-encoding gene, pp38
[172]. Meq and vIL-8 are expressed from the Ori in the opposite direction of the pp38 gene [169]. During lytic infection, Meq is expressed as an IE gene, and its gene product is known to bind to a number of cell cycle regulatory proteins, and has the ability to transactivate or transrepress gene expression depending on its dimerization partner or phosphorylation state [173]. Downstream of the Meq gene is vIL-8, a true late gene with an apparent function in MDV early dissemination in vivo [174]. Since IL-8 is a chemoattractant for T cells [173], production of IL-8-like molecules by MDV-infected B cells could attract T cells to facilitate the switch from B to T cells during lytic infection [148]. Although v-IL8 does not appear to be important for the establishment of latency, its involvement in early cytolytic infection in lymphoid organs impacts the overall transformation efficiency of MDV [175]. It should also be noted that ICP4 is amongst the IE gene products of herpesviruses, and serves as a major transactivator that plays a crucial role in the regulation of transcription of many early and late genes [176]. The importance of ICP4 in MDV pathogenesis was demonstrated by a family of antisense transcripts in lymphoblast toid cells and lymphomas: it has been suggested that these small RNA antisense to ICP4 acted as molecular switches for turning off MDV replication upon establishment of latency [177].
1.2.6. Marek’s disease virus resistance
major histocompatibility complex (MHC) significantly influence the susceptibility of
chickens to MD [178]. Numerous studies have demonstrated that following MDV infection, the disease develops at different rates in different chicken strains [179]. The MHC-linked resistance generally involves regulatory components of cell-mediated and/or humoral immune responsiveness or differences in the specificity of immune response to MDV or tumor cells. An important study demonstrated that MD resistance is attributable to genes in the ‘minimal essential’ MHC region [180]. In addition to MHC genes, non-MHC genes also confer resistance to MD, affecting parameters such as cellular interactions, numbers or differences in infected target cells, and regulation of cytokines and innate immunity. Using specific-pathogen-free chickens from a series of 19 recombinant congenic strains and their 2 progenitor lines (one MD-resistant line and another MD-susceptible line), vaccine challenge experiments were conducted to examine the effect of host genetic variation on vaccine efficacy. It was concluded that non-MHC host genetic variation significantly affects MD vaccine efficacy [181].
1.2.7. Proteomics in the study of MDV infection
A proteomic study of Marek’s disease lymphoma cells enabled the identification of a soluble form of the Hodgkin’s disease antigen CD30 [107]. This led to a more thorough characterization of an MDV-transformed cell line, with the conclusion that the pro-metastatic integrin signaling pathway and the ERK/MAPK signaling pathways were the two
predominant signaling pathways represented by the identified proteins [185]. A more recent proteomic analysis of host responses to MDV infection in spleens of genetically resistant and susceptible chickens revealed differential expressed proteins involved in signal transduction, protein degradation, antigen representation, RNA processing and cell proliferation [186].
1.3. Aim of dissertation project
To identify key regulators during MDV infection and manifestation of MD, a MS-based proteomic approach was developed. A qualitative protein mining study was carried out, comparing mock-infected and MDV-infected chicken embryo fibroblast (CEF) cells using multidimensional liquid chromatography-tandem mass spectrometry. To enable a quantitative approach, a novel isotope-coded labeling method was developed and optimized with a model peptide and protein system. Due to complications encountered with the labeling approach on a proteome sample, a label-free quantitative approach was explored. The new strategy using LC/MSE was developed for an expression proteomics study using MDV-infected tumor cell lines during chemically-induced MDV reactivation. An
1.4. References
(1) Pandey, A.; Mann, M. Proteomics to study genes and genomes. Nature 2000, 405 (6788), 837-46.
(2) Fenn, J. B.; Mann, M.; Meng, C. K.; Wong, S. F.; Whitehouse, C. M. Electrospray
ionization for mass spectrometry of large biomolecules. Science 1989, 246 (4926), 64-71. (3) Tanaka, A.; Waki, H.; Ido, Y.; Akita, S.; Yoshida, Y.; Yoshida, T. Protein and Polymer
Analyses up to m/z 100 000 by Laser Ionization Time of flight Mass Spectrometry. Rapid
Commun Mass Spectrom 1988, 2 (20), 151-3.
(4) Karas, M.; Hillenkamp, F. Laser desorption ionization of proteins with molecular masses exceeding 10,000 daltons. Anal Chem 1988, 60 (20), 2299-301.
(5) Domon, B.; Aebersold, R. Mass spectrometry and protein analysis. Science 2006, 312
(5771), 212-7.
(6) Yates, J. R., 3rd. Mass spectral analysis in proteomics. Annu Rev Biophys Biomol Struct
2004, 33 297-316.
(7) Yates, J. R.; Ruse, C. I.; Nakorchevsky, A. Proteomics by mass spectrometry: approaches, advances, and applications. Annu Rev Biomed Eng 2009, 11 49-79.
(8) Marcotte, E. M. How do shotgun proteomics algorithms identify proteins? Nat Biotechnol.
2007, 25 (7), 755-7.
(9) Shukla, A. K.; Futrell, J. H. Tandem mass spectrometry: dissociation of ions by collisional activation. J Mass Spectrom 2000, 35 (9), 1069-90.
(10) McLafferty, F. W.; Kelleher, N. L.; Begley, T. P.; Fridriksson, E. K.; Zubarev, R. A.; Horn, D. M. Two-dimensional mass spectrometry of biomolecules at the subfemtomole level. Curr Opin Chem Biol 1998, 2 (5), 571-8.
(12) Sze, S. K.; Ge, Y.; Oh, H.; McLafferty, F. W. Top-down mass spectrometry of a 29-kDa protein for characterization of any posttranslational modification to within one residue.
Proc Natl Acad Sci U S A 2002, 99 (4), 1774-9. Epub 2002 Feb 12.
(13) Shi, S. D.; Hemling, M. E.; Carr, S. A.; Horn, D. M.; Lindh, I.; McLafferty, F. W. Phosphopeptide/phosphoprotein mapping by electron capture dissociation mass spectrometry. Anal Chem 2001, 73 (1), 19-22.
(14) Cooper, H. J.; Hakansson, K.; Marshall, A. G. The role of electron capture dissociation in biomolecular analysis. Mass Spectrom Rev 2005, 24 (2), 201-22.
(15) Pitteri, S. J.; Chrisman, P. A.; Hogan, J. M.; McLuckey, S. A. Electron transfer ion/ion reactions in a three-dimensional quadrupole ion trap: reactions of doubly and triply protonated peptides with SO2*. Anal Chem 2005, 77 (6), 1831-9.
(16) Syka, J. E.; Coon, J. J.; Schroeder, M. J.; Shabanowitz, J.; Hunt, D. F. Peptide and protein sequence analysis by electron transfer dissociation mass spectrometry. Proc Natl
Acad Sci U S A 2004, 101 (26), 9528-33. Epub 2004 Jun 21.
(17) Wiesner, J.; Premsler, T.; Sickmann, A. Application of electron transfer dissociation (ETD) for the analysis of posttranslational modifications. Proteomics 2008, 8 (21), 4466-83.
(18) Coon, J. J.; Ueberheide, B.; Syka, J. E.; Dryhurst, D. D.; Ausio, J.; Shabanowitz, J.; Hunt, D. F. Protein identification using sequential ion/ion reactions and tandem mass spectrometry. Proc Natl Acad Sci U S A 2005, 102 (27), 9463-8. Epub 2005 Jun 27. (19) Chi, A.; Bai, D. L.; Geer, L. Y.; Shabanowitz, J.; Hunt, D. F. Analysis of intact proteins
on a chromatographic time scale by electron transfer dissociation tandem mass spectrometry. Int J Mass Spectrom 2007, 259 (1-3), 197-203.
(20) O'Connor, P. B.; Cournoyer, J. J.; Pitteri, S. J.; Chrisman, P. A.; McLuckey, S. A. Differentiation of aspartic and isoaspartic acids using electron transfer dissociation. J Am
Soc Mass Spectrom 2006, 17 (1), 15-9. Epub 2005 Dec 9.
(22) Kellie, J. F.; Tran, J. C.; Lee, J. E.; Ahlf, D. R.; Thomas, H. M.; Ntai, I.; Catherman, A. D.; Durbin, K. R.; Zamdborg, L.; Vellaichamy, A.; Thomas, P. M.; Kelleher, N. L. The emerging process of Top Down mass spectrometry for protein analysis: biomarkers, protein-therapeutics, and achieving high throughput. Mol Biosyst 2010, 6 (9), 1532-9. Epub 2010 Mar 29.
(23) Li, R. X.; Zhou, H.; Li, S. J.; Sheng, Q. H.; Xia, Q. C.; Zeng, R. Prefractionation of proteome by liquid isoelectric focusing prior to two-dimensional liquid chromatography mass spectrometric identification. J Proteome Res 2005, 4 (4), 1256-64.
(24) Gygi, S. P.; Corthals, G. L.; Zhang, Y.; Rochon, Y.; Aebersold, R. Evaluation of two-dimensional gel electrophoresis-based proteome analysis technology. Proc Natl Acad Sci U S A 2000, 97 (17), 9390-5.
(25) Santoni, V.; Molloy, M.; Rabilloud, T. Membrane proteins and proteomics: un amour impossible? Electrophoresis 2000, 21 (6), 1054-70.
(26) Corthals, G. L.; Wasinger, V. C.; Hochstrasser, D. F.; Sanchez, J. C. The dynamic range of protein expression: a challenge for proteomic research. Electrophoresis 2000, 21 (6), 1104-15.
(27) Oh-Ishi, M.; Satoh, M.; Maeda, T. Preparative two-dimensional gel electrophoresis with agarose gels in the first dimension for high molecular mass proteins. Electrophoresis
2000, 21 (9), 1653-69.
(28) Washburn, M. P.; Wolters, D.; Yates, J. R., 3rd. Large-scale analysis of the yeast
proteome by multidimensional protein identification technology. Nat Biotechnol 2001, 19
(3), 242-7.
(29) Wolters, D. A.; Washburn, M. P.; Yates, J. R., 3rd. An automated multidimensional protein identification technology for shotgun proteomics. Anal Chem 2001, 73 (23), 5683-90.
(30) Fournier, M. L.; Gilmore, J. M.; Martin-Brown, S. A.; Washburn, M. P.
Multidimensional separations-based shotgun proteomics. Chem Rev 2007, 107 (8), 3654-86. Epub 2007 Jul 25.
(32) Motoyama, A.; Xu, T.; Ruse, C. I.; Wohlschlegel, J. A.; Yates, J. R., 3rd. Anion and cation mixed-bed ion exchange for enhanced multidimensional separations of peptides and phosphopeptides. Anal Chem 2007, 79 (10), 3623-34. Epub 2007 Apr 6.
(33) McLafferty, F. W.; Breuker, K.; Jin, M.; Han, X.; Infusini, G.; Jiang, H.; Kong, X.; Begley, T. P. Top-down MS, a powerful complement to the high capabilities of proteolysis proteomics. FEBS J 2007, 274 (24), 6256-68. Epub 2007 Nov 16.
(34) Han, X.; Jin, M.; Breuker, K.; McLafferty, F. W. Extending top-down mass spectrometry to proteins with masses greater than 200 kilodaltons. Science 2006, 314 (5796), 109-12. (35) Siuti, N.; Kelleher, N. L. Decoding protein modifications using top-down mass
spectrometry. Nat Methods 2007, 4 (10), 817-21.
(36) Garcia, B. A.; Shabanowitz, J.; Hunt, D. F. Characterization of histones and their post-translational modifications by mass spectrometry. Curr Opin Chem Biol 2007, 11 (1), 66-73. Epub 2006 Dec 6.
(37) Sharma, S.; Simpson, D. C.; Tolic, N.; Jaitly, N.; Mayampurath, A. M.; Smith, R. D.; Pasa-Tolic, L. Proteomic profiling of intact proteins using WAX-RPLC 2-D separations and FTICR mass spectrometry. J Proteome Res 2007, 6 (2), 602-10.
(38) Chen, J.; Shiyanov, P.; Zhang, L.; Schlager, J. J.; Green-Church, K. B. Top-down characterization of a native highly intralinked protein: concurrent cleavages of disulfide and protein backbone bonds. Anal 2010, 82 (14), 6079-89.
(39) Vellaichamy, A.; Tran, J. C.; Catherman, A. D.; Lee, J. E.; Kellie, J. F.; Sweet, S. M.; Zamdborg, L.; Thomas, P. M.; Ahlf, D. R.; Durbin, K. R.; Valaskovic, G. A.; Kelleher, N. L. Size-sorting combined with improved nanocapillary liquid chromatography-mass spectrometry for identification of intact proteins up to 80 kDa. Anal Chem 2010, 82 (4), 1234-44.
(40) Resemann, A.; Wunderlich, D.; Rothbauer, U.; Warscheid, B.; Leonhardt, H.; Fuchser, J.; Kuhlmann, K.; Suckau, D. Top-down de Novo protein sequencing of a 13.6 kDa camelid single heavy chain antibody by matrix-assisted laser desorption ionization-time-of-flight/time-of-flight mass spectrometry. Anal 2010, 82 (8), 3283-92.
(41) Parks, B. A.; Jiang, L.; Thomas, P. M.; Wenger, C. D.; Roth, M. J.; Boyne, M. T., 2nd; Burke, P. V.; Kwast, K. E.; Kelleher, N. L. Top-down proteomics on a chromatographic time scale using linear ion trap fourier transform hybrid mass spectrometers. Anal Chem
(42) Garcia, B. A. What does the future hold for Top Down mass spectrometry? J Am Soc
Mass Spectrom 2010, 21 (2), 193-202. Epub 2009 Oct 29.
(43) Unlu, M.; Morgan, M. E.; Minden, J. S. Difference gel electrophoresis: a single gel method for detecting changes in protein extracts. Electrophoresis 1997, 18 (11), 2071-7. (44) Smith, R. Two-dimensional electrophoresis: an overview. Methods Mol Biol 2009, 519
1-16.
(45) Lu, B.; Motoyama, A.; Ruse, C.; Venable, J.; Yates, J. R., 3rd. Improving protein identification sensitivity by combining MS and MS/MS information for shotgun
proteomics using LTQ-Orbitrap high mass accuracy data. Anal Chem 2008, 80 (6), 2018-25. Epub 08 Feb 15.
(46) Peddinti, D.; Memili, E.; Burgess, S. C. Proteomics-based systems biology modeling of bovine germinal vesicle stage oocyte and cumulus cell interaction. PLoS 2010, 5 (6), e11240.
(47) Iliuk, A.; Galan, J.; Tao, W. A. Playing tag with quantitative proteomics. Anal Bioanal Chem 2009, 393 (2), 503-13. Epub 2008 Oct 10.
(48) Nesvizhskii, A. I.; Vitek, O.; Aebersold, R. Analysis and validation of proteomic data generated by tandem mass spectrometry. Nat Methods 2007, 4 (10), 787-97.
(49) Gevaert, K.; Impens, F.; Ghesquiere, B.; Van Damme, P.; Lambrechts, A.;
Vandekerckhove, J. Stable isotopic labeling in proteomics. Proteomics 2008, 8 (23-24), 4873-85.
(50) Kusmierz, J. J.; Sumrada, R.; Desiderio, D. M. Fast atom bombardment mass
spectrometric quantitative analysis of methionine-enkephalin in human pituitary tissues.
Anal Chem 1990, 62 (21), 2395-400.
(51) Stemmann, O.; Zou, H.; Gerber, S. A.; Gygi, S. P.; Kirschner, M. W. Dual inhibition of sister chromatid separation at metaphase. Cell 2001, 107 (6), 715-26.
(53) Kirkpatrick, D. S.; Gerber, S. A.; Gygi, S. P. The absolute quantification strategy: a general procedure for the quantification of proteins and post-translational modifications.
Methods 2005, 35 (3), 265-73. Epub 2005 Jan 12.
(54) Mirgorodskaya, O. A.; Kozmin, Y. P.; Titov, M. I.; Korner, R.; Sonksen, C. P.; Roepstorff, P. Quantitation of peptides and proteins by matrix-assisted laser
desorption/ionization mass spectrometry using (18)O-labeled internal standards. Rapid
Commun Mass Spectrom 2000, 14 (14), 1226-32.
(55) Stewart, II; Thomson, T.; Figeys, D. 18O labeling: a tool for proteomics. Rapid Commun Mass Spectrom 2001, 15 (24), 2456-65.
(56) Heller, M.; Mattou, H.; Menzel, C.; Yao, X. Trypsin catalyzed 16O-to-18O exchange for comparative proteomics: tandem mass spectrometry comparison using MALDI-TOF, ESI-QTOF, and ESI-ion trap mass spectrometers. J Am Soc Mass Spectrom 2003, 14 (7), 704-18.
(57) Gygi, S. P.; Rist, B.; Gerber, S. A.; Turecek, F.; Gelb, M. H.; Aebersold, R. Quantitative analysis of complex protein mixtures using isotope-coded affinity tags. Nat Biotechnol
1999, 17 (10), 994-9.
(58) Borisov, O. V.; Goshe, M. B.; Conrads, T. P.; Rakov, V. S.; Veenstra, T. D.; Smith, R. D. Low-energy collision-induced dissociation fragmentation analysis of cysteinyl-modified peptides. Anal Chem 2002, 74 (10), 2284-92.
(59) Zhang, R.; Sioma, C. S.; Thompson, R. A.; Xiong, L.; Regnier, F. E. Controlling deuterium isotope effects in comparative proteomics. Anal Chem 2002, 74 (15), 3662-9. (60) Hansen, K. C.; Schmitt-Ulms, G.; Chalkley, R. J.; Hirsch, J.; Baldwin, M. A.;
Burlingame, A. L. Mass spectrometric analysis of protein mixtures at low levels using cleavable 13C-isotope-coded affinity tag and multidimensional chromatography. Mol
Cell Proteomics 2003, 2 (5), 299-314. Epub 2003 May 23.
(61) Li, J.; Steen, H.; Gygi, S. P. Protein profiling with cleavable isotope-coded affinity tag (cICAT) reagents: the yeast salinity stress response. Mol Cell Proteomics 2003, 2 (11), 1198-204. Epub 2003 Sep 23.