Proceediigs of the I 8ft Slmposium of MaLaysid Chemical Ensineers
FAULT DLAGNOSTIC ALGORITHM FOR PRECUT
FRACTIONATION COLUMN
II. Y. H€ng, M. w' Ali-, M. Z. Kamsah
Process Control and Safety Laboratory, Depanment of Chemical Engineering, Faculty of Chemical and Natual Resouces Engineedng, Univeffiti Tehologi Maiaysia,
81310 UTM Skudai, Johor, Malaysia.
'Corresponding author. Phone: +60?-5 53 5602, Iax: +607-5581463 Email: m.w.ali@fkk1(sa.utm.my
AASTRACT
This pap€r presents an algorithm which can be used 10 detect and diagnose un€xpected process faults in the operation of fatty acid precut fractionation colunrn. The fault diagnostic algoritbm is supported by the process history based method and developed by using Borland C+ Builder 6.0. The faity acid pre cut &actionation colunln chos€n as a cas€ study is modeled by the cornmercial simulator, HYSYS.Plant. The discriminator for the derection section is developed by using statistical xechniques, where the control limils lor each selected monitoring variable were rcpresented in 'Higl', 'Normal', and'Low' discrete. llazard and Operabiliry Study (HAZOP) is used to suppot the diagnosis task. The algorithm has been successtui in detecting the deviations of each variable by t€sting the dau set. The tested data is used !o interyr€i the pattem of the chart, where fault is considered to occur if one variable is out of control limiis. The system promptly diagnos€s the deviations and gives usetul guidance to the user by displaying lhe causes and consequences of the faults.
Keywordsi Faull Detection and Diagnosis, Qualitative Process History Based, HAZOP Studv. Statistical Technioue
1 INTRODUCTION
Process control cornmunily has been successful in removing rcgllatory contol ftom the hands of human operators to computer automation especially in a complicated plant operation. This has led to gleat progress in the quest for higher productivity, process safery, prccess effici€ncy and profitability. Despite the progr€ss in the distributed and model predictive conhol systems, managing proc€ss plants during the abnonnal events and emergencies still remains a nanual aclivity performed by hunan opelators.
The pu?ose of this research is to develo! a deteclion and diagnosis algo.ithm supported by knowledge base exped system which is one type of an artificiai intelligence tools. One approach of ihe diagnostic algorithm is to use process history based Cvenkatasubramanian et al, 2003). The tunction of this algorithm is to detect process deviation by using control chad methodolog./ and then provide ihe informalion to plant opemtors. Statislical Process Cont1ol (SPC) and IIAZOP study arc used as the knowiedge base and then are constructed into lhe computer program by using production rules. In this shrdy, a fatty acid fractionation precut column has been chosen as a case study.
2 THEORY
Proceedings of th€ I 8th Slmlosium of Malavsian Chemical Enginee6
A diaenosic
cras.iner
is senerauv
abre
ro -race
an))"H",T#y,T#".ff.t::::::
i
,:T:trriil,T"ril"ffi
f.iqi'ii!+jffi
[i3;i:ftrr1*"iy3;s::s
H::;:H1'l',:ltitrj;:filj,ll""T"',1'''#l'J;;;;,'ei-han.
the
know,edge
ftom
past
"ll*J*ii .lri r' the process is referred to as shallow' compiied' evidentialor process
:{F?:ilfu
;;,i;i,;';;ilk;ri;:on';a...au'r."r"'q,"'oderectlhevaridriooo'paranrete'Hx#rli#:ff
*H'lr;;fi
m"iJ"1h;ff
;r;#:;'"*i$
sPCr'".'r'"i?""';rr"r'!i
"l"n
,-po.tant
part
or
quaritv
;f5*':#:*f 'ffii* XH::i,:t
i;:ffi tT',I:i#:f#ffi
'lllxli"T'il"xl';;:
;;"i.".
"o,'oor
"odo""i",,."
spc,o
''T:{:ii";Ti';:i?Lil,";i"?Tlil"'*Tl"lJ"iillf""$iffi
"i;""*,",:,h:
:r*i.c
::x,*r;';::**;m,"::.ifi""ffi
i:i j'*T:':i;';Hfi
:'Ji:H?il:
rx#iflrn"'ril] ii"trslTffi
'i::$'i"3""1'ff
?;ll;
Jii'r'l'*f
1i
:1:j:lil*l,;#*:T*l*r*i::r*1":lv
;t"IiT"
":llT
x',J,::,'H'j
consequences of Process fault
3 METITODOLOGY
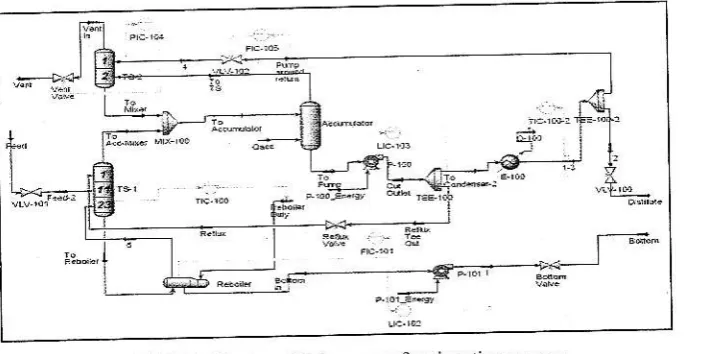
T h e m o d e l o f p r e c u t n a c r ' o n a | o r p r o c e r c | . o e v e l o p e d b ) u ' i n g H Y s \ S P l a n r s i m u l a r o r r < s h o w n i n l i e L r e I T h e p r e c u r f t i c r i o n a d o n c o l u r n n i s ' ! " e d l o r l h e s e p a r a l r o n o r D a r -i " - . -i " -i r . o -i " ' -i l r * o - a r c r s c o r -i ' t o r c 8 a n d C l 0 a n d r h e n e r b o r o m p r o d u c t i s p u m p e d ; ; ; ; ; , ; h , ; ; ? " ; f t n h e r s e p a r a n o n r h e o r o c e " ( i n \ o r \ e ' ' - $ o ryres ofopem'ion'
"'"*.""";'fi'Jlis1"l,";"::'"T:::.::liil|;.1:i
f;
.",w6f
J:iii'i::"J#;
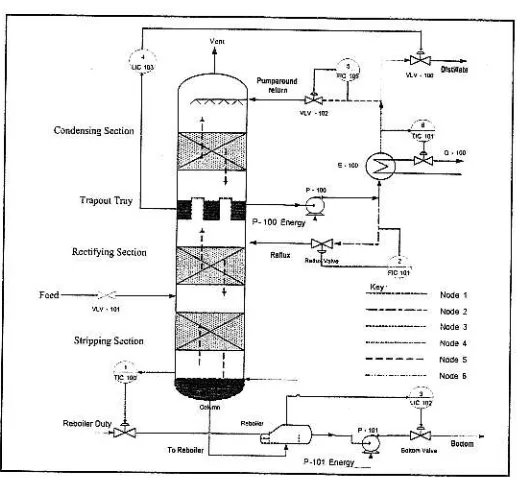
o u i b a s e d o i a reicat f r a c r i o n a r i o n c o l J r n r r r " s h o $ n i 0 F i g u r e 2
FIGURE 1 Plant model for precut fractionation proc€ss
In bu,ldinq lbe algorirhm .nere dre tour phases r'\ olved dc shovm in Ligurc I lri<nrg i*i*i": ir',f.'. f-t-* a p-ecur ft,cdonation column are chose! as mon rorirg \ ariables sil il" ore iefined oa'ed oo a sPecifc "'ream oI equioneor beiog mof i oted n J b p * a t i " * " 1 . a
" u ' b a s e d o n r r ' e s e n o d e s lh e d e l n i u o n o ' n o d e q i s s h o u o i n irtr. r.'ini nain outpur of Lhi< sv,rem :ncludes lhe lo'adon lime cau'es and consequences of process
Proceedings of the 18th Symposium ofMataysiu Chemical EneineeB
I
I
l+
A
CodDuc conbl Inns urnc notua1
Deverop infercd@ eneine fordviso,r sl.Em ssirs Bortand c# Buildtr 6 0
FIGLRE 2. Prccut fractionarion column with srudv nodes
The diagnostic algoritlm is develop€d by using Bodand C-i+ Builder (BCB) 6.0 progranraing language. Real planx dara, represenred by simulated dara ftom ptanr model developed by using HYSYS.Plant simularor is used ro compute control limirs. Monirorins varidbles of rhe conrrolers fto,n rhe ptdnt rnodet such as Lemper,rrure. and no" raLe ari cho,en a. base case ro esrima!e rle dccephble range ofope.an; r paramerer, connot trm r (X-bar char1, 3-sigma). Analys€s such as Aurocorrelation. Sk€wness. Kurtosis. and B o { p r o , h e r e p e r f o r n e d . o . h o q r h a r d a l a s e r w a " randon u i r h nomrldirribunon Tesr I was choseD to interpret conriol charts in this case study. In cases where one poini goes beyond the 3-sigma limits, fault is consid€red. Test I gives a signal when a signat shifts in the posiiion of mean or an increase i'l lhe slandard deviation ofthe process (Nelson, 1985).
FICURT L Faulr Didgnostic Sy$em developmenr'c floschan
TABLE 1. Shrdy nodes
Study Nodes
Node I Botrom ofprecut colm Nodc 2
-Srem where IndLcator FI 100 is tocared Node 3
Prcceedings ofthe 18th Svmposim ofMalaysid Chenical E€heef
Two it?es of optimization study are carried out 10 design rhe faulx diagnosis algonthm' Th;e i*ll"d" the examination oi process variables and the sensitivilv analysis The ooii-lzutioo sn aies aI"
"sed to aletemlite the exact causes and consequences
of the fault that miehr occu ,n lhe p'anr prcces' Sensr iD aoal)< s ' carried out by usilg rhe range L h a , o o i a i n e o l r o m , h e a n a l ; . i s . o r e " c f c o n n - o l r e r L r \ a s L s e o i n | I A Z O P s - u d y L o s p e c i f y the possible causes and consequences of a deYiating process ILAZOP "q9y f9:-qt: ."r"urch
"o"ompurres fo* lines of slream - study nodes as stated in Table I The I:LAZOP studv is also carried out based on ihe result ftom sensitivb snalysrs
fh. co.,orted .oottol llrnil" ard re'Llr of ILA/OP srudy i" uted in developing Fvo s o e o l r u l e : i t r l e l a n d R u l e l l T h e r e l a r ' o n < h p ol Rule I i s ' l / \ a d a b r e a n d / / l ; m r r s i 1 , " , - P r o c e s s d e ' a r i o n o f m o n i l o r i n g \ a r i a o r e M e a o $ h i l e . R u l e L I is u s e d r o r e r c h - h e end result offault diagrostic task
Rule I :
Rule i
I|TIC 100 and if<2361523, Then'Low Tenaer^ f,e' irefl 'Node 1 is Low T€mpeiature & High Flow'. 1t'].{ode I is Low Temperatue & High Fiow',
foen Nodel Low Temperatwe & HighFlow's Causes, and
4 RESULTS AND DISCUSSION
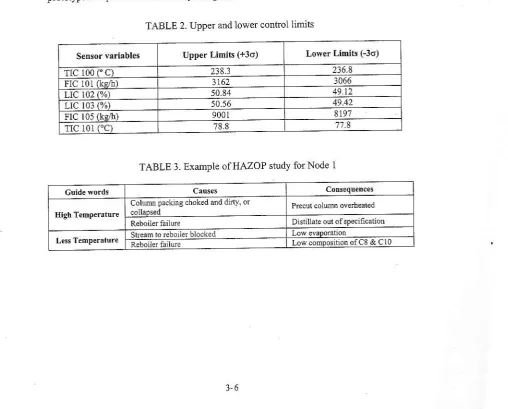
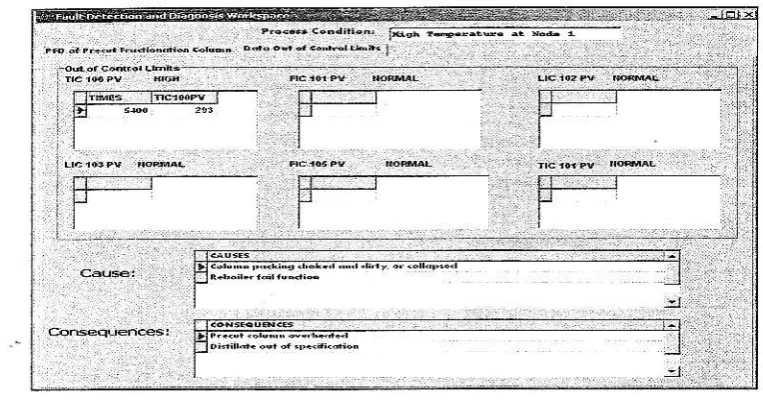
Resuhs for contl'ol limits and a sample of HAZOP study are shown in Table 2 and 3 respectively. These knowLedge bases are used to develop fault diaglostic algorithm as shown in Fieure a. This system consists of user intedace, knowledge bas€ and inference erg re. Foward cha ning sEaregl is u.e ro search fie krotrledge bdse s e\amjning eristins facrs and ru'es and comparing rnese laclc Lo he Informar'on hmished &om rhe orocesid,La. For exanp e, d fauh i' deLec'ed based on intonra ion bv comparing fte data irocess variables with ihe control limits data Then, th€ cause and location ofthe faull and 'a
*rjtable counterrneasure afe then extiacted from ihe knowledge bas€ Figure 5 shows the prototype that presented the deveioped algorithm
TABLE 2. Upper and lower controL iimits
Upper Limits (+3o) Lower Limits (-36i
Tic 100 ec) 2 1 8 l 2 3 6 . 8
FIC 1 0 1 f k e t ) 3r62 i066
Lrc 102 (%) 50.8,1 49 t2
L l c 1 0 3 ( % ) 49.42
fic 105 (kq,4') 9 0 0 t 8 i9 7
TIC 1 0 1fc) 7 8 . 8 71.'l
I A B L E L L ' a m p l e o l H A / O P . ' u d ) f o r N o d e I
ColLm plcking choked dd din-w, or
P@ur colufrn ovdneated
Distillare out of specification Skeaf, r" reboner bioc[ed
Low conposition of C8 &Cl0
Eneineero rnd opersror! i
'- -[---
+---":-:.-:-:-,
-,
:---:-:-:-:--r + :
I h.fence , , .-- --l_
i Eneine- I i t
I losa.d I I
I cnaining i ro Ld{,LrJr rl,: i i i ' f c . r : t . . d r r n { . r ' I
n
I '"''1.:::ll:'" ,...,----'
ExternalDrubls. . lvlea d data, rext file
Knorledgebase
. Empincal dala (Crr.s andconsequences fault)
Checi prcess condnron ol
\ n i . ?r LL l1\ !or d , on oler.h nronitor r-r fr rmeLe.
Proceedings ofthe l Sth Symloslnm olMalaysian Chenlc.l Englneers
l - l u L R L a A r c r i e c n . e . n d I r r o ' d e \ . o p . l g o r i . l m
FIGURE 5a. End results of fault diacnostic alsorithm
Proceediqs ofthe 18th Symposiun of Malaysian Chemical Engjneers
FIGURE 5b. Time, causes and consequences results
5 CONCLUSIONS AND RECOMMENDATION
ln general, the purpose of this rcsearch is to develop a fault and diagnosis algorithm which is able to detemin€ the exacl location, time and rhe causes and consequences ofa proc€ss deviation. X-bar chart, 3 - signa statisticai tools are used to analyze the condiiion of process- the main causes and consequences of the study node are specified based on the IaAZOP study. The proposed algori$m which combines th€ SPC and HAZOP study was helptul in diagnosing a process deviation detected by s€nsors in th€
controll€rs-Fulher work can be carried out to eniance ihe pefomance ofboth tools in delecting fault. Fuzzy logic approaches can be used instead ol using crisp - inte al tlresholds. Application of th€ iatest SPC methods besides X-bar chart, such as Mullivariate SPC or Principle Components Analysis methods may enhance the quantitative aspect of detecting and diagnosing th€ faults.
ACKNOWLEDGEMENTS
The authors would like to thank th€ Midstry of Science, Technoiogy and Innovation (MOSTI), and also the Universiti Teknologi Malaysia (Ltfough the IRPA &ant Vot 74015) for sponsoring this research.
REFERENCES
Himmelblau, D. M- (1978)- "Fault Detection and Diagnosis in Chemical and Petrochemical Processes". Anslerdam: Elsevie! Scieniific Publisher.
Isermann, R- (1989). "Process Fault Diagnosis Based on D].namic Models and Panmet€r Estimation Methods". In Patton,R. Frank, P. and Clark, R. "Iault Diagnosis ln Dlnamic Systems. Theory and Applications." 253 - 291. New York: Prentice-Ha[
Lees. I. P. (1996). "Loss Prevention in ihe Process Industries: Hazard Identification, Assessment and control." Oxford: Burbrworth Heinemann.
\ e l s o n . L. S. \l085J. tnrerpretiog S h e w h a n , t r C o n l r o l C h d r c s . l e c h n i c a l A i d s . Joumal of QualityTeclnology. 17(2): 11,1:116.
Venkatasubmmanian, V., Rengasv,,amy, R., Yin, K. and Kaluri, S.N., (2003). "A revi€w Of pfocess fault d€tection and diagnosis Part III: Process history based merhods." Computer & Chemical Engjx,eei,trq,2'1. 327-34tr.