EFFECT OF SEPARATION DISTANCE AND SOIL PARAMETERS ON
THE STRUCTURE-SOIL-STRUCTURE INTERACTION RESPONSE OF
ADJACENT DEEPLY EMBEDDED STRUCTURES
Lisa M Anderson1, Shawn Carey, PhD2, Jayprakash Amin2, Farhang Ostadan, PhD3
1
Senior Engineer, Bechtel Power Corporation, Frederick, MD
2
Principal Engineer, Savannah River Nuclear Solutions, LLC, Aiken, SC
3
Chief Engineer, Bechtel National, Inc., San Francisco, CA
ABSTRACT
Structure-Soil-Structure Interaction (SSSI) is the effect of a neighboring structure on the dynamic response of a given structure on a common soil site. For structures that have large footprints and deep embedment, it is anticipated that SSSI effects may be significant. The focus of this paper is to quantify this effect for such a case where identical structures of large footprints and deep embedments are placed in near proximity of each other.
A simplified 2-D planar model is created, representative of a deeply embedded structure with a large footprint. The effect of SSSI is considered using a line of symmetry at a finite distance in the free-field equal to half of the separation distance being analyzed. The analysis is completed for three realistic soil profiles (soft, medium, and hard) and two input response spectra, representative of typical motions in the Central Eastern United States and the Western United States. For each permutation of soil and motion, the separation distance is varied and compared against an analysis using the individual model.
The effect of the separation distance between the neighboring structures and the impact on structural seismic demands and equipment qualification demands are assessed and discussed in this paper.
DEVELOPMENT OF 2-D MODEL
A 2-D planar SASSI2000 (Lysmer et al. 1972, and Lysmer et al. 1999) model is developed based on the geometry of the structure considered, the Reactor Service Building (RSB). The RSB is a nuclear safety-related structure that is deeply embedded (approximately 140’ embedded) with a footprint of approximately 300’ by 200’. The 2-D section is taken in the direction where in-plane effects are of most interest due to the surrounding structures and the footprint shape.
Frame members are considered to represent the mass/stiffness of structural elements that are perpendicular to the section cut. A unit width is assumed parallel with each section, as if the members perpendicular to the section were continuous infinitely.
The material properties for 5,000 psi concrete are considered for the frame elements (E = 580464 ksf, ν = 0.17, γ = 0.150 kcf, ζ = 0.04). The isotropic properties are determined using the following expressions:
• Axial Area = Member Thickness
• Shear Area Axes 2 = Member Thickness
• Shear Area Axes 3 = N/A
• Torsional Inertia = N/A
• Flexural Inertia Axes 2 = N/A
• Flexural Inertia Axes 3 = 1 Member_Thickness
3 ⋅
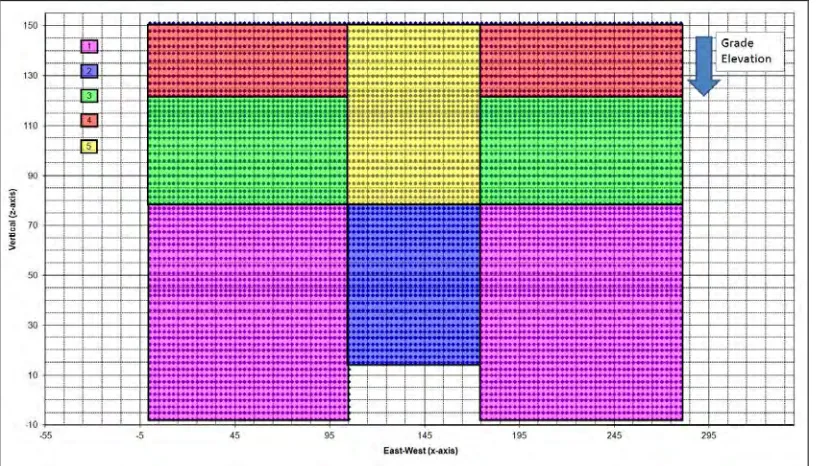
The frame members and thicknesses for the section cut are shown in Figure 1. Note that for the 2-D model, the x-direction corresponds to the East-West (EW) direction which is parallel to the section cut. The z-direction corresponds to the Vertical direction. Grade corresponds to Elevation (EL) 122’.
Figure 1. Frame Members.
To account for parallel shear walls, that provide in-plane stiffness, 2-D planar elements are modeled. The modulus of elasticity of concrete is considered factored by the ratio of the sum of the wall thicknesses to the distance between the furthest walls of the structure. Figure 2 shows the different zones of stiffness on the section.
The calculations for the elastic modulus used for each zone labeled in Figure 2 are shown below:
The same proportioned calculations are completed with the material density of concrete (0.150 kcf). The resulting zone values are: Zone 1 – 0.016 kcf, Zone 2 – 0.008 kcf, Zone 3 – 0.013 kcf, Zone 4 – 0.011 kcf, and Zone 5 – 0.006 kcf.
An independent check is performed against a 3-D GTSTRUDL (GTSTRUDL, 1999) model, representing the structure with only the foundation level fixed. This check is to verify that the global response of the structural is represented by the 2-D approximations. The EW and Vertical modes, of the GTSTRUDL model, occur at approximately 6 Hz and 11 Hz, respectively.
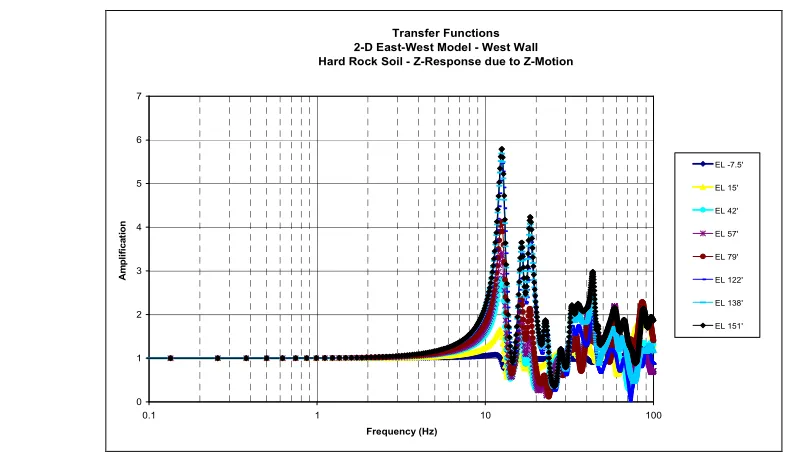
The modal results are compared with a SASSI2000 Hard Rock (HR) run where the structure is not considered embedded. The HR soil properties represent very stiff soil properties, to emulate a fixed-base condition. The HR results are represented by transfer functions. Transfer functions are the frequency dependent amplitude function in response to a unit load. HR transfer functions represent the modal results of the structure. The EW and Vertical HR transfer functions, at various elevations, are shown in Figures 3 and 4, respectively.
Transfer Functions 2-D East-West Model - West Wall Hard Rock Soil - X-Response due to X-Motion
0 2 4 6 8 10 12 14 16 18
0.1 1 10 100
Frequency (Hz) A m p li fi c a ti o n EL -7.5' EL 15' EL 42' EL 57' EL 79' EL 99' EL 122' EL 138' EL 151'
Figure 3. East-West (X-Direction) HR Transfer Functions. Zone 1 (4 ft⋅ + 4ft+ 6ft+ 3ft+ 6ft)
221ft −6ft
( ) ⋅580464ksf =62096ksf
Zone 2 (6 ft⋅ +6ft)
221ft −6ft
( )⋅580464ksf =32398ksf
Zone 3 (4 ft⋅ + 4ft+ 4ft+ 4ft+ 3ft)
221ft −6ft
( ) ⋅580464ksf =51297ksf
Zone 4 (4 ft⋅ + 4ft+ 4ft+ 4ft)
221ft −6ft
( ) ⋅580464ksf =43197ksf
Zone 5 (4 ft⋅ +4ft)
221ft −6ft
Transfer Functions 2-D East-West Model - West Wall Hard Rock Soil - Z-Response due to Z-Motion
0 1 2 3 4 5 6 7
0.1 1 10 100
Frequency (Hz) A m p li fi c a ti o n EL -7.5' EL 15' EL 42' EL 57' EL 79' EL 122' EL 138' EL 151'
Figure 4. Vertical (Z-Direction) HR Transfer Functions.
The dominant modes of the 3-D GTSTRUDL model match well with the results of the 2-D SASSI model. This indicates that the global aspects of the 3-D model are captured in the 2-D model.
STUDY OF BUILDING SEPARATION
Description of Analysis Cases
Three separation distances are arbitrarily selected: 380’, 600’, and 1000’. The multiple structures may be considered using a line of symmetry in the free-field. The line of symmetry is place at a distance of half the separation distance considered from the edge of the structure. The horizontal solution assumes an asymmetric condition and the vertical solution assumes a symmetric condition. The analysis cases are considered for two sets of soil profiles and ground motion. The soft (C1) and stiff (CR) soil profiles are considered; refer to Figure 5 for shear wave velocity profiles.
A motion typical of the Western United States (WUS) is used in conjunction with the C1 soil profile. A motion typical of the Central Eastern United States (CEUS) is used in conjunction with the CR soil profile. For all analyses within this paper, the traditional time history method of analysis is used, as opposed to the Random Vibration Theory method of analysis.
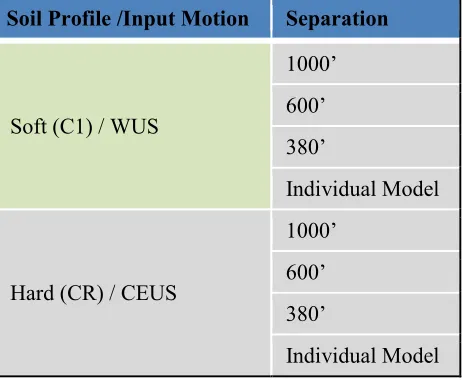
Analysis Case 1 considers the Soft (C1) soil profile with the WUS ground motion. This is the base case which includes only one unit. Analysis Case 2 considers the Soft (C1) soil profile with the WUS ground motion. A separation distance of 380’ is considered in this case. Analysis Case 3 considers the Soft (C1) soil profile with the WUS ground motion. A separation distance of 600’ is considered in this case. Analysis Case 4 considers the Soft (C1) soil profile with the WUS ground motion. A separation distance of 1000’ is considered in this case. Analysis Case 5 considers the Hard (CR) soil profile with the CEUS ground motion. This is the base case which includes only one unit. Analysis Case 6 considers the Hard (CR) soil profile with the CEUS ground motion. A separation distance of 380’ is considered in this case. Analysis Case 7 considers the Hard (CR) soil profile with the CEUS ground motion. A separation distance of 600’ is considered in this case. Analysis Case 8 considers the Hard (CR) soil profile with the CEUS ground motion. A separation distance of 1000’ is considered in this case. A summary of the analysis cases is given in Table 1.
Table 1. Summary of Analysis Cases.
Soil Profile /Input Motion Separation
Soft (C1) / WUS
1000’
600’
380’
Individual Model
Hard (CR) / CEUS
1000’
600’
380’
Comparison of Results
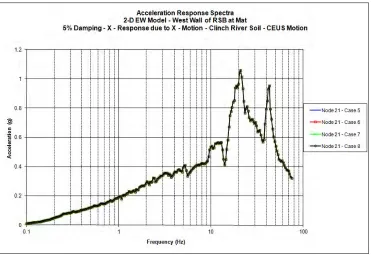
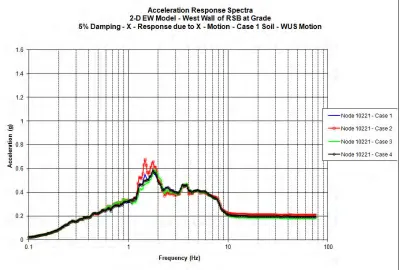
Acceleration Response Spectra (ARS) are compared for a node at the mat elevation (Node 21) in line with the West exterior wall. The horizontal or X-Direction responses for the C1/WUS and CR/CEUS soil profiles/input motions are shown in Figures 6 and 7, respectively.
Figure 6. EW ARS at Mat Elevation – C1 Soil WUS Motion.
ARS are compared for a node at the grade elevation of the West exterior wall (Node 10221). The horizontal or X-Direction responses for the C1/WUS and CR/CEUS soil profiles/input motions are shown in Figures 8 and 9, respectively.
Figure 8. EW ARS at Grade Elevation – C1 Soil WUS Motion.
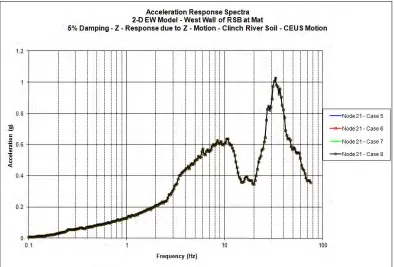
The Vertical responses for Node 21 at the mat elevation, for C1/WUS and CR/CEUS soil profiles/input motions are shown in Figures 10 and 11, respectively.
Figure 10. Vertical ARS at Mat Elevation – C1 Soil WUS Motion.
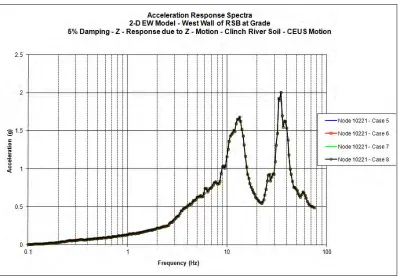
The Vertical responses for Node 10221, at grade, for C1/WUS and CR/CEUS soil profiles/input motions are shown in Figures 12 and 13, respectively.
Figure 12. Vertical ARS at Grade Elevation – C1 Soil WUS Motion.
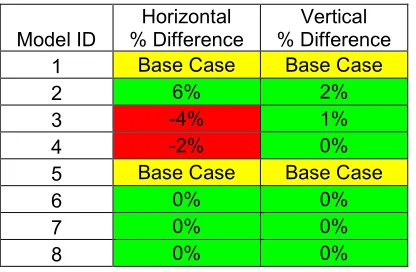
The maximum accelerations are computed for each structural node in the model and the co-direction responses are combined using the 100-40-40 rule; the results are accelerations corresponding to each node in for each analysis case and each direction of response. The combined accelerations are then averaged for each analysis case. The percent difference is taken with respect to the Case 1 or 5. These models are considered to be the base case, as there is only one structure considered in the model. These percent differences are presented in Table 2. A positive percent difference indicates that the analysis case produces higher results compared with the individual model.
Table 2: Comparison of Average Accelerations.
Model ID
Horizontal % Difference
Vertical % Difference
1 Base Case Base Case
2 6% 2%
3 -4% 1%
4 -2% 0%
5 Base Case Base Case
6 0% 0%
7 0% 0%
8 0% 0%
CONCLUSIONS
It is apparent that there is no sensitivity of Acceleration Response Spectra and maximum
accelerations for each analysis case that considers the stiff soil profile. For the analysis cases considering soft soil, some amplification of the peak portion of the ARS is observed. The amplifications for the horizontal case are most apparent. There is a negligible effect on the stiff soil profile maximum accelerations for each analysis case.
For rock profiles, with properties similar to those studied herein, no modification is required for a separation distance greater than 380’. For soft soil profiles, with a separation distance less than 600’, final In-Structure Response Spectra should be increased by a factor of conservatism.
REFERENCES