direction of Dr. S. Bartholomew Craig).
Despite a lack of evidence for significant behavioral differences, prior research suggests that observers rate male leaders more positively than female leaders. This study examined the potential moderating effect of leader gender on the relationship between objective
performance and subjective evaluations. Three theories were tested to determine which one(s) best explained the disparities between male and female leader ratings. These theories were: tokenism theory (Kanter, 1977), status characteristics theory (Berger, Fisek, Norman, & Wagner, 1985), and leadership categorization theory (implicit leadership theories; Lord & Maher, 1993; Lord, Foti, & DeVader, 1984). Followers from 14 organizations were asked to evaluate their leaders’ behavior and to give their perceptions of leaders in general, as well as how much status males and females deserved in their organizations. Using a series of
multilevel models, this study found that, under certain conditions (e.g., when followers believed men deserved more statusthan women or followers associated “male” with “leader”), the leaders’ gender moderated the relation between objective workgroup
by
Alexandra K. Mullins
A thesis submitted to the Graduate Faculty of North Carolina State University
in partial fulfillment of the requirements for the degree of
Master of Science
Psychology
Raleigh, North Carolina 2013
APPROVED BY:
_______________________________ ______________________________
Dr. S. Bartholomew Craig Dr. Lori Foster Thompson
Chair of Advisory Committee
DEDICATION
BIOGRAPHY
Alexandra Kari Mullins was born May 24, 1987, in Napa, California. She earned a high school degree from Green Hope High School in Morrisville, North Carolina. Next, she completed her undergraduate education at North Carolina State University in 2009, earning a Bachelor of Arts degree in Psychology. In the fall of 2009, Alexandra continued her
TABLE OF CONTENTS
LIST OF TABLES ... v
LIST OF FIGURES ... vi
Disparities Between Male and Female Leaders... 2
Subjective Evaluation in Organizations... 4
Theoretical Explanations for Disparities ... 7
The Current Study... 13
Participants... 16
Procedure ... 17
Measures ... 18
Analyses and Results ... 21
Practical Implications... 28
Limitations and Future Research ... 29
LIST OF TABLES
Table 1. Means, Standard Deviations, Reliabilities and Intercorrelations among Study Variables………...35 Table 2. Within-Leader and Between-Leader Variance Accounted for by each
LIST OF FIGURES
Figure 1. Interaction between leader gender and objective performance on the growth sub-dimension of strategic leadership...40 Figure 2. Interaction between leader gender and objective performance on the
The Effect of Leader Gender on the Relation Between Workgroup Performance and Subordinate Perceptions on Leader Effectiveness
Leadership plays a critical role in organizations. Leadership has been defined as the capability to successfully guide a group of individuals toward a common goal or purpose (Riggio, 2000). Leadership typically consists of behaviors that influence, motivate, organize, and coordinate employees’ work (Eagly & Carli, 2007). Not all leaders are equally effective at providing such guidance, so organizations spend billions of dollars annually on leadership development in an attempt to help people become better leaders (Riggio, 2008).
In addition to their obvious role in directing work activities, leaders have the ability to influence outcomes for employees (e.g., attitudes and mental health) and the organization itself (e.g., climate and culture). Leaders can help increase employees’sense of
empowerment by giving them autonomy and support in their work (Riggio, 2000). They reduce employee stress by acting as “shock absorbers” during organizational change as well as acting to maintain employee trust (Skagert, Dellve, Eklof, Poussette, & Ahlborg, 2008). Increasing employee confidence and decreasing employee stress can aid in creating an industrious work environment (Riggio, 2000). Leaders often have the authority to make decisions affecting various dimensions of organizational climate and culture, such as organizational change, policy, and employee structure. Leaders are usually those who make important decisions regarding policy additions or changes, organizational restructure, hiring, laying off employees, etc. (Westaby, Probst, & Lee, 2010). Ultimately, much of an
Disparities Between Male and Female Leaders
For years, statistics have shown that men make more money than women, even when holding the same job position (Eagly & Carli, 2007). Stroh, Brett, and Reilly (1992) suggest that female managers’ salaries and career advancement rates are behind those of male
managers. Women are less likely to hold high ranking positions in organizations and also less likely to be offered promotions (Eagly & Carli, 2007). In 2009, a survey reported that women accounted for only 13.5% of the executive officer positions in the United States (Catalyst, 2010). In fact, almost 30% of corporations have no women in such positions. Even though women’s representation is low in absolute terms, the number of women in executive officer positions has increased within the past 15 years. Chief executive officer (CEO) positions held by women have increased from 0% to a mere 3% (Catalyst, 2010). Although one might suspect that differential representation of genders by organization type contributes to these numbers, research shows no advantage toward advancement for women in female, relative to male, dominated fields (Eagly & Carli, 2007). Though women are underrepresented in executive positions, the current study did not directly address the underrepresentation of females at executive levels. Rather, the current study examined issues related to the evaluation of female leaders’ performance that may be relevant to why this phenomenon occurs at higher-ranking positions.
behave in a communal manner (e.g., concerned with the care of others), while men are often associated with assertive and controlling behaviors, known as agenticism (Eagly & Sczesney, 2009). These stereotypes carry over into work roles and affect which job positions are
perceived to be more suitable for females and which positions are perceived to be more suitable for males. Since people believe that women behave differently than men, they likewise may expect that women should hold different jobs than men in the workplace (Ridgeway, 1992).
When men and women are in leadership positions, are their leadership behaviors really different? Helfat, Harris, and Wolfson (2006) contend that relatively little is known about comparisons between women and men in upper management. However, researchers have posited that male and female leaders display few behavioral differences, for the most part (Morrison, White, & Van Velsor, 1987). Despite a lack of evidence for significant behavioral differences, prior research suggests that observers rate male leaders slightly more positively than female leaders (Eagly & Carli, 2007; Eagly, Makhijani, & Klonsky, 1992).
subordinates (Eagly et al., 1992). Gender bias was found to have a profound negative effect on performance evaluations and professional advancement of women in organizations. Overall, female leaders tend to encounter greater obstacles to advancement and performance than males in the same position (Lyness & Heilman, 2006).
Positive evaluations of female leaders. Although the current discussion focuses on negative evaluations of female leaders, relative to males, it should be noted that female leaders may be evaluated positively dependent upon leadership style and organizational performance. These positive evaluations are less frequent than negative ones, but they do occur in certain contexts. Research suggests that women are likely to be evaluated positively when they adopt a feminine style of leadership (e.g., democratic toward employees or
considerate of employee well-being; Eagly et al., 1992; Eagly & Carli, 2003). In fact, female leaders are rated as high as male leaders when both sexes adopt feminine leadership (Eagly et al., 1992). Moreover, depending on a company’s financial performance (e.g., either
prospering or declining), women are more often sought for leadership positions and evaluated positively in times of lower organizational performance, although this tendency also places them at greater risk for failure (Haslam & Ryan, 2008).
Subjective Evaluation in Organizations
subjectivity, subjective evaluations are common in the workplace (Moers, 2005). Ratings from subordinates have been argued to be the most reliable subjective indicators of leader performance because leaders interact more regularly with subordinates than superiors or peers (Hogan, Curphy, & Hogan, 1994; Mount, 1984); therefore, subordinates are likely to know more about leaders’performance-related behaviors. Further, leaders may not always have superiors or peers,depending on their location in the organization’s structure,but are guaranteed to always have subordinates (Hogan et al., 1994).
Gender has been found to affect performance evaluations. Moers (2005) claims that, in general, subjective ratings lead to gender bias in performance evaluations. Jonnergard, Stafsud, and Elg (2010) support this notion of bias by arguing that indicators of good
performance tend to be based on male norms. Gender also influences how these performance evaluations are perceived by the individual who is being evaluated. Men and women attach more importance to different parts of the evaluations. Women are more concerned with who is evaluating them (e.g., subordinates, peers, superiors), while men tend to focus on what is being evaluated (e.g., performance, leadership effectiveness; Jonnergard et al., 2010). In an effort to examinegender’s influence on subjective evaluationsin the current study, objective measures were also used to measure leader performance.
workgroup performance criteria (e.g., unit profit, revenue growth, percent of financial goals achieved) that exist independent of subjective perception. One might expect a positive relationship between objective measures and subjective measures, and past research has suggested that objective measures and subjective measures of company performance are correlated (Gonzalez-Benito & Gonzalez-Benito, 2005; Jaworski & Kohli, 1993); however, this issue has primarily been examined in the context of market orientation and company competitiveness and has not addressed the form of the relationship between objective and subjective evaluations of leaders (Lyness & Heilman, 2006).
In addition to allowing for examination of their relation, having more than one mode of measurement (e.g., objective performance and subjective evaluations) of leader
Theoretical Explanations for Disparities
Interestingly, research on gender differences and leadership style has not typically been driven by theories about gender’s impact on leadership. In fact, of the studies not explicitly based on a specific theory, gender theories are often not even mentioned until results or discussion sections of journal articles (Ayman, Korabik, & Morris, 2009). In essence, existing theories have not truly been tested as explanations for existing disparities. There are a number of theories that, when tested, could provide explanations for disparities likely to be seen in male and female leader evaluations. Among these theories are: tokenism theory (Kanter, 1977), status characteristics theory (Berger, Fisek, Norman & Wagner, 1985), stereotype-related theories [including leadership categorization theory (Lord, Foti, & DeVader, 1984; Lord & Maher, 1993), behavioral stereotypes (Eagly & Johnson, 1990), social role theory (Eagly, 1987), role congruence theory (Eagly & Karau, 2002)], and transformational leadership theory (Bass & Avolio, 1993).
Status characteristics theory.Status characteristics theory suggests that a person’s sex is a status characteristic (i.e., high or low status; Berger et al., 1985). In this view, the male status is more respected than the female status (Berger et al., 1985; Ridgeway, 1992). Status may,in turn, affect leaders’ self-esteem and even how they interact with subordinates. Leaders may interact differently with subordinates in a female-dominated organization compared to a male-dominated organization because the female leader may feel less anxiety leading a group of women. According to this view, the female leader does not feel inferior to her female subordinates, therefore also feeling more positive about the interaction. Research suggests that a primary component affecting the nature of the leader-subordinate interaction is the gender of the leader (Johnson, 1992).
In situations where both men and women are present (e.g., a business meeting), this theory suggests that men will be awarded more power, allowed more time to talk, and also have their ideas taken more seriously (Ridgeway, 2001; Watson & Hoffman, 2004). In similar situations, women’s expectations for themselves are likely to be affected solely because of their gender’s status. Others who view the status of gender as relevant are also likely to form their own expectations. Research has shown that women whose roles are not congruent with their status (i.e., being a female leader) will be given lower evaluations as well as lower attributions of ability and influence; further, they will have a lower likelihood of even being placed into leadership roles (Watson & Hoffman, 2004).
leaders and even what a leader should look like. These ideas are known as implicit leadership theories (ILTs). If a leader possesses traits that are not part of an observer’s leader prototype, or that leader fails to exhibit those traits that are a part of the prototype, that leader may be evaluated negatively by the observer. An individual’s leader prototype often includes (but is not limited to) expectations about race, gender, and ethnicity (Lord & Emrich, 2001). Leader expectations also range from external to internal attributes; leader prototypes have been suggested to vary across eight dimensions: sensitivity, dedication, tyranny, charisma, attractiveness, masculinity, intelligence, and strength (Epitropaki & Martin, 2004;
Offermann, Kennedy, & Wirtz, 1994). Perceivers are likely to categorize target individuals as leaders or non-leaders based on whether the individuals possess prototypical traits (Lord & Emrich, 2001). Research shows that organization members hold the view that managerial jobs are more male typed, and that the concepts of “men” and “managers” are more
consistently linked than the concepts of “women” and “managers.” This view has persisted for the past 30 years (Schein, 1973; 2007).
constitutes appropriate leader behavior (role congruence theory; Eagly & Karau, 2002). These theories will now be discussed in more depth.
Behavioral stereotypes. Eagly and Johnson’s meta-analysis (1990) suggested that male and female leaders were likely to perform gender-stereotypical behaviors. The meta-analysis found that women in leadership roles tended to have a person-oriented (i.e., focused on interpersonal relationships with employees) style of leadership, while men tended to have a task-orientation (i.e., focused on the work task; Eagly & Johnson, 1990; Riggio, 2000). Although these differences between male and female leaders have been documented, they are not large in magnitude.
As female leaders act and appear to be concerned with the well-being of their employees, these stereotypes and leadership styles create a “double bind” for these women (Eagly & Carli, 2007, p. 102). As previously mentioned, women are expected to be
communal, yet leaders are expected to be agentic. This “double bind” is hypothesized to create dissonance for subordinates who observe female leaders’ demonstration of agentic behaviors, making it more likely that they will resist the female leader in the organization or evaluate her performance more negatively (Eagly & Carli, 2007).
men and women seek to fulfill their designated roles (Cabrera, Sauer, & Thomas-Hunt, 2009; Watson & Hoffman, 2004). If leaders display behaviors contradictory to their social roles (e.g., an assertive female leader or a nurturing male leader), they are susceptible to negative evaluations by subordinates (Johnson et al., 2008).
Role congruence theory. According to Eagly and Karau (2002), role congruence theory states two forms of bias will emerge as a result of a perceived conflict between a woman’s gender and leadership roles. The first form of bias occurs because men are typically viewed as more “fit” to hold leadership positions than women, due to a lack of fit between the role of “leader” and the role of “woman,” resulting in a lower probability of selection into leadership roles for females (Eagly & Karau, 2002; Lyness & Heilman, 2006). The second form of bias results when a woman takes on a leadership role and implements a masculine leadership style. A conflict arises between her gender and leadership roles (Eagly & Karau, 2002; Johnson et al., 2008). Prior research has shown that when either form of bias is present, a female leader will be perceived as deviant and evaluated negatively because her roles are incongruent (Watson & Hoffman, 2004).
Transformational leadership theory. Apart from many of the theories evaluating women leaders negatively, the transformational leadership approach holds somewhat more positive implications for female leaders. Bass and Avolio (1993) suggest that
transformational leaders are able to motivate their followers by communicating an
development, and providing mentoring relationships for their employees (Ayman, Korabik, & Morris, 2009; Bass & Avolio, 1998). Past research has shown that when subordinates evaluated male and female leaders on the dimension of transformational leadership, female employees viewed female leaders as more transformational than male leaders. Male
employees did not significantly differ in their ratings given to male or female leaders and evaluated them similarly (Maher, 1997). This research is noted here as support for
differences in the perceptions of male and female leaders. However, because this explanation is primarily concerned with mean level of performance and not the relationship between objective and subjective indicators of performance, it will not be a focus of the current study.
Previous research finding differing evaluations of leaders by gender has tended to focus on subjective evaluations of performance. An important and unresearched question is whether male and female leaders perform at different levels in an objective sense, or whether it is only subjective evaluations that are influenced by leaders’ gender. Any of the rationales discussed above could explain differences in the way subordinates evaluate leaders of different genders, but no previous research has examined these explanations with regard to objective performance criteria. Nor has any previous study examined multiple competing explanations at once to determine which best explain observed effects.
The Current Study
discrepancy is occurring at the executive level. The proposed study sought to explore the relationship between objective workgroup performance and subjective evaluations of leaders by subordinates, with particular emphasis on the moderating effectof leaders’ gender. Based on previous findings of a correlation between objective performance and subjective
evaluations (Gonzalez-Benito & Gonzalez-Benito, 2005; Jaworski & Kohli, 1993) and that female leaders do not behave significantly differently from male leaders (Morrison et al., 1987; Eagly & Carly, 2007), but yet are evaluated more negatively (Eagly et al., 1992), gender is expected to interact with group performance in influencing followers’ perceptions. Thus, the current study addressed the following hypothesis:
Hypothesis 1: The relation between objective performance of the workgroup and subjective evaluations of leaders will be moderated by leader gender.
As discussed above, several theories predict that leaders’ gender will influence subjective evaluations by subordinates. Yet these theories present differing propositions as to the mechanisms underlying this effect. This study was designed to disentangle the competing explanations and test tokenism theory, status characteristics theory, and leadership
categorization theory further to see which are able to explain the existing disparities between evaluations of male and female leaders. No past research has directly compared these
theories as competing explanations. Therefore, the current investigation will consider multiple theories in an effort to test the following, mutually nonexclusive, hypotheses:
leader evaluations in settings where leaders of either gender occupy fewer than 15% of leadership positions.
Hypothesis 3: Consistent with status characteristics theory (Berger et al., 1985), leader gender will moderate the relationship between objective workgroup
performance and subjective leader evaluations when members of either gender are rated higher in status than the other.
Regarding hypothesis 4, because of the overlap among the explanations provided by ILTs, behavioral stereotypes, social role theory, and role congruence theory, the latter three explanations cannot logically operate if the ILT explanation is not also operating. That is, the ILT explanation implies an association between perceivers’ concepts of “male” and “leader,” and if that association is not present then none of the other explanations can be true.
Therefore, in this initial investigation only the ILT explanation will be directly tested. Hypothesis 4: Consistent with leadership categorization theory (Lord & Maher, 2003), leader gender will moderate the relationship between objective workgroup performance and subjective leader evaluations when leaders’ raters score high on the masculinity dimension of an implicit leadership theories scale.
Hypothesis 5: Male leaders will be rated higher than female leaders on task-oriented leadership.
Hypothesis 6: Female leaders will be rated higher than male leaders on relations-oriented leadership.
Method Participants
For this study, subjective evaluations of leader performance were collected from leaders (n =88) and their followers (n = 151), from 14 organizations. Of the total number of organizations and leaders who were invited to participate, the response rate from
organizations was 46%, 67% from leaders, and 48% from their followers. Each leader nominated subordinate raters; these raters were then invited to participate in the study by evaluating their leaders. About 44% of the raters were women and 56% were men. The mean number of raters per leader was 1.81 raters (SD = .78, range 1-5). Four subordinates were not included in the analyses because they indicated “hardly knowing” their supervisors.Leaders represented a wide range of organizational levels: the study sample consisted of 21
Procedure
Recruiting organizations. Participants were recruited from hierarchically structured organizations. Organizations were invited to participate based on two criteria: leaders within the organization must have worked in a workgroup where they had followers who reported directly to them, and must have had some objective measure of their workgroups’
performance. Any level of management that agreed to participate was included. Several strategies were used to identify target organizations for this study. One strategy was to contact North Carolina State University industrial-organizational psychology alumni currently working in organizations (e.g., Glaxosmith-Kline, IBM, and SAS) that might be willing to participate. Another strategy was to contact Research Triangle Park organizations to see if any would assist in the study. Further, American Society for Training and Development and Conference Board resources were used to identify organizations that have previously participated in research studies.
Once a list of potential organizations was compiled, meetings were scheduled with representatives of each organization to inform them of what specifically was needed from their organization and employees (e.g., access to archival records, ratings from employees). This meeting determined whether or not final approval was granted to use the organizations in the data collection process. Organizations were told that they would be offered a technical report summarizing the study’s results in exchange for their participation.
form acknowledging that archival records of their groups’ performance may need to be obtained. They were assured that ratings of their performance would remain confidential and their identities would only be used to link their ratings to the performance criteria for their group. Leader participants were asked to provide demographic information, including age, gender, ethnicity, job title, time in current position, and time in organization (if different from current position). Leader participants were asked to provide email addresses for their
followers, so that followers could be invited via email to participate.
In an effort to examine tokenism theory, leaders were also asked to provide data concerning the number of male and female managers in the organization. If leaders could not provide this information, the human resource department in each organization was contacted or online resources were used.
Followers. Follower participants received an email message containing a link to the online survey. Followers who chose to participate were required to read and confirm a separate informed consent provided at the start of the survey. Follower participants were assured that all ratings would be confidential and that responses could not be linked to raters’ identities by anyone in their organizations. After providing informed consent, follower participants completed the measures described below.
Measures
is a 360° survey which measures leader performance on four dimensions and twelve sub-dimensions: forceful (takes charge, declares, pushes), enabling (empowers, listens,
supports), strategic (direction, growth, innovation), and operational leadership (execution,
efficiency, order). Sample items include “[the leader] gives people room to show initiative” (enabling) and “[the leader] gives direction—tells people what to do” (forceful). The LVI is based on the idea that suboptimal performance can result either from leader behaviors being under-done or being over-done. Response options for each item ranged from -4 (much too
little) to +4 (much too much). Because developmental feedback was not a goal of the current
study, the sign of ratings was removed and scores reversed so that higher numbers indicated higher perceived performance (i.e., final scale of 0 to 4). Within each leader, rater scores were averaged in order to obtain a single score for each dimension and sub-dimension. The process was repeated for status conditions as well as ILT conditions.
Objective workgroup performance. Leaders were asked to report the percent of “plan” or “goal” achieved by their workgroup or team in their organizations’ most recent reporting period. This approach was used to provide a common metric (i.e., 0-100) across the diverse organization types in the current study. Measures of objective workgroup
performance included: percentage of forecasted sales goals achieved, percentage of forecasted revenue goals achieved, and percentage of forecasted goals for sales growth achieved. These measures varied by leader and organization.
status, power, and independence a potential job candidate deserved at his or her job and whether the participant would hire the job candidate (Brescoll & Uhlmann, 2010). The scale has been adapted for the current study to assess the status conferred upon organization members of different genders.A sample item is “Howmuch status do females [males] deserve in your organization?” Exploratory factor analysis (EFA) in the current study suggested a one-factor solution. According to Lozano, Garcia-Cueto, and Muniz (2008), if participants are presented with more options than necessary, they will have trouble
differentiating between options and measurement error is likely to increase. In keeping with Lozano et al.’s recommendations for number of response options, the number of options for this scale was reduced from 11 to 5 for this study. Possible responses ranged from 1 (none) to 5 (a great deal).
scale was changed to a 1 (not at all characteristic) to 7 (extremely characteristic) based on Lozano et al.’s (2008) recommendations.
Demographic variables. Demographic variables assessed were: tenure with current supervisor (measured in months), age, and participant gender.
Analyses and Results
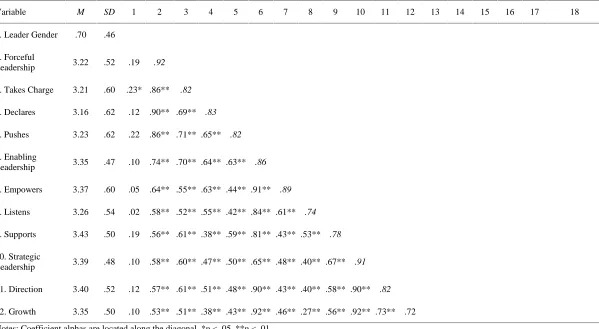
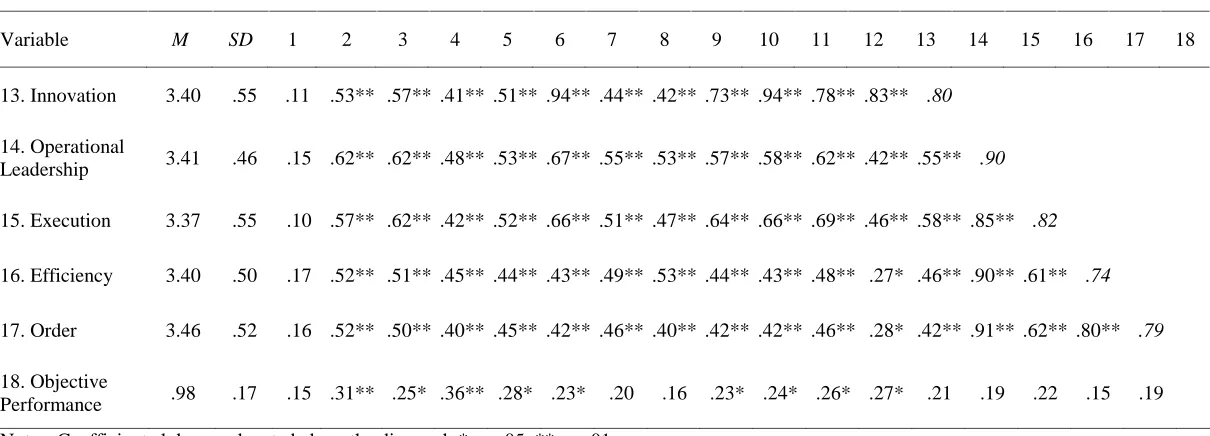
The means, standard deviations, reliabilities, and intercorrelations of the variables included in this study are presented in Table 1. A set of multilevel models (MLM) was used to analyze how subjective evaluations by raters were affected by the leader’s gender and their objective performance. MLM is typically used when there are observations nested within larger groupings (Raudenbush & Bryk, 2002). Although there has been debate about
acceptable sample sizes in MLM, Maas and Hox (2005) recommend level 2 sample sizes of 50 or more. For this study, raters (Level 1) within leaders (Level 2) were examined; MLM also allows for investigating cross level interactions. At the rater-level, the outcome variables consisted of subjective evaluations by leaders’followers. At the leader-level, leader gender and leaders’ objective performance were the main predictors. Raters’ gender was used as a control variable. The general equation (Equation 1) is shown below.
Level 1: Subjective Ratingij= B0ij+ B1ij(Rater Gender) + rij
Level 2: B0i= γ00+ γ01(LeaderGender) + γ02(ObjectiveP) + γ03(LGXOP) + u0i
Level 2: B1i= γ10+ γ11(LeaderGender) + γ12(ObjectiveP) + γ13(LGXOP)
preliminary analysis is called the fully unconditional model, where no other term other than the intercept is included at any level (Nezlek, 2001). All 16 dependent variables yielded level 1 and level 2 variance. Any nonzero amount of variance in level 1 and level 2 is an
acceptable amount of variance to warrant further analyses. Therefore, the fully unconditional models indicated that there was sufficient variability. Although there was not significant variance at level 1 in all fully unconditional models, MLM was still appropriate because of the nature of the data (e.g., nested data) and to maintain consistency throughout the analyses.
Hypothesis 1 predicted that the relation between objective performance of the organization and subjective evaluations wouldbe moderated by leaders’ gender. Results indicated that, in the full sample, after controlling for rater gender, there was a main effect of objective performance on forceful leadership (γ02= .17, t = 2.11, p < .05), as well as two
sub-dimensions of forceful leadership, declares (γ02= .25, t = 2.69, p < .01), and pushes (γ02=
.11, t = 2.03, p < .05), such that when objective performance was high, subjective ratings
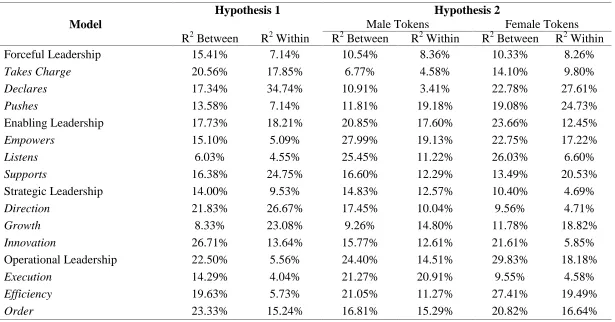
were high. Leader gender, however, did not moderate the relationship between objective performance and subjective performance on any subjective dimension or sub-dimension. The amount of variance accounted for by each of these models, as well as the proceeding models, is presented in Table 2. Hypothesis 1 was not supported. Although the other dimensions and sub-dimensions did not yield significant results, further hypotheses were tested to see if the relationships varied according to the conditions specified by theory.
of either gender occupy fewer than 15% of leadership positions. Examining only
organizations where women were of token status (n = 3), results indicated a main effect of objective performance on the pushes sub-dimension of forceful leadership (γ02= .19, t =
2.12, p < .05). In organizations where men were of token status (n = 1), results did not
indicate any significant main effects or interactions. Since leader gender did not moderate the relationship between objective performance and subjective ratings, hypothesis 2 was not supported.
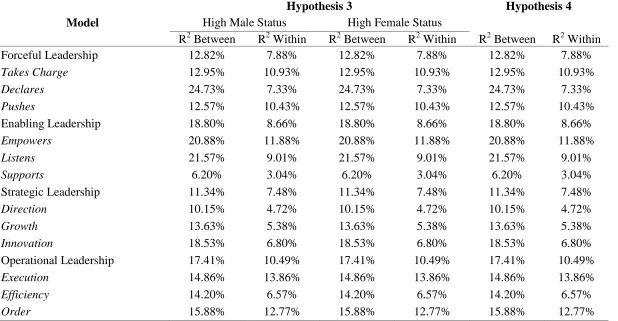
Hypothesis 3 predicted leader gender would moderate the relationship between objective workgroup performance and subjective leader evaluations in settings where members of either gender are rated higher in status than the other. For followers who rated females as more deserving of status (n = 64), the leader gender X objective performance interaction was not significant for any dimension or sub-dimension. For followers who rated males as more deserving of status (n = 48), there was a main effect of objective performance on the growth sub-dimension of strategic leadership (γ02= .09, t = 1.89, p < .05), such that
leaders were evaluated more favorably when objective performance was high. There was a significant interaction between objective performance and leader gender on growth ratings (γ03= .23, t = 2.59, p < .05; see Figure 1), such that female leaders’ behaviors were evaluated
graphing the interaction, objective performance was dichotomized (i.e., one standard deviation above and below the mean; see Figure 1). Hypothesis 3 was partially supported.
Hypothesis 4 stated that leader gender would moderate the relationship between objective workgroup performance and subjective leader evaluations where raters’ implicit leadership theories included “male” as a characteristic of leaders, operationalized here as a high score (i.e., above 4.5). A masculinity score was considered high if it was greater than or equal to one standard deviation above the mean masculinity score on the masculinity
dimension. Results indicated that when raters scored high on the masculinity dimension (n = 23), there was a significant interaction between leader gender and objective performance for the direction sub-dimension of strategic leadership (γ03= .18, t = 2.12, p < .05; see Figure 2),
such that female leaders’ behaviors were rated more negatively than males when objective performance was low. A test of contrasts analysis revealed that males and females were not rated significantly different from each other when objective performance was low or high (defined as described above). Hypothesis 4 was partially supported.
For hypotheses 5 and 6, a MANOVA was used to assess whether either male or female leaders received higher ratings on the dimensions of forceful, enabling, and operational leadership, as well as their corresponding sub-dimensions. Hypothesis 5
sub-dimensions of forceful leadership, Wilks’ λ = 8.54,F (15, 62) = 4.25, p < .05, and partial eta
squared = .053. Power to detect this effect was .63. Results of the one-way MANOVA revealed non-significant findings for enabling leadership, operational leadership, and their corresponding sub-dimensions. Hypothesis 5 is partially supported and hypothesis 6 is not supported.
Discussion
As described earlier, women are underrepresented in executive levels of leadership relative to men. This study’s main goal was to examine possible mechanisms that could contribute to this phenomenon and I attempted to do so by examining perceptions of male and female leaders at lower levels.
Results suggested that, in the full sample, leader gender did not affect the relationship between objective performance and subjective performance. However, among raters who assigned higher status to men, the interaction was significant for the growth sub-dimension of strategic leadership. Specifically, female leaders’ behaviors were evaluated more negatively than male leaders when objective performance was low. On the other hand, when objective performance was high, both male and female leaders were rated similarly on growth ratings.
This discrepancy also held true for raters who associated “leader” with “male.” When individuals scored high on the masculinity dimension of the ILTs scale, leader gender
moderated the relationship between objective performance and subjective evaluations for the
female leaders’ behaviors were rated more negatively than male leaders. When objective performance was high, male leaders were again rated more positively than female leaders.
One reason as to why leader gender did not moderate this relationship may be because, contrary to what was expected, this study did not find a widespread relationship between objective workgroup performance and subjective ratings. This was the first study to look at the relationship between objective performance and subjective evaluations of leaders. Perhaps there would have been a stronger objective-subjective relation if these data were collected from a single organization. Collecting from a single organization may provide a more consistent measure of performance in future research.
The second goal of this study was to pit tokenism theory, implicit leadership theories, and status characteristics theory against each other by testing them directly. Based on this study’s findings, status characteristics theoryand implicit leadership theories were only somewhat supported as explanations for the moderation of the objective-subjective performance relation by leader gender. Significant findings associated with status characteristics theory are consistent with previous literature (e.g., Berger et al., 1995; Ridgeway 2001), but only when employees viewed males higher in status. Significant findings associated with implicit leadership theories, specifically those raters who expected leaders to be masculine or male, are also consistent with past research (e.g., Lord & Emrich, 2001; Schein, 2007).By extension, because “thinkleader-think male” ILTs were operating for a number of individuals, these findings are at least inconsistent with behavioral
theories depends upon raters associating the concept of“leader” with the concept of “male,” in cases of which this study found an effect for leader gender. Although findings provided partial support for ILTs and status characteristics theory, the results of this study did not provide support for tokenism theory. This study showed that when women are considered to be of token status in an organization, their subjective ratings are not significantly influenced by their gender. These findings are inconsistent with past literature, wherein subordinates have been shown to evaluate token group members more negatively than non-token members (Schmitt et al., 2009). One possible explanation for this may relate to women’s tenure in their organizations. Heilman (1983) found that the longer a woman works in a company and the more she interacts with others, the less salient her gender becomes, and other factors (e.g., success) begin to carry more importance. Another explanation for this may be that the effects of tokenism due to gender are simply not as strong as they have been in the past. In a recent study by Stroshine and Brandl (2011), findings showed that both white females and black females experienced fewer effects of tokenism than black males. It may be that the effects of tokenism are more salient with regard to race and ethnicity than gender.
Contrary to expectations based on gender stereotypes, leader gender was unrelated to subjective ratings for most dimensions or sub-dimensions of leadership performance. The only sub-dimension where there were significant differences between male and female leaders was the takes charges sub-dimension of forceful leadership. These results are
note that although these findings are consistent with the literature on leader behaviors, these results are inconsistent with previous research on stereotypes (e.g., Eagly & Johnson, 1990). Males and females were expected to exhibit different styles of leadership (i.e., task-oriented and relations-oriented), but their subordinates’ ratings did not reflect these differences. Practical Implications
The findings of this study suggest that organization members should be aware of potential biases they may be introducing into evaluations of their supervisors. Gender bias still exists today (i.e., some individuals believe males deserve higher status in their
organizations and some see the prototypical leader as a male figure), and women may face more evaluation bias depending on whether or not their subordinates hold these partialities.
It is possible that gender bias could be a contributing factor in promotions. As stated previously, Stroh et al. (1992) have suggested that female managers’ salaries and promotion rates lag behind those of male managers. In cases of promotions and career advancement, supervisors should consider basing their decisions at least partly on measures of objective performance rather than relying only on subjective evaluations. Subjective evaluations may provide additional useful information and could still be used in the decision making process, but not exclusively.
number of female CEOs of Fortune 500 companies has climbed to a record 4%, more than half of whom were appointed within that past year (Howard, 2012).
Changes for Women in Leadership
New research has shown that the state of the entire company may predict whether females are actually the preferred leader during a given period of time. Ryan, Haslam, Hersby, and Bongiorno (2011) found that when companies are performing poorly, female leaders are preferred over male leaders. Perhaps some companies in this sample may have preferred male leaders and other companies preferred female leaders, depending on the overall context of the organization. In addition, it may be the case that perceptions of female leaders are beginning to change. A recent study by Elsesser and Lever (2011) found that male subordinates evaluated their female leaders more positively than male leaders, whereas female subordinates evaluated their male leaders more positively than female leaders. Interestingly, these perceptual shifts coincide with the changing CEO statistics. Limitations and Future Research
There were some limitations which were associated with this study. A greater number of male leaders participated than females leaders, and in a study looking at gender
overall sales goals). In an effort to correct for this issue and have all of the objective
performance measures on a common metric, all objective performance data were collected in the form of a percentage. In addition, companies that don’t measure performance objectively were excluded from this study; perhaps those companies would have showed stronger bias effects in subjective evaluations of performance. A final limitation is that data were collected from fewer raters per manager than originally anticipated. More raters per managers might have reduced error variance in the study variables that were calculated from the mean raters’ responses, possibly increasing power to detect small effects.
References
Aiken, L. S., & West, S. G. (1991). Multiple regression: Testing and interpreting interactions. Newbury Park, CA: Sage
Ayman, R., Korabik, K., & Morris, S. (2009). Is transformational leadership always perceived as effective? Male subordinates’ devaluation of female transformational leaders. Journal of Applied Social Psychology, 39(4), 852-879.
Baron, R. M., & Kenny, D. A. (1986). The moderator-mediator variable distinction in social psychological research: Conceptual, strategic, and statistical considerations.
Journal of Personality and Social Psychology, 51, 1173-1182.
Bass, B. M., & Avolio, B. J. (1993). Transformational leadership: A response to critiques. In M. M. Chemers & R. Ayman (Eds.), Leadership theory and research: New
perspectives and directions (pp. 49–80). New York, NY: Academic Press.
Bass, B. M., & Avolio, B. J. (1998). Individual consideration viewed at multiple levels of analysis: A multiple-level framework for examining diffusion of transformational leadership. In F. Dansereau & F. J. Yammarino (Eds.), Leadership: The multiple-level approaches (pp. 53–102). New York: Elsevier Science/JAI Press.
Berger, J., Fisek, M. H., Norman, R. Z., & Wagner, D. G. (1985). The formation of reward expectations in status situations. In J. Berger & M. Zelditch (Eds.), Status,
rewards, and influence (pp. 215-261). San Francisco, CA: Jossey-Bass.
Brescoll, V. L., & Uhlmann, E. L. (2010). Can an angry woman get ahead? Psychological
Cabrera, S.F., Sauer, S. J., & Thomas-Hunt, M. C. (2009). The evolving manager
stereotype: The effects of industry gender typing on performance expectations for leaders and their teams. Psychology of Women Quarterly, 33, 419-428.
Catalyst (2010). 2009 Catalyst census: Fortune 500 women executive officers and top
earners. New York, NY: Catalyst.
Dess, G. G., & Robinson, R. B. (1984). Measuring organizational performance in the absence of objective measures: The case of the privately-held firm and conglomerate business unit. Strategic Management Journal, 5, 265-273. Eagly, A. H. (1987). Sex differences in social behavior: A social-role interpretation.
Hillsdale, NJ: Erlbaum.
Eagly, A. H., & Carli, L. L. (2003). The female leadership advantage: An evaluation of the evidence. Leadership Quarterly, 14, 807-834.
Eagly, A. H., & Carli, L. L. (2007). Through the Labyrinth: The truth about how women
become leaders. Boston, MA: Harvard Business School Press.
Eagly, A. H., & Johnson, B. T. (1990). Gender and leadership style: A meta-analysis.
Psychological Bulletin, 108, 233-256.
Eagly, A. H., & Karau, S. J. (2002). Role congruity theory of prejudice toward female leaders. Psychological Review, 109(3), 573-598. doi:
10.1037//0033-295X.109.3.573
Eagly, A. H., & Sczesney, S (2009). Stereotypes about women, men, and leaders: Have times changed? In M. Baretto, M. K. Ryan, & M. T. Schmitt (Eds.), The Glass
Ceiling in the 21stCentury: Understanding Barriers to Gender Equality (pp.
21-47). Washington, DC: American Psychological Association.
Elsesser, K. M., & Lever, J. (2011). Does gender bias against female leaders persist? Quantitative and qualitative data from a large-scale survey. Human Relations,
64(12), 1555-1578.
Epitropaki, O., & Martin, R. (2004). Implicit leadership theories in applied settings: Factor structure, generalizability, and stability over time. Journal of Applied
Psychology, 89(2), 293-310. doi: 10.1037/0021-9010.89.2.293
Glomb, T. M., & Hulin, C. L. (1997). Anger and gender effects in observed supervisor-subordinate dyadic interactions. Organizational Behavior and Human Decision
Processes, 72, 281-307.
Gonzalez-Benito, O., & Gonzalez-Benito, J. (2005). Cultural vs. operational market orientation and objective vs. subjective performance: Perspective of production and operations. Industrial Marketing Management, 34, 797-829.
Haslam, S. A., & Ryan, M. K. (2008). The road to the glass cliff: Differences in the perceived suitability of men and women for leadership positions in succeeding and failing organizations. The Leadership Quarterly, 19, 530-546.
doi:10.1016/j.leaqua.2008.07.011
L. Cummings (Eds.), Research in organizational behavior (Vol. 5). Greenwich, CT: JAI.
Helfat, C. E., Harris, D., & Wolfson P. J. (2006). The pipeline to the top: Women and men in the top executive ranks of U.S. corporations. Academy of Management
Perspectives, 20(4), 42-64.
Howard, C. (2012). The new class of female CEOs. Retreived August 22, 2012, from http://www.forbes.com/sites/carolinehoward/2012/08/22/introducing-the-new-class-of-female-ceos/
Jaworski, B. J, & Kohli, A. K. (1993). Market Orientation: Antecedents and consequences. Journal of Marketing, 57(July), 53-70.
Jaworski, B. J. & Kohli, A. K. (1996). Market Orientation: Review, refinement, and roadmap. Journal of Market Focused Management, 1(2), 119-135.
Johnson, C. (1992). Gender, formal authority, and leadership. In C. L. Ridgeway (Ed.),
Gender, Interaction, and Inequality (pp. 29-49). New York, NY: Spring-Verlag.
Johnson, S. K., Murphy, S. E., Zewdie, S., & Reichard, R. J. (2008). The strong, sensitive type: Effects of gender stereotypes and leadership prototypes on the evaluation of male and female leaders. Organizational Behavior and Human Decision
Processes, 106, 39-60. doi:10.1016/j.obhdp.2007.12.002
Kanter, R. M. (1977). Men and women of the corporation. New York, NY: Basic Books. Kaplan, R. E., & Kaiser, R. B. (2003). Developing versatile leadership. MIT Sloan
Lewis, K. M. (2000). When leaders display emotion: How followers respond to negative emotional expressions of male and female leaders. Journal of Organizational
Behavior, 21, 221-234.
Lord, R. G., & Emrich, C. G. (2001). Thinking outside the box by looking inside the box: Extending cognitive revolution in leadership research. The Leadership Quarterly,
11, 551-579.
Lord, R. G., & Maher, K. J. (1993). Leadership and information processing: Linking
perceptions and performance. New York, NY: Routledge.
Lyness, K. S., & Heilman, M. E. (2006). When fit is fundamental: Performance
evaluations and promotions of upper-level female and male managers. Journal of
Applied Psychology, 91(4), 777-785. doi:10.1037/0021-9010.91.4.777
Maas, C. J. M., & Hox, J. J. (2005). Sufficient sample sizes for multilevel modeling.
Methodology, 1(3), 86-92.
Maher, K. J. (1997). Gender-related stereotypes of transformational and transactional leadership. Sex Roles, 37, 209-225.
Morrison, A. M., White, R. P., & Van Velsor, E. (1987). Breaking the glass ceiling: Can
women reach the top of America’s largest corporations? Reading, MA:
Addison-Wesley.
Ridgeway, C. L. (1992) Gender, interaction, and inequality. New York, NY: Springer-Verlag.
Ridgeway, C. L. (2001). Gender, status, and leadership. Journal of Social Issues, 57, 637-655.
Riggio, R. E. (2000). Leadership. In L. M. Porter (Ed.), Introduction to Industrial/
Organizational Psychology (pp. 339-371). Upper Saddle River, NJ: Prentice Hall.
Riggio, R. E. (2008). Leadership development: The current state and future expectations.
Consulting Psychology Journal: Practice and Research, 60(4), 383-392.
doi:10.1037/1065-9293.60.4.383
Ryan, M. K., Haslam, S. A., Hersby, M. D., & Bongiorno, R. (2011). Think crisis-think female: The glass cliff and contextual variation in the think manager-think male stereotype. Journal of Applied Psychology, 96(3), 470-484.
Schein, V. E. (1973). The relationship between sex role stereotypes and requisite management characteristics. Journal of Applied Psychology,57, 95–100. Schein, V. E. (2007). Women in management: reflections and projections. Women in
Management Review, 22(1), 6-18.
Schmitt, M. T., Spoor, J. R., Danaher, K., & Branscombe, N. R. (2009). Rose-colored glasses: How tokenism and comparisons with the past reduce the visibility of gender inequality. In M. Barreto, M. K. Ryan, & M. T Schmitt (Eds.), The glass
ceiling in the 21stcentury: Understanding barriers to gender equality (pp. 49-71).
Skagert, K., Dellve, L., Eklof, M., Poussette, A., & Ahlborg, G. r. (2008). Leaders’ strategies for dealing with own and their subordinates’ stress in public human service organizations. Applied Ergonomics, 39(6), 803-811.
doi:10.1016/j.apergo.2007.10.006
Stone, E. F., & Hollenbeck, J. R. (1989). Clarifying some controversial issues
surrounding statistical procedures for detecting moderator variables. Journal of
Applied Psychology, 74(1), 3-10).
Stroh, L. K., Brett, J. M., & Reilly, A. H. (1992). All the right stuff: A comparison of female and male managers’ career progression.Journal of Applied Psychology, 77, 251-260.
Stroshine, M. S., & Brandl, S. G. (2011). Race, gender, and tokenism in policing: An empirical Elaboration. Police Quarterly, 14(4), 344-365.
Tichy, N. M., & Bennis, W. G. (2007). Making judgment calls–The ultimate act of leadership. Harvard Business Review, 85, 94.
Watson, C., & Hoffman, L. R. (2004). The role of task-related behavior in the emergence of leaders: The dilemma of the informed woman. Group & Organization
Management, 29(6), 659-685. doi: 10.1177/1059601103254263
Table 1
Means, Standard Deviations, Reliabilities, and Intercorrelations among Study Variables
Variable M SD 1 2 3 4 5 6 7 8 9 10 11 12 13 14 15 16 17 18
1. Leader Gender .70 .46
2. Forceful
Leadership 3.22 .52 .19 .92
3. Takes Charge 3.21 .60 .23* .86** .82
4. Declares 3.16 .62 .12 .90** .69** .83
5. Pushes 3.23 .62 .22 .86** .71** .65** .82
6. Enabling
Leadership 3.35 .47 .10 .74** .70** .64** .63** .86
7. Empowers 3.37 .60 .05 .64** .55** .63** .44** .91** .89
8. Listens 3.26 .54 .02 .58** .52** .55** .42** .84** .61** .74
9. Supports 3.43 .50 .19 .56** .61** .38** .59** .81** .43** .53** .78
10. Strategic
Leadership 3.39 .48 .10 .58** .60** .47** .50** .65** .48** .40** .67** .91
11. Direction 3.40 .52 .12 .57** .61** .51** .48** .90** .43** .40** .58** .90** .82
12. Growth 3.35 .50 .10 .53** .51** .38** .43** .92** .46** .27** .56** .92** .73** .72
Table 1 (Continued)
Means, Standard Deviations, Reliabilities, and Intercorrelations among Study Variables
Variable M SD 1 2 3 4 5 6 7 8 9 10 11 12 13 14 15 16 17 18
13. Innovation 3.40 .55 .11 .53** .57** .41** .51** .94** .44** .42** .73** .94** .78** .83** .80
14. Operational
Leadership 3.41 .46 .15 .62** .62** .48** .53** .67** .55** .53** .57** .58** .62** .42** .55** .90
15. Execution 3.37 .55 .10 .57** .62** .42** .52** .66** .51** .47** .64** .66** .69** .46** .58** .85** .82
16. Efficiency 3.40 .50 .17 .52** .51** .45** .44** .43** .49** .53** .44** .43** .48** .27* .46** .90** .61** .74
17. Order 3.46 .52 .16 .52** .50** .40** .45** .42** .46** .40** .42** .42** .46** .28* .42** .91** .62** .80** .79
18. Objective
Performance .98 .17 .15 .31** .25* .36** .28* .23* .20 .16 .23* .24* .26* .27* .21 .19 .22 .15 .19
Table 2
Within-Leader and Between-Leader Variance Accounted for by each Model
Model
Hypothesis 1 Hypothesis 2
Male Tokens Female Tokens
R2Between R2Within R2Between R2Within R2Between R2Within
Forceful Leadership 15.41% 7.14% 10.54% 8.36% 10.33% 8.26%
Takes Charge 20.56% 17.85% 6.77% 4.58% 14.10% 9.80%
Declares 17.34% 34.74% 10.91% 3.41% 22.78% 27.61%
Pushes 13.58% 7.14% 11.81% 19.18% 19.08% 24.73%
Enabling Leadership 17.73% 18.21% 20.85% 17.60% 23.66% 12.45%
Empowers 15.10% 5.09% 27.99% 19.13% 22.75% 17.22%
Listens 6.03% 4.55% 25.45% 11.22% 26.03% 6.60%
Supports 16.38% 24.75% 16.60% 12.29% 13.49% 20.53%
Strategic Leadership 14.00% 9.53% 14.83% 12.57% 10.40% 4.69%
Direction 21.83% 26.67% 17.45% 10.04% 9.56% 4.71%
Growth 8.33% 23.08% 9.26% 14.80% 11.78% 18.82%
Innovation 26.71% 13.64% 15.77% 12.61% 21.61% 5.85%
Operational Leadership 22.50% 5.56% 24.40% 14.51% 29.83% 18.18%
Execution 14.29% 4.04% 21.27% 20.91% 9.55% 4.58%
Efficiency 19.63% 5.73% 21.05% 11.27% 27.41% 19.49%
Table 2 (Continued)
Within-Leader and Between-Leader Variance Accounted for by each Model
Model
Hypothesis 3 Hypothesis 4
High Male Status High Female Status
R2Between R2Within R2Between R2Within R2Between R2Within
Forceful Leadership 12.82% 7.88% 12.82% 7.88% 12.82% 7.88%
Takes Charge 12.95% 10.93% 12.95% 10.93% 12.95% 10.93%
Declares 24.73% 7.33% 24.73% 7.33% 24.73% 7.33%
Pushes 12.57% 10.43% 12.57% 10.43% 12.57% 10.43%
Enabling Leadership 18.80% 8.66% 18.80% 8.66% 18.80% 8.66%
Empowers 20.88% 11.88% 20.88% 11.88% 20.88% 11.88%
Listens 21.57% 9.01% 21.57% 9.01% 21.57% 9.01%
Supports 6.20% 3.04% 6.20% 3.04% 6.20% 3.04%
Strategic Leadership 11.34% 7.48% 11.34% 7.48% 11.34% 7.48%
Direction 10.15% 4.72% 10.15% 4.72% 10.15% 4.72%
Growth 13.63% 5.38% 13.63% 5.38% 13.63% 5.38%
Innovation 18.53% 6.80% 18.53% 6.80% 18.53% 6.80%
Operational Leadership 17.41% 10.49% 17.41% 10.49% 17.41% 10.49%
Execution 14.86% 13.86% 14.86% 13.86% 14.86% 13.86%
Efficiency 14.20% 6.57% 14.20% 6.57% 14.20% 6.57%
Table 3
Effects of Leader Gender on Subjective Ratings
Female Leaders
N = 26
Male Leaders
N = 62
Dependent Variable M SD M SD F (15,62) p 2p
Forceful Leadership 3.16 0.56 3.36 0.43 3.253 .075 .041
Takes Charge 3.12 0.63 3.42 0.48 4.245 <.05 .053
Declares 3.11 0.63 3.27 0.58 1.054 .308 .014
Pushes 3.13 0.68 3.42 0.44 3.807 .055 .048
Enabling Leadership 3.32 0.49 3.42 0.42 .950 .333 .012
Empowers 3.34 0.59 3.41 0.62 .197 .658 .003
Listens 3.26 0.57 3.28 0.47 .022 .884 .000
Supports 3.36 0.53 3.56 0.41 2.991 .088 .038
Strategic Leadership 3.36 0.48 3.46 0.47 1.065 .305 .014
Direction 3.37 0.51 3.49 0.54 1.013 .317 .013
Growth 3.31 0.52 3.41 0.48 .739 .393 .010
Innovation 3.35 0.56 3.48 0.53 1.049 .309 .014
Operational Leadership 3.37 0.44 3.51 0.5 1.848 .178 .024
Execution 3.33 0.54 3.45 0.56 .840 .362 .011
Efficiency 3.37 0.49 3.51 0.49 2.044 .157 .026
Figure 1. Interaction between leader gender and objective performance on the growth sub-dimension of strategic leadership.
Figure 2. Interaction between leader gender and objective performance on the direction sub-dimension of strategic leadership.
Appendix A
Thesis Proposal Manuscript
THE EFFECT OF LEADER GENDER ON THE RELATION BETWEEN WORKGROUP PERFORMANCE AND SUBJECTIVE PERCEPTIONS OF LEADER EFFECTIVENESS
by
Alexandra K. Mullins
A thesis submitted to the Graduate Faculty of North Carolina State University
in partial fulfillment of the requirements for the degree of
Master of Science
Psychology
Raleigh, North Carolina 2010
APPROVED BY:
_______________________________ ______________________________
Dr. Lori Foster Thompson Dr. Mark A. Wilson
The Effect of Leader Gender on the Relation Between Workgroup Performance and Subordinate Perceptions on Leader Effectiveness
The Importance of Leadership in Organizations
Leadership plays a critical role in organizations. Leadership has been defined as the capability to successfully guide a group of individuals toward a common goal or purpose (Riggio, 2000). Leadership typically consists of behaviors which influence, motivate,
organize, and coordinate employees’ work (Eagly & Carli, 2007). Not all leaders are equally effective at providing such guidance, so organizations spend billions of dollars annually on leadership development in an attempt to help people become better leaders (Riggio, 2008).
In addition to their obvious role in directing work activities, leaders have the ability to influence employees (e.g., attitudes and mental health) and the organization itself (e.g., climate and culture). Leaders can help increase employees’sense of empowerment by giving them autonomy and support in their work (Riggio, 2000). They reduce employee stress by actingas “shock absorbers” during organizational changeas well as acting to maintain
employee trust (Skagert, Dellve, Eklof, Poussette, & Ahlborg Jr., 2008). Increasing employee confidence and decreasing employee stress can aid in creating an industrious work
employees, etc. (Westaby, Probst, & Lee, 2010). Ultimately, much of an organization’s success rests in the hands of its leaders (Tichy & Bennis, 2007).
Disparities Between Male and Female Leaders
For years, statistics have shown that men make more money than women, even when holding the same job position (Eagly & Carli, 2007). Stroh, Brett, and Reilly (1992) suggest that female managers’ salaries and career advancement rates are behind those of male
In addition to the gender discrepancy in executive positions, there can be no doubt that, in many respects, women differ from men. The apparent differences between the sexes have resulted in the formation of gender stereotypes. Women are commonly expected to behave in a communal manner (e.g., concerned with the care of others), while men are often associated with assertive and controlling behaviors, known as agenticism (Eagly & Sczesney, 2009). These stereotypes carry over into work roles and affect which job positions are
perceived to be more suitable for females and which positions are perceived to be more suitable for males. Since people believe that women behave differently than men, they likewise believe that women should hold different jobs than men in the workplace (Ridgeway, 1992).
When men and women are in leadership positions, are their leadership behaviors really different? Helfat, Harris, and Wolfson (2006) contend that relatively little is known about comparisons between women and men in upper management, particularly at the CEO level. However, researchers have posited that male and female leaders display few behavioral differences, for the most part (Morrison, White, & Van Velsor, 1987). Despite a lack of evidence for significant behavioral differences, prior research suggests that observers rate male leaders more positively than female leaders (Eagly & Carli, 2007; Eagly, Makhijani, & Klonsky, 1992).
a more masculine style of leadership. Women leaders were also found to be less favorably evaluated by male subordinates when using assertive speech or expressing anger (Glomb & Hulin, 1997; Lewis, 2000). Even when the same behaviors were carried out by both men and women, women were evaluated more negatively and perceived to be less valuable by male subordinates (Eagly et al., 1992). Gender bias was found to have a profound negative effect on performance evaluations and professional advancement of women in organizations. Overall, female leaders tend to encounter greater obstacles to advancement and performance than males in the same position (Lyness & Heilman, 2006).
Positive evaluations of female leaders. Female leaders may be evaluated positively dependent upon leadership style and organizational performance. These positive evaluations are not held as the norm, but they do occur in certain contexts. Research suggests that women are likely to be evaluated positively when they adopt a feminine style of leadership (e.g., democratic toward employees or considerate of employee well-being; Eagly et al., 1992; Eagly & Carli, 2003). In fact, female leaders are rated as high as male leaders when both sexes adopt feminine leadership (Eagly et al., 1992). Moreover, depending on the company’s financial performance (e.g., either prospering or declining), women are more often sought for leadership positions and evaluated positively in times of lower organizational performance, although this tendency also places them at greater risk for failure (Haslam & Ryan, 2008).
subjectivity, subjective evaluations are common in the workplace (Moers, 2005). Ratings from subordinates have been argued to be the most reliable subjective indicators of leader performance because leaders interact more regularly with subordinates than superiors or peers (Hogan, Curphy, & Hogan, 1994; Mount, 1984); therefore, subordinates are likely to know more about leaders’performance-related behaviors. Furthermore, leaders may not always have superiors or peers,depending on their location in the organization’s structure, but are guaranteed to always have subordinates (Hogan et al., 1994).
Gender has been found to affect performance evaluations. Moers (2005) claims that, in general, subjective ratings lead to gender bias in performance evaluations. Jonnergard, Stafsud, and Elg (2010) support this notion of bias by arguing that indicators of good
performance tend to be based on male norms. Gender also influences how these performance evaluations are perceived by the individual who is being evaluated. Men and women attach more importance to different parts of the evaluations. Women are more concerned with who is evaluating them (e.g., subordinates, peers, superiors), while men tend to focus on what is being evaluated (e.g., performance, leadership effectiveness; Jonnergard et al., 2010). In an effort to examinegender’s influence on subjective evaluations in the current study, objective measures will also be used to measure leader performance.
workgroup performance criteria (e.g., unit profit, revenue growth, percent of financial goals hit) that exist independent of subjective perception. One might expect a positive relationship between objective measures and subjective measures. Past research has suggested that objective measures and subjective measures of company performance are correlated (Gonzalez-Benito & Gonzalez-Benito, 2005; Jaworski & Kohli, 1993); however, this issue has primarily been examined in the context of market orientation and company competitors and does not address the form of the relationship between objective and subjective
evaluations of leaders (Lyness & Heilman, 2006).
In addition to allowing for examination of their relation, having more than one mode of measurement (e.g., objective performance and subjective evaluations) of leader
Theoretical Explanations for Disparities
Interestingly, research on gender differences and leadership style has not typically been driven by theories about gender’s impact on leadership. In fact, of the studies not explicitly based on a specific theory, gender theories are often not even mentioned until results or discussion sections of journal articles (Ayman, Korabik, & Morris, 2009). In essence, these theories have not truly been tested as explanations for existing disparities. There are a number of theories that, when tested, could provide explanations for disparities likely to be seen in male and female leader evaluations. Among these theories are: tokenism theory (Kanter, 1977), status characteristics theory (Berger, Fisek, Norman & Wagner,
1985), stereotype-related theories [including individuals’implicit leadership theories (Lord & Maher, 1993), behavioral stereotypes (Eagly & Johnson, 1990), social role theory (Eagly, 1987), role congruence theory (Eagly & Karau, 2002)], and transformational leadership theory (Bass & Avolio, 1993).
Further, being a member of the minority comes with its consequences. According to Kanter (1977), these consequences include the following: (1) strained performance by tokens, resulting from feeling that they are constantly in the spotlight and not blending in with the rest of the dominant group; (2) strained communication, resulting from the dominant group not knowing how to treat the tokens; (3) stereotyping of the tokens by the dominant group and only accepting behaviors that are in harmony with the token group’s stereotyped role. If the token does not adhere to the expected role, then he or she is more likely to be evaluated negatively by others. However, meta-analytic research found that token female leaders were more likely to adopt a masculine style of leadership in an effort to maintain authority (Eagly & Johnson, 1990). Peers and subordinates generally evaluate token group members in more negatively (Schmitt, Spoor, Danaher, Branscombe, 2009).
Status characteristics theory.Status characteristics theory suggests that a person’s sex is a status characteristic (i.e., high or low status; Berger et al., 1985). Simply put, on this view the male status is viewed as more respected than the female status (Berger et al., 1985; Ridgeway, 1992). Status may, in turn, affect the leader’s self-esteem and even how he or she interacts with subordinates. Leaders may interact differently with subordinates in a female-dominated organization compared to a male-female-dominated organization because the female leader may feel less anxiety leading a group of females. According to this view, the female leader does not feel inferior to her female subordinates, therefore also feeling more positive about the interaction. Research suggests that a primary component affecting the nature of the leader-subordinate interaction is the gender of the leader (Johnson, 1992).
In situations where both men and women are present (e.g., a business meeting), this theory suggests that men will be awarded more power, allowed more time to talk, and also have their ideas taken more seriously (Ridgeway, 2001; Watson & Hoffman, 2004). In similar situations, women’s expectations for themselves are likely to be affected solely because of their gender’s status. Others who view the status of gender as relevant are also likely to form their own expectations. Research has shown that women whose roles are not congruent with their status (i.e., being a female leader) will be given lower evaluations as well as lower attributions of ability and influence; further, they will have a lower likelihood of even becoming a leader (Watson & Hoffman, 2004).