ABSTRACT
CLINCH, ADAM STEWART. Evaluation of Hallermeier and Rhodes Methodology and Cross-Shore Numerical Model as Predictors for Beach and Dune Erosion for Flood Mapping Application. (Under the direction of Dr. Margery Overton).
The Federal Emergency Management Agency adopted the ‘540 Rule,’ as a dune erosion
guideline in 1988. The ‘540 Rule’ is a simple geometric method used in flood mapping to
alter dune topography prior to delineating the landward extend of wave effects for the 100
year storm. This procedure was based on the research and recommendations of Hallermeier
and Rhodes, who used historic data to relate the retreat or removal of a primary dune to A)
the cross-sectional area of the pre-storm frontal dune reservoir, and B) the return period of
the storm event, determined from the stillwater flood level (SWFL). Although the ‘540 Rule’
is still in use today, this guideline was primarily incorporated due to a lack of modeling
capabilities at the time. Presently, Cross-Shore Numerical Model (CSHORE) has gained
interest as a possible replacement to the Hallermeier and Rhodes’ based methodology for
predicting the profile morphology associated with the 100 year storm. In this research, the
capabilities of Hallermeier and Rhodes methodology and CSHORE were compared to field
data on the North Carolina Outer Banks. After establishing a study site on the Pea Island
National Wildlife Refuge and selecting three time periods of available pre and post-storm
topographic data, the two procedures were evaluated as predictors of A) dune removal, and
of B) beach and dune erosion above the SWFL of the storm event. Results showed that both
the Hallermeier and Rhodes methodology and the CSHORE model were unable to predict the
removal of all field cases. Both profile morphology techniques underestimated the erosion
one multiple storm event case, however, showed closer agreement to the erosion prediction
of Hallermeier and Rhodes. The sensitivity of the Hallermeier and Rhodes results to the
SWFL were found to have a significant impact to the dune removal and erosion result, and
tended to improve with an increased water elevation. Further investigation of both
CSHORE’s modeling capabilities and the Hallermeier and Rhodes historic data set is
© Copyright 2013 by Adam Clinch
Evaluation of Hallermeier and Rhodes Methodology and Cross-Shore Numerical Model as Predictors for Beach and Dune Erosion for Flood Mapping Application
by Adam Clinch
A thesis submitted to the Graduate Faculty of North Carolina State University
in partial fulfillment of the requirements for the degree of
Master of Science
Civil Engineering
Raleigh, North Carolina
2013
APPROVED BY:
_______________________________ ______________________________ Dr. Margery F. Overton Dr. Billy L. Edge
Committee Chair
DEDICATION
BIOGRAPHY
Adam Clinch was raised in Venice, Florida with his parents, Jim and Bobbie, his older
brother, James, and his younger sister, Annie. Venice being located on the Gulf Coast, gave
Adam a passion for water activities, such as fishing, surfing, boating, and scuba diving.
Adam spent most of his time at the beach or in his john boat, which fueled his interest in
coastal processes and the power of coastal storm events.
After high school, Adam obtained a Bachelor of Science in Civil Engineering and a Bachelor
of Arts in Spanish from the University of Florida, in Gainesville. In addition to enjoying the
consecutive victories of the UF football and basketball programs, Adam took advantage of
study abroad opportunities in his undergraduate career, learned to play the guitar, and was
honored to open the 2009 Gator Growl by playing a song on the guitar that he wrote and
composed. Adam spent five months in Valparaíso, Chile, and three months in Panama,
Republic of Panama, studying Spanish, traveling, and exploring the unique cultures in these
regions.
After finishing his undergraduate degrees at UF, Adam moved to Raleigh, North Carolina to
pursue Coastal Engineering at North Carolina State University while working as a research
and teaching assistant. In January, 2013, Adam defended his thesis, accepted a job offer as
ACKNOWLEDGMENTS
I would like to thank my advisor, Dr. Margery Overton, who pushed me to work the hardest I
have ever worked in my life. This was a tough journey for me, but I can call myself a much
improved Coastal Engineer because of her commitment. I would also like to thank both
committee members, Dr. Billy Edge and Dr. Mohammed Gabr for their dedication to my
education.
I would like to recognize my parents, Jim and Bobbie, who both supported me through this
accomplishment. They always given me the love and confidence to make the right choices,
work hard, and succeed. Thanks to my nana, Martine, for her prayers, her love and support
(not to mention those pounds of home cooked meals that probably kept me from getting
scurvy in undergrad). Thanks to my grandmother, Dorothy, for her continued
encouragement of my work. I would like to credit my brother, James, who introduced me to
Civil Engineering. Along with my sister-in-law, Casey, and nephew, Eli, my brother has
always been there to give guidance, support, and at times, get his little brother out of trouble.
Thanks to my sister Annie, who has taught me a lot about being happy, working hard, and
being a leader: she inspires me to do better every single day. To all of my family: there is
nothing I can put to paper to express how much I appreciate your love and your positive
influence on me. I am looking forward to coming home to Venice, sharing a sunset at the
beach, and catching up with each one of you amidst the bouts of inappropriate jokes, good
I would like to give special recognition to my beautiful wife, Kristin, who has been on the
front lines of grad-life with me over the past couple years. She has understood the hard work
that has gone into this thesis, laughed at the stress, and given me the strength to move
forward and succeed. Kristin, you’ve got a huge heart, and I can’t express how blessed I am
to have you in my life. I’m all yours, love.
Sometimes it is the combined support from a large group of intelligent, loving people who
manage contribute to the success of an individual. This has been the case for not just this
master’s thesis research, but the path that has led me to this milestone. The following is an
incomplete and growing list of people who have instilled in me a passion for coastal
processes, and had a positive effect on my graduate career. Some of the people listed below
are brilliant scientists and engineers who have provided essential input directly towards
promoting this thesis work. Some of the people are loyal friends who may have taken me
fishing or surfing, or provided me with the prayers, support, guidance that led me to and
through my graduate career. You are all invaluable to me. I would like to wholeheartedly
Dan Pitotcchi
Beth Sciaudone
Tim Blanton
Greg ‘Tadpole’ Sapp
Glenn Johnson
Dwayne Kirkland
Mike Davis
Jose Hernandez
Dr. David Horhota
Brad Johnson
Kathy and Teryl Todd
Clayton and Yayle Jacob
Ron Rountree
Dr. Robert Thieke
Sam ‘Daddy’ Marshall
Brandon and Steph Grant
Ross Oliver
Erik Hardin
Onur Kurum
Jason Patskotski
La familia Jimenez
Hannah Hall
Tyler and Laura Wegener
John Wescott
TABLE OF CONTENTS
LIST OF TABLES ... x
LIST OF FIGURES ... xii
CHAPTER 1: Background ... 1
1.1 FEMA Flood Hazard Mapping and Dune Erosion Introduction ... 1
1.2 Current FEMA Dune Erosion Practice ... 3
1.3 Hallermeier and Rhodes Capabilities ... 7
1.4 Cross-Shore Numerical Model ... 9
1.4.1 CSHORE Model Development ... 9
1.4.2 CSHORE Model Calibration ... 10
1.4.3 CSHORE Model Capabilities ... 11
1.5 Research Objective ... 12
CHAPTER 2: Study Site and Storm Details ... 14
2.1 Study Site Location ... 14
2.2 Existing Pea Island Research ... 15
2.3 Storms ... 16
2.3.1 Hurricane Isabel ... 17
2.3.2 The October 2008 Storm ... 21
2.3.3 The October 2009 Storm ... 23
2.3.4 Nor’Ida... 23
2.3.5 Hurricane Irene ... 26
CHAPTER 3: Methodology ... 29
3.1 Workflow ... 29
3.2 Temporal Elevation Data ... 33
3.2.1 Data Acquisition ... 33
3.2.2 Computing Digital Elevation Models ... 35
3.2.3 Profile Extraction ... 36
3.3 Field Dune Analysis ... 41
3.3.1 Determination of the Reservoir Landward Limit ... 42
3.3.2 Dune Toe Selection ... 45
3.3.3 Field Determination of Dune Retreat or Dune Removal ... 48
3.3.3.1 CSHORE Determination of Dune Retreat or Dune Removal ... 51
3.4 Hallermeier and Rhodes Analysis ... 51
3.4.1 Overview ... 51
3.4.2 Stillwater Flood Levels for Pea Island Study Site ... 52
3.4.3 Storm Return Periods... 53
3.4.4 Erosion Prediction ... 54
3.4.4.1 Dune Reservoir Calculation ... 55
3.4.4.2 Cumulative Event Methodology ... 55
3.4.4.3 Sensitivity Analysis ... 57
3.5 CSHORE Model ... 58
3.5.1 Overview ... 58
3.5.2 Field Data Configuration ... 58
3.5.3 Input Storm Data ... 60
3.5.3.1 Water Elevation Data ... 61
3.5.3.2 Wave Data ... 61
3.5.3.3 Storm Duration... 62
3.5.4 CSHORE Input Parameters ... 63
3.6 Erosion Calculations ... 66
3.6.1 Total Erosion ... 66
3.6.2 Dune Toe Erosion ... 68
CHAPTER 4: Results ... 70
4.1 Results ... 70
4.2 Analysis 1: Dune Removal Analysis ... 71
4.2.1.1 Hallermeier and Rhodes: Analysis of Failed Predictions of Field Dune Removal
... 74
4.2.2 CSHORE: Dune Removal Success and Failure ... 78
4.2.2.1 CSHORE: Analysis of Failed Predictions of Field Dune Removal ... 78
4.2.3 Hallermeier vs. CSHORE: Dune Removal Success and Failure ... 79
4.3 Analysis 2: Median Retreat Erosion Analysis ... 80
4.3.1 Hallermeier and Rhodes: Median Retreat Erosion Results ... 80
4.3.2 CSHORE: Median Retreat Erosion Results ... 85
4.3.3 CSHORE vs. Hallermeier and Rhodes: Median Retreat Erosion Results ... 88
4.4 Analysis 3: Sensitivity Analysis ... 91
4.4.1 Dune Removal Sensitivity ... 93
4.4.2 Median Retreat Case Erosion Sensitivity ... 96
4.4.3 SWFL Sensitivity Results ... 99
CHAPTER 5: Conclusion ... 101
5.1 Conclusion ... 101
REFERENCES ... 104
Appendix A: Isabel – Transects 1, 3, 4, 5, 6, and 7 ... 113
Appendix B: Storm Hydrographs ... 127
Appendix C: Dune Removal Success and Failure Results ... 133
Appendix D: Total Erosion and Dune Toe Erosion Results ... 138
LIST OF TABLES
Table 1: Summary of storm conditions from FRF in Duck, NC. ... 17
Table 2: Summary of lidar, hydrographic, and photogrammetric surveys. ... 35
Table 3: Screened transects, with grey transects selected for research. ... 40
Table 4: Median dune toe elevations for distinct dune toe cases, compared to berm elevations and extreme event setup and runup calculations. ... 48
Table 5: SWFL’s (m, NAVD88) corresponding to the 10, 50, 100, and 500 year storms at the Pea Island study site. ... 52
Table 6: Equation 1 erosion estimates calculated from SWFL recurrence interval. ... 55
Table 7: Boundary condition and timing parameters. ... 64
Table 8: CSHORE execution and physical parameters. ... 65
Table 9: Summary of Hallermeier and Rhodes and CSHORE failure cases. ... 72
Table 10: Erosion estimate and median erosion field results, given the original SWFL of each storm event. ... 92
Table 11: Erosion estimate and median erosion field results, given a SWFL increased by 10 centimeters for each storm event. ... 92
Table 12: Erosion estimate and median erosion field results, given a SWFL decreased by 10 centimeters for each storm event. ... 92
Table 13: Hurricane Isabel dune removal/retreat results. ... 133
Table 14: Three Event Case dune removal/retreat results. ... 135
Table 16: Hurricane Isabel total erosion and dune toe erosion results. ... 138
Table 17: Three Event Case total erosion and dune toe erosion results. ... 140
Table 18: Hurricane Irene total erosion and dune toe erosion results. ... 141
Table 19: Altered Hallermeier and Rhodes results and Total Erosion results given a 10
centimeter increase in the SWFL for Hurricane Isabel. ... 142
Table 20: Altered Hallermeier and Rhodes results and Total Erosion results given a 10
centimeter increase in the SWFL for the Three Event Case. ... 144
Table 21: Altered Hallermeier and Rhodes results and Total Erosion results given a 10
centimeter increase in the SWFL for Hurricane Irene. ... 145
Table 22: Altered Hallermeier and Rhodes results and Total Erosion results given a 10
centimeter decrease in the SWFL for Hurricane Isabel. ... 146
Table 23: Altered Hallermeier and Rhodes results and Total Erosion results given a 10
centimeter decrease in the SWFL for the Three Event Case. ... 148
Table 24: Altered Hallermeier and Rhodes results and Total Erosion results given a 10
LIST OF FIGURES
Figure 1: Delineation example of V-Zone and A-Zone (Federal Emergency Management
Agency, 2007). ... 2
Figure 2: FEMA dune reservoir illustration (Federal Emergency Management Agency, 2007). ... 4
Figure 3: FEMA dune retreat and dune removal illustration (Federal Emergency Management Agency, 2007). ... 6
Figure 4: A) Location map of relevant sites on the NC Outer Banks. ... 15
Figure 5: Hurricane Isabel storm track ... 18
Figure 6: Ortho photos of study site before and after Hurricane Isabel. 2002 imagery obtained from NCOneMap, 2003 imagery obtained from the NCDOT. ... 20
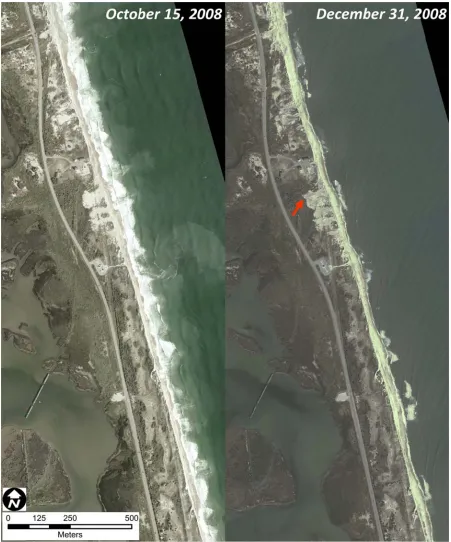
Figure 7: NCDOT imagery of study site before and after the effects of the October 2008 Storm. ... 22
Figure 8: NCDOT imagery of study site before and after the October 2009 Storm and Nor'Ida. ... 25
Figure 9: Hurricane Irene storm track. ... 27
Figure 10: NCDOT imagery of study site before and after the effects of Hurricane Irene. ... 28
Figure 11: Workflow of profile selection and processing. ... 30
Figure 12: Hallermeier and Rhodes analysis workflow diagram. ... 31
Figure 13: CSHORE analysis workflow diagram. ... 32
Figure 15: Study site transects and NC 12 benchmarks overlaid on NCDOT post-Irene
orthophoto. ... 38
Figure 16: 3D imagery of transect compromised by lack of long-shore uniformity. ... 41
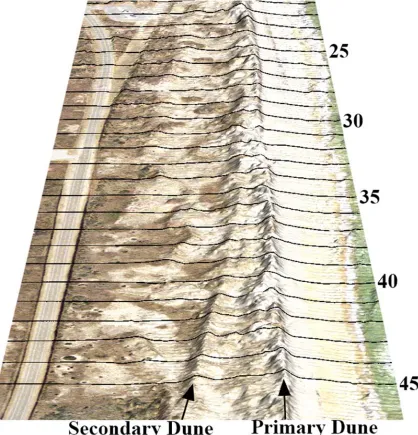
Figure 17: 3D Imagery of southern region of study site, depicting a landward secondary dune
system. ... 44
Figure 18: Methodology for selection of the dune reservoir landward limit. ... 45
Figure 19: Example removal (A, B, and C) and retreat (D, E, and F) cases with remaining
post-storm dune above the removal profile shaded in grey. ... 50
Figure 20: SWFL vs. Flood Recurrence Interval from Dare County Flood Insurance Study
(2006). ... 54
Figure 21: CSHORE illustration of shore-relative variables (Kobayashi, 2009). ... 60
Figure 22: Pre-Isabel Transect 36 CSHORE input profile with patched bathymetry. ... 60
Figure 23: A) Isabel Transect 36 showing in grey, erosion above SWFL, extending landward
to the point of profile intersection. B) Isabel Transect 28, shown in grey, erosion
above the SWFL extending landward to a selected location where profile elevation
difference is 0.09 m... 68
Figure 24: Isabel Transect 36 showing erosion in grey, measured above the dune toe
elevation. ... 69
Figure 25: Success and failure cases of Hallermeier and Rhodes dune retreat or removal
prediction. ... 74
Figure 26: Dune reservoir uncertainties for Hallermeier and Rhodes failed predictions of field
Figure 27: Total Erosion vs. SWFL return period for all retreat cases. ... 81
Figure 28: Original Hallermeier and Rhodes results for 38 historic cases compared to the Pea
Island Study Site results (1988). ... 82
Figure 29: Total Erosion vs. SWFL return period for all retreat cases. ... 84
Figure 30: Median values of Total Erosion for retreat cases, calculated from field data and
CSHORE outputs. ... 86
Figure 31: Median values of Dune Toe Erosion for retreat cases, calculated from field data
and CSHORE outputs. ... 88
Figure 32: Median of retreat case erosion measurements for field and CSHORE results,
compared to Hallermeier and Rhodes' Equation 1. ... 89
Figure 33: Success/failure plot of dune reservoir vs. return period, given an SWFL increase
of 10 centimeters. ... 95
Figure 34: Success/failure plot of dune reservoir vs. return period, given an SWFL decrease
of 10 centimeters. ... 96
Figure 35: Total Erosion vs. SWFL return period for all retreat cases, given a SWFL
increased by 10 centimeters. ... 98
Figure 36: Total Erosion vs. SWFL return period for all retreat cases, given a SWFL
increased by 10 centimeters. ... 99
Figure 37B: Tide and wave hydrograph for Hurricane Isabel, gathered from FRF in Duck,
NC. ... 127
Figure 38B: Wave period hydrograph for Hurricane Isabel, gathered from FRF in Duck, NC.
Figure 39B: Wave angle hydrograph for Hurricane Isabel, gathered from FRF in Duck, NC.
... 128
Figure 40B: Tide and wave hydrograph for Three Event Case, gathered from FRF in Duck,
NC. ... 129
Figure 41B: Wave period hydrograph for Three Event Case, gathered from FRF in Duck,
NC. ... 129
Figure 42B: Wave angle hydrograph for Three Event Case, gathered from FRF in Duck, NC.
... 130
Figure 43B7: Tide and wave hydrograph for Hurricane Irene, gathered from FRF in Duck,
NC. ... 131
Figure 44B: Wave period hydrograph for Hurricane Irene, gathered from FRF in Duck, NC.
... 131
Figure 45B: Wave angle hydrograph for Hurricane Irene, gathered from FRF in Duck, NC.
CHAPTER1:BACKGROUND
1.1 FEMAFLOOD HAZARD MAPPING AND DUNE EROSION INTRODUCTION
The Federal Emergency Management Agency (FEMA) has been responsible for guaranteeing
the availability of insurance for the risk of flood to property since the National Flood
Insurance Act was passed in 1968 (1988). FEMA’s responsibilities include motivating
communities to be able to soundly manage their local floodplains. Due to these
accountabilities, FEMA has invested much time and energy into the development of Flood
Insurance Studies for over 23,000 communities in the National Flood Insurance Program
(NFIP) (Wescott, 2011).
Because coastal communities can be exposed to extreme hazards from storm surges and
wave action, one of the priorities in flood mapping is the delineation of A-zones and V-zones
(Federal Emergency Management Agency, 2007). A-zones are areas of inundation by the
one percent annual chance flood. V-zones are areas in which waves or high velocity water
can cause structural damage during the one percent annual chance flood. Although the
location of a V-zone can caused by wave runup or wave overtopping, the V-zone typically
delineates the zone in which a three foot or greater controlling wave height could occur.
Figure 1 is an illustration of a V-zone with wave heights over three feet, and a more landward
A-zone, where the wave heights over the flooded region are below three feet. Because wave
height estimation is a function of depth, the topography of the coastal region affects the
Figure Coast not al Rhod There wave the co In the guida that s not b some
e 1: Delineation
tal dunes are
lways withst
des, 1988). D
efore, the de
e effects asso
oastal erosio
e past, the 19
ance for treat
sand dunes in
e considered
e dunes were
n example of V
e often highe
tand the amo
Dune erosion
elineation of
ociated with
on associated
975 Guidelin
ting dune er
n the area ha
d as effective
e subjectively
V-Zone and A-enhanced f
er than the 1
ount of erosi
n could pote
V-zones req
the one perc
d with such s
nes for Ident
osion. Thes
ave repeated
e surge and w
y removed w
Zone (Federal for purposes of
00-year floo
ion caused b
entially impa
quires not on
cent annual c
storm (Dewb tifying Coast se guidelines dly withstood wave barrier while others Emergency M f this paper.
od elevation,
by a massive
act the inland
nly a depth-d
chance storm
berry & Dav
tal High Haz
s stated, “Un
d wave attack
rs.” As the r
were left int
Management Ag
, however, c
storm (Hall
d extent of a
dependent de
m, but also c
vis, 1989).
zard Zones p
nless historic
k during sto
recommende
tact as a barr
gency, 2007). oastal dunes lermeier & a V-zone. etermination onsideration provided the
cal data indic
rms, they sh
ed procedure
In 1988, FEMA hired engineering firm, Dewberry and Davis to determine a simple method
to simulate dune erosion, given any shore-normal dune geometry and the 100-year base flood
elevation.
Researchers, Robert J. Hallermeier and Perry E. Rhodes, categorized storm-induced dune
loss as either dune retreat or dune removal (1988). Dune retreat was classified as any frontal
dune escarpment associated with a storm where there is no evidence of landward sediment
transport. Dune removal was categorized as complete eradication of a dune by a storm.
Hallermeier and Rhodes used 38 storm cases from 11 states to establish a method for
determining dune retreat and dune removal (Dewberry & Davis, 1989). The 38 storm cases
were evaluated by establishing a relationship between the shore normal cross-section of
eroded area to storm intensities measured by the return period of the storm’s stillwater flood
level (SWFL). For each storm event, Hallermeier and Rhodes measured erosion above the
SWFL of the event. The median erosion area of retreat cases was then used to estimate the
erosion for each event. The median erosion values from each storm case produced the
following relationship, which will be referenced as Equation 1, or the Hallermeier and
Rhodes equation:
Erosion [m2] = 8 * ( Recurrence Interval [yr] )0.4 (1)
1.2 CURRENT FEMADUNE EROSION PRACTICE
FEMA adopted the Hallermeier and Rhodes equation (Equation 1) and its methodology to
estimate retreat or removal of a dune cross-section for the 100 year storm event. This
above empir rule f comp of the seaw Partn Mana
e the SWFL
rical error of
for FEMA fl
pared to the a
e dune. The
ard of the ste
ners are instru
agement Age
Figure 2: F
will be near
f Equation 1
lood mappin
area of the p
primary fro
eep rear slop
ucted to iden
ency, 2007).
EMA dune res
rly 50 m2, or
for a 100 ye
ng application
primary front
ontal dune is
pe of the dun
ntify the prim
.
servoir illustrat
r about 540 f
ear storm is
n, this predic
tal dune rese
defined as t
ne. Figure 2
mary frontal
tion (Federal E
ft2, for the 10
plus or minu
cted 50 m2 a
ervoir to dete
the region ab
2 shows the w
l dune reserv
Emergency Man
00 year storm
us 15 m2. U
amount of er
ermine the r
bove the 100
way in which
voir (Federal
nagement Age
m. The
Under the 540
rodible sand
etreat or rem
0 year SWFL
h flood mapp
The first step of FEMA’s dune erosion assessment is to measure the frontal dune reservoir
for each selected transect. Depending on the area of the frontal dune reservoir of each
transect, the dune is designated to retreat or remove, as defined above. According to FEMA
guidelines derived from Hallermeier and Rhodes’ research, if a frontal dune reservoir has
more than 50 m2 of sediment, the dune is expected to retreat, as shown in Figure 3. For a
dune retreat case, the profile is altered so that 50 m2 of sediment are removed from the
seaward portion of the dune profile above the 100 year SWFL (Hallermeier & Rhodes,
1988). A 1:1 duneface slope composes the landward limit of the dune retreat cross-section
and a 1:40 slope creates the new approach slope to the duneface. The total area of erosion
from the duneface is deposited below the seaward extension of the approach slope, with a
1:12.5 slope design as the seaward limit of the erosion/deposition balance.
For cases where the frontal dune reservoir does not contain 50 m2 of sediment, the entire
dune is removed, as illustrated in Figure 3. The geometric shape of the removed dune
primarily originated from three historic gulf coast storm events (Dewberry & Davis, 1989).
The dune is eliminated by removing all sand above a 1:50 slope, increasing landward from
the location of the dune toe (Hallermeier & Rhodes, 1988). If the toe cannot be located,
FEMA recommends the use of either the typical elevation of nearby dune toe elevations, or
the 10 percent SWFL elevation as the estimated dune toe location (Federal Emergency
Management Agency, 2007). The dune toe must be measured above any beach berms in the
Figur Since the ‘5 eleva the er prima can p
re 3: FEMA du
e many storm
540 rule,’ is
ations and m
rosion effect
ary frontal d
prohibit any m
une retreat and
m-induced er
always inco
apping the V
ts are model
dune, the V-Z
man-made a
dune removal
rosion cases
rporated into
V-Zone (Fed
ed, if the
V-Zone is still d
alteration of t
illustration (F
remove or m
o a beach pr
deral Emerge
Zone does n
delineated to
these barrier
ederal Emerge
modify front
rofile prior to
ency Manage
not surpass th
o this region
r dunes (Hal
ency Managem
tal dunes on
o determinin
ement Agen
he landward
n so that NFI
llermeier & R
ment Agency, 2
the U.S. coa
ng wave
ncy, 2003). A
d extent of th
1.3 HALLERMEIER AND RHODES CAPABILITIES
Advantages and disadvantages of the Hallermeier and Rhodes methodology have been
documented since its introduction. As a primary advantage, this procedure offered a simple
geometric estimate of dune erosion for the generic 100 year storm (Hallermeier & Rhodes,
1988). Some drawbacks of this methodology include the assumed constant slopes for
post-storm profiles, without regard for site-specific characteristics such as pre-post-storm slope
conditions, sediment grain size, consolidation, or vegetation. Additionally, storm
characteristics, such as duration or wave climate, remain unaccounted for in this procedure.
Also, dune erosion is expected to decrease for areas with wide beaches, but this is not
incorporated into the Hallermeier and Rhodes methodology. The geometric procedure of
retreat and removal may be flawed for some cases. For example, a dune retreat case in an
area with long beaches or shallow bathymetries can make a balanced deposition of the
removed sand impossible (Dewberry & Davis, 1989).
The Coastal Construction Manual recommends increasing the 540 ft2 dune reservoir
regulation to 1100 ft2 when designing a dune to prevent removal during the 100 year storm
(Federal Emergency Management Agency, 2005). The manual cites three reasons for this
recommendation:
1) The ‘540 rule’ reflects the size of the dune at the time of mapping, neglecting
future long-term erosion.
3) Using the median erosion condition to create Equation 1 means that this analysis
will underestimate dune erosion half of the time.
Originally, Hallermeier and Rhodes’ simple, geometric dune erosion method was
incorporated due to a lack of modeling capabilities and a lack of understanding of overwash
properties on beachfront dunes (Dewberry & Davis, 1989). Although modeling capabilities
have improved in the past two decades, FEMA’s dune erosion guidelines have not been
altered since the implementation of Hallermeier and Rhodes’ procedure. Presently, FEMA is
seeking better procedures to accurately detect, evaluate, and communicate flood insurance
data in order to reduce flood risk (Wescott, 2011). Several aspects of flood mapping are
being evaluated to embrace current technology: one form of research involves improving
FEMA’s dune erosion guidelines. Brent Payne conducted research to test the ‘540 Rule’
against a numerical model, SBEACH. The numerical model was found to implement dune
erosion within the empirical error of the ‘540 Rule’ (Payne, 2010).
Recently, Cross-Shore Numerical Model (CSHORE) has been of specific interest to update
several hazard mapping approaches, including the ‘540 Rule’. This year, Bradley Johnson
explored the capabilities of CSHORE to replace the ‘540 Rule’ as a FEMA guideline for
storm-induced beach change on the Great Lakes shores (Johnson, 2012). This analysis
generally found that the FEMA method computed larger erosion volumes than CSHORE.
Jeffrey Melby used several data sets and methodologies to test the accuracy of runup
calculations for flood mapping (Melby, Wave Runup Prediction for Flood Hazard
stability of CSHORE make it ideal for running the numerous transects needed for FIS
reports. CSHORE is currently recommended for modeling nearshore wave transformation in
the surf zone, wave runup, and wave setup in the FEMA Great Lakes Coastal Guidelines
(2012).
1.4 CROSS-SHORE NUMERICAL MODEL 1.4.1 CSHOREMODEL DEVELOPMENT
CSHORE is a one dimensional model that predicts the cross-shore hydrodynamic, sediment
transport, and morphology of a beach profile (Figlus, Kobayashi, Gralher, & Iranzo, 2010).
CSHORE development began in 1998, to estimate the transformation of irregular non-linear
waves (Johnson, Kobayashi, & Gravens, 2012). These cross-shore dynamics were created
using time-averaged continuity, momentum, and wave energy equations. This has since been
updated to utilize linear wave theory, using a Gaussian probability distribution of the free
surface elevation.
The model began improvement to include settings for porous beach profiles and porous
coastal structures. A permeable version of CSHORE was developed. At the same time, the
impermeable version of CSHORE was upgraded to contain cross-shore suspended sand
transport and bed load transport on beaches, including wave roller effects (Kobayashi, Payo,
& Schmied, 2008). Longshore current and transport rates were also incorporated into this
model (Johnson, Kobayashi, & Gravens, 2012).
The current CSHORE model is a merged version of the impermeable and permeable models
ability to predict dune scarp above the SWFL (Payo, Kobayashi, Perez, & Yamada, 2008).
Furthermore, wave runup and overtopping of levee’s and inclined structures has become a
priority to CSHORE development (Farhadzadeh, Kobayashi, & Melby, 2008) (Kobayashi,
Farhadzadeh, Melby, Johnson, & Gravens, 2010). Research has expanded to model
overtopping of sand dunes, recognizing that beach change and overwash prediction is
necessary for flood risk assessment (Figlus, Kobayashi, Gralher, & Iranzo, 2011). These
improvements to CSHORE involved the addition of a wet and dry impermeable model, based
on a probability of wetness (Figlus, Kobayashi, Gralher, & Iranzo, 2010). Where the original
wet model of CSHORE was responsible for computations from the offshore boundary to the
intersection of the mean water level with the profile, the wet and dry model added
computations starting from the intersection of the stillwater level with the profile to the
landward limit of the computation domain. Overlapping areas of the wet model with the wet
and dry model are averaged. Latest updates to CSHORE include a permeable wet and dry
model, as well as modifications for stone to test rubble mound structures (Johnson,
Kobayashi, & Gravens, 2012).
1.4.2 CSHOREMODEL CALIBRATION
During the above stages of CSHORE development, the model has been calibrated and
verified using about 20 large and small scale laboratory data sets (Johnson, 2012). The
model has also been tested using field beach and storm conditions. One such test utilized
surveys taken by the U.S. Army Corps of Engineers Field Research Facility (USACE, FRF)
Kobayashi, & Johnson, 2008). This research found that CSHORE had a poor capability to
predict profile change in the field at that time. CSHORE has also been recently tested and
calibrated using the same field cases that were utilized to validate SBEACH (Johnson,
Kobayashi, & Gravens, 2012). These data sets were used to obtain a set of calibrated
sediment transport parameters for the Atlantic and Pacific coasts. Validation testing at nine
sites for eight storms show satisfactory estimates of storm induced beach erosion, although
results show that improvements are still needed.
1.4.3 CSHOREMODEL CAPABILITIES
CSHORE finds both advantage and disadvantage with its time-averaged modeling
capabilities. A time-averaged model gives the advantages of stability and a fast run time:
about 10-5 of the modeled time duration (Johnson, 2012). This would be beneficial for
computing a large quantity of flood mapping transects in a relatively short amount of time.
One drawback of a time-averaged model is that it does not transform each wave in the
spectrum, so it could miss wave behavior in some cases (Melby, Wave runup prediction for
flood hazard assessment, 2012).
Another disadvantage to CSHORE is the fact that it is a relatively new model: improvements
are still needed and updates are frequent. As this occurs, the CSHORE User’s Manual
becomes outdated. Currently several new input parameters are not listed in the manual
(Kobayashi, 2009).
Specifically, the upper dune erosion portion of CSHORE still needs enhancement. Research
evolution in the wet/dry zone (Johnson, Kobayashi, & Gravens, 2012). Also, the overtopping
capabilities of the CSHORE model must be activated only if the dune crest of the profile is
expected to be overtopped (Kobayashi, 2009). This poses a problem for predicting erosion in
the field, as the vulnerability of a profile to overtopping is not calculated by the model itself.
Nevertheless, CSHORE creators claim accurate and efficient modeling of nearshore beach
evolution (Johnson, 2012).
1.5 RESEARCH OBJECTIVE
Interest in CSHORE as a computational approach for updating FEMA’s dune erosion
guidelines has motivated this research to create a comparison of the two aforementioned
profile morphology techniques. The objective of this research was to evaluate both the
Hallermeier and Rhodes methodology and the CSHORE model as predictors of A) dune
removal, and of B) beach and dune erosion above the SWFL of the storm event. The
availability of storm hydrographs and multitemporal topographic data provided the
opportunity to study storm-induced dune erosion for specific events that affected Pea Island
and compare results to a longstanding methodology and a relatively new numerical model.
To address this objective, pre and post-storm profiles were extracted from topographic data
for evenly spaced parallel transects along the study site. A methodology was constructed to
determine the retreat or removal of the dune, using pre and post-storm profiles. The retreat
or removal of field results was then compared to retreat and removal predictions from both
Pre and post-storm profiles were also used to calculate the area loss above the SWFL
between the two time periods. After calculating beach and dune area loss, the results were
compared to Hallermeier and Rhodes’ erosion prediction equation, which can be used as a
simple quantitative erosion analysis for a variety return periods (1988). With pre-storm
conditions as input profiles, the numerical model, CSHORE, was used to predict profile
morphology. Beach and dune area loss from CSHORE was then compared to field results.
Median values of retreat case erosion for both CSHORE and field results were also compared
CHAPTER2:STUDY SITE AND STORM DETAILS
2.1 STUDY SITE LOCATION
The Pea Island National Wildlife Refuge offers a convenient site for dune erosion research
due to its relatively undeveloped nature, the availability of pre and post-storm topographic
data, the documented geospatial research at this site, and the proximity of storm gauge data
from the FRF in Duck, NC. Pea Island is located on the northern 13 mile extent of Hatteras
Island, between Oregon Inlet and Mirlo Beach (U.S. Fish & Wildlife Service, 2012). This
refuge consists of ocean beach, dunes, fresh and brackish water ponds, and salt marsh.
Highway NC 12 runs approximately shore-parallel through Pea Island, with a few public
access parking lots, and one paved turn off to access three Fish and Wildlife buildings.
The study site used for this research begins at the southern-most man-made pond and extends
about 2 kilometers south to include both the Fish and Wildlife buildings, and the relatively
new inlet formed by Hurricane Irene. Figure 4A shows a location map of relevant sites along
2.2 E Previ evolu multi Mitas Pea I
EXISTING P ious lidar-ba
ution due to t
itemporal lid
sova et al. (2
sland betwe
Figure 4: A) B)
PEA ISLAND ased research
the impact o
dar to study m
2009) (2010)
en 1996 and
Location map Location map
RESEARCH h of Pea Islan
of storms. O
morphologic
) used geosp
d 2008. Add
of relevant sit of study site on
H
nd has docum
Overton et al.
cal change o
patial tools to
ditionally, Cl
tes on the NC O n Pea Island, N
mented volu
. (2006) and
n Pea Island
o analyze be
linch et al. (2
Outer Banks. NC.
ume change a
Jin (2010),
d due to Hurr
ach and dun
2012) used l
and shorelin
used
ricane Isabe
ne dynamics
lidar data and ne
l.
on
orthoimagery to analyze storm-induced change between the dates of all three storm event
cases used in this research.
2.3 STORMS
Given the availability of topographic data, the following five storms were selected to test
dune erosion on Pea Island: Hurricane Isabel, the October 2008 Storm, the October 2009
Storm, Nor’Ida, and Hurricane Irene (U.S. Army Corps of Engineers, 2012). Table 1 shows
a summary of the storm conditions associated with each storm. The October 2008 and
October 2009 Storms had a lower peak water elevation, maximum wave height, and duration
compared to Nor’Ida. As these three storms had occurred between the same pre and post
lidar data sets, they potentially had a cumulative effect on beach and dune erosion during this
time period. The three storms, of October 2008, October 2009, and Nor’Ida will be
referenced as the Three Event Case subsequently throughout this research. All five storms
Table 1: Summary of storm conditions from FRF in Duck, NC. Major Storm Events Dates Duration (hrs) Max Hmo (m) Peak Water Elevation (m) Max Gust (mph) Max Sustained Wind (mph) Hurricane Isabel
17‐20
Sept 2003 92 8.12 1.753 92 79 October 2008
Storm
19‐21
Oct 2008 59 3.67 1.185 49.7 40.7 October 2009
Storm
16‐19
Oct 2009 82 2.58 1.262 40.3 33.1 Nor'Ida 11‐15
Nov 2009 106 5.15 1.360 49.7 36.1 Hurricane
Irene ‐ Ocean 26‐28
Aug 2011
31 6.70 0.924 84.1 72.9 Hurricane
Irene ‐ Sound ‐ ‐ 1.900 ‐ 51.5
2.3.1 HURRICANE ISABEL
On September 18th, 2003, at about 12:00 PM EST, Hurricane Isabel was centered near
Ocracoke, Outer Banks (Gencarelli, Tomasicchio, Kobayashi, & Johnson, 2008). During
Hurricane Isabel, the FRF recorded the largest waves in their 27 year history, with a peak
wave height of 8.1 meters at Wave Gauge 630 located in 17.4 meters depth (2012). NOAA
tide station 8651370 at FRF in Duck, NC recorded a peak surge of 1.75 meters (NAVD88)
(National Oceanic and Atmospheric Administration, 2012). This peak water level was
The t
5. As
result Hurri can b 2012 Overt post s befor
track of Hurr
s seen from
ted in relativ
icane Isabel
be observed f
). Within th
ton et al. ana
storm lidar d
re and after t
ricane Isabel
this figure, H
vely onshore
caused exten
from lidar da
he U.S. Fish
alyzed shore
data and orth
the effects of
Figure 5: Hu
l in relation
Hurricane Is
e wind and w
nsive dune a
ata gathered
and Wildlife
eline migrati
hophotos (20
f Isabel at th
urricane Isabel
to the locati
sabel was loc
wave activity
and beach er
before and
e Pea Island
on and dune
006). Figure
he study site.
l storm track
on of the stu
cated south o
y at the arriva
rosion along
after the eve
National W
e degradation
e 6 shows the
. Arrows in
udy site can b
of the study
al of the stor
the NC Out
ent (U.S. Ge
Wildlife Refug
n from Isabe
e NCDOT o
the post-sto
be seen in F
site, which
rm event.
ter Banks, w
ological Sur
ge (PINWR)
el, using pre
show several overwash fans to the north and south of the Fish and Wildlife facility, including
overwash in the most northern areas of the study site which extended landward to Highway
Figure 6: Orthho photos of stu NCOn
udy site before neMap, 2003 im
and after Hurr magery obtaine
ricane Isabel. ed from the NC
2002 imagery CDOT.
2.3.2 THE OCTOBER 2008STORM
The October 2008 Storm was considered in this research because its peak water elevation
(1.18 meters, NAVD88) recorded at FRF equates to the 5 year storm elevation for the Pea
Island study site. This return period calculation will be further explained in the Hallermeier
and Rhodes methodology (Section 4.2.2). This storm occurred after the date of the 2008
pre-storm lidar data used for this research, affecting the Outer Banks between the 19th and 21st of
October according to water level and wave records from FRF (U.S. Army Corps of
Engineers, 2012). The NOAA National Climatic Data Center (NCDC) describes the October
2008 Storm as a strong low pressure system, which developed offshore of the North Carolina
coast and created some overwash sites on the Outer Banks (National Oceanic and
Atmospheric Administration, 2012). The NCDC also reports that the oceanside wave effects
caused an abandoned house to collapse near Rodanthe around 11 AM EST on October 19th.
Around this time, portions of Highway NC 12 were closed in the Rodanthe area due to
overwash conditions. Figure 7 below shows NCDOT orthoimagery of the study site before
and after the effects of the October 2008 Storm. The arrow in the post-storm orthophoto
shows a pre-existing overwash site that slightly increased in size. This is particularly evident
2.3.3 THE OCTOBER 2009STORM
Like the previous October Storm of 2008, the October 2009 Storm was considered in this
research because its 1.26 meter (NAVD88) water elevation coincides with a 6.8 yr storm
water elevation for the Pea Island study site and falls within the temporal boundaries of the
pre and post lidar data used. This storm event created significant wave and surge activity
between the 16th and 19th of October, according to FRF records (U.S. Army Corps of
Engineers, 2012). The NCDC identifies this event as a nor’easter in which a low pressure
system offshore of North Carolina and a high pressure system to the north created north to
northeast winds (National Oceanic and Atmospheric Administration, 2012). Overwash areas
were reported along Highway NC 12 near Rodanthe and Mirlo Beach. NC 12 was also
closed around 7 AM EST due to high tide overwash conditions on October 17th.
2.3.4 NOR’IDA
Nor’Ida, also known as the ‘Veteran’s Day Storm’, originated from the combined effects of
Tropical Storm Ida and a nor’easter in the mid-Atlantic (U.S. Army Corps of Engineers,
2012). Tropical Storm Ida made landfall on November 10, 2009 on Dauphin Island,
Alabama (U.S. Geological Survey, 2012). This low pressure system redeveloped south of
Cape Hatteras and intensified (U.S. Army Corps of Engineers, 2012). After colliding with
the high pressure nor’easter offshore, the waves and surge from the resulting strong northeast
winds impacted the Outer Banks from November 11-14th (U.S. Army Corps of Engineers,
FRF recorded a peak wave height of 5.15 meters at Wave Gauge 630 and a peak water
elevation of 1.37 meters (NAVD88) (U.S. Army Corps of Engineers, 2012). Although the
surge and wave activity is of a smaller magnitude than that of Hurricane Isabel, the duration
of Nor’Ida was longer. Nor’Ida consisted of three high tides with almost 1 meter of storm
surge and nearly 90 hours of waves over 2 meters in Duck, NC (U.S. Army Corps of
Engineers, 2012).
Significant erosion and dune degradation occurred along beaches from the Outer Banks of
North Carolina to Long Island, New York (U.S. Geological Survey, 2012). Figure 8 below
shows the orthoimagery of the study site before and after the combined effects of both
Nor’Ida, and the October 2009 storm. Arrows in the post-storm orthophoto show one
overwash region reaching NC 12 along the northern portion of the study site, and significant
dune degradation located north and south of the Fish and Wildlife facility. Note that the
overwash fan located directly to the north of the Fish and Wildlife buildings is in the location
2.3.5 HURRICANE IRENE
On August 24, 2011, at about 6:30 AM EST, Hurricane Irene made landfall east of Cape
Lookout (Fanelli & Fanelli, 2011). Figure 9 shows the track of Hurricane Irene in relation to
the location of the study site. The storm track landward of the NC Outer Banks caused a
unique wind tide in the Pamlico Sound (Clinch, Russ, Oliver, Mitasova, & Overton, 2012).
As Irene made landfall near Cape Lookout, the counterclockwise rotation of the storm system
caused high tide levels to inundate the inland coastal plain of North Carolina. Subsequently,
extremely low water levels were witnessed on the sound side of the Outer Banks at this time.
As the eye proceeded north of these inundated sites, the wind switched to a seaward
direction, creating high water levels along the soundside of the Outer Banks. The soundside
surge associated with Irene was 1.9 meters (NAVD88) at FRF, the highest sound water level
recorded since FRF began observations in 1979 (U.S. Army Corps of Engineers, 2011). The
oceanside surge recorded at FRF peaked at 0.92 meters (NAVD88). Although there was a
high impact of erosion to Pea Island from Hurricane Irene, the peak water elevation from
Figur from the F show way o ocean
re 10 below
the NCDOT
ish and Wild
wn in Figure 7
of the road, w
nside overwa
shows ortho
T. The two c
dlife facility
7 and Figure
whereas the
ash evidence
Figure 9: Hu
oimagery bef
channels of t
, where over
e 8. The sou
northern ch
e has been id
urricane Irene
fore and afte
the breach c
rwash was d
uthern chann
annel of this
dentified from
storm track.
er the effects
an be seen d
documented f
nel has been
s breach curr
m Figure 10
s of Hurrican
directly north
from previou
repaired wit
rently remain
0.
ne Irene, obt
h and south o
us events, as
thin the right
ns an inlet. ained
of
s
CHAPTER3:METHODOLOGY
3.1 WORKFLOW
The following chapter describes the data collected for analyzing field erosion and estimating
results using the two procedures: the Hallermeier and Rhodes dune erosion methodology, and
the CSHORE model. These data include pre and post-storm data acquisition, profile
screening, dune reservoir selection, dune toe identification, wave and water level
hydrographs, model parameters, and the designation of dune retreat and removal. Figure 11
below illustrates the workflow of profile selection and processing after profile data was
extracted from Digital Elevation Models (DEMs). Figure 12 shows the workflow of the
Hallermeier and Rhodes analysis used for this research, the methodology of which is
explained in Section 3.4. Figure 13 shows the workflow of the CSHORE model analysis
which is outlined in Section 3.5. Figure 14 gives the workflow diagram used for the field
erosion analysis. As each result was used for comparison between two or more analyses, the
outputs of each workflow were color coordinated and include figure numbers to each results
3.2 3.2.1 The f resea coord Table TEMPORAL DATA AC following se
arch. All dat
dinate system
e 2 shows a s
Figu
L ELEVATIO CQUISITION
ction explain
ta was forma
m with North
summary of
ure 14: Field d
N DATA
ns the lidar,
atted in the N
h American V
f the point da
dune analysis w
photogramm
NC State Pla
Vertical Dat
ata used for t
workflow diagr
metry, and ba
ane North Am
tum 1988 (N
this research ram. athymetry d merican Datu NAVD88), in h.
ata used for
um 1983
n units of me this
Pre and post-storm data for Hurricane Isabel was collected on September 18th and September
21st of 2003, by the National Aeronautics and Space Administration (NASA)/U.S. Geological
Survey (USGS) Experimental Advanced Airborne Research Lidar (EAARL) system
(Overton, Mitasova, Recalde, & Vanderbeke, 2006). This lidar data has a point density of 1
point per 3 meters, with a RMS vertical accuracy of 15 centimeters and a horizontal accuracy
less than 2 meters (Mitasova, Overton, Recalde, Bernstein, & Freeman, 2009).
Pre-storm data for the Three Event Case was collected in March 2008 by the NOAA
Integrated Ocean and Coastal Mapping (IOCM). This lidar data has an average point density
of 3.5 points per 2 meters, a RMS accuracy of 15 centimeters and a horizontal accuracy of 1
meter (Mitasova, Hardin, Overton, & Kurum, 2010) (National Oceanic and Atmospheric
Administration, Coastal Services Center, 2012). Post-storm data for the Three Event Case
was collected in December 2009 as a NASA/USGS EAARL survey. The RMS vertical
accuracy is 15 centimeters and the horizontal accuracy of 1 meter. Because the 2008 point
data included all lidar returns without filtering or classification, the point cloud was filtered
using an open-source lidar processing toolbox, LAStools, before being smoothed to a surface
(Isenburg, 2011). The 2009 data set was already filtered to a bare earth by the collaborative
efforts of NASA/USGS.
Pre and post-storm data for Hurricane Irene was collected on August 2nd and August 28th of
2011 by the North Carolina Department of Transportation (NCDOT) Photogrammetry Unit.
The NCDOT Photogrammetry Unit estimates the vertical and horizontal accuracy of this data
The bathymetric data used for this research was collected on July 2004 by the USACE
National Coastal Mapping Program Joint Airborne Lidar Bathymetry Technical Center of
Expertise (JALBTCX) (National Oceanic and Atmospheric Administration, Coastal Services
Center, 2012). This data included both hydrographic and topographic data, and has a RMS
vertical accuracy of 15 centimeters. The horizontal accuracy of this data was not tested, but
was compiled to meet 0.8 meters of accuracy.
Table 2: Summary of lidar, hydrographic, and photogrammetric surveys.
Agency, System Dates
Published Point Density
Published Vertical and Horizontal Accuracy (m) NASA/USGS, EAARL 9/18/2003 0.8 pt / 2m 0.15 / 2.0
NASA/USGS, EAARL 9/21/2003 0.8 pt / 2m 0.15 / 2.0
USACE, JALBTCX 7/2004 1 pt / 0.3m 0.15 / NA
NOAA, IOCM 3/2008 3.5 pt / 2m 0.15/ 2.0
NASA/USGS, EAARL 12/2009 1 pt / 2‐3m 0.15/ 1.0
NCDOT Photogrammetry 8/2/2011 NA 0.15/0.15
NCDOT Photogrammetry 8/28/2011 NA 0.15/0.15
3.2.2 COMPUTING DIGITAL ELEVATION MODELS
The data sets shown in Table 2 were processed using open-source Geographic Resources
Analysis Support System (GRASS) to create DEMs of the study site (Neteler & Mitasova,
2008). Each DEM was created using a workflow incorporated by Mitasova et al. (2009)
(2010) , which involved analyzing the point cloud data, removing any systematic errors, and
concurrently smoothing noise while interpolating a DEM (Starek, et al., 2011). The
resolution for each DEM was chosen to be 0.5 meters according to Mitasova el al. (2010). In
and 3/2008), the 0.5 meter resolution was chosen by increasing resolutions until the
within-cell point-elevation ranges were smaller than the published vertical accuracy of the lidar data
sets. This research assumed that the 0.5 meter resolution tested for the four lidar data sets is
also a sufficient resolution to be used for the three additional data sets in Table 2. The
interpolation and smoothing of the surface was conducted using a regularized spline with
tension (RST). All DEMs were created by the author with exception of the 2009 DEM,
which was provided by Starek et al. and created using the same methodology (2011).
The digital terrain elevations created by the NCDOT were utilized for road construction
projects. Therefore, all points were assumed to be ground points that had been corrected to
match the benchmarks along the centerline of Highway NC 12. As a result, the pre and
post-Irene data was interpolated and smoothed to a DEM without any vertical rectification. All
lidar-derived DEMs however, were rectified to match the elevation of the NCDOT centerline
control points provided by the Outer Banks Task Force (2012). Figure 15 shows the control
points used to rectify the DEM’s. For each data set, some of these control points were
omitted from rectification, as they were situated outside of the range of point cloud data, or
post-storm orthoimagery showed that they were located at an overwash site. Of the control
points used, the average difference between the control point centerline elevations and the
DEM at that location was employed to correct the elevation of the DEM.
3.2.3 PROFILE EXTRACTION
After the construction of rectified DEM’s for each pre and post-storm event, 45 vector
created to be orthogonal to the shoreline and duplicated every 50 meters along the extent of
the study site so that all profiles were equidistant and parallel to each other. The most
northern transect was labeled as Transect 1, and subsequent transects increase in number to
the final, southern-most transect, labeled Transect 45. These transects are shown in Figure
15, with every fifth transect labeled. All transects were draped over each DEM to create
elevation profiles before and after each storm event. The elevations were extracted at 0.5
3.2.4 SCREENING TRANSECTS
After profile extraction, transects were inspected to assure that they met the assumptions of
both profile morphology techniques: the FEMA dune erosion guideline and the CSHORE
model assume longshore uniformity. Therefore, each profile was screened to eliminate cases
that could contribute distorted erosion values to this research. A 3D tool in GRASS GIS was
implemented to visualize the study site topography overlaid with the coloration of the
corresponding orthophoto. This enabled the user to identify both elevation and land cover
differences on either side of each transect. The pre and post-storm DEM was evaluated in
3D near each transect, to identify any longshore irregularities. Additionally, pre and
post-storm profile plots were inspected for abnormal erosion qualities, such as a loss of area to the
heelside dune or an increase in area to the frontal dune. After inspection of each transect,
any cases with one of the following qualities were assumed to be a poor example for the
study of oceanside, cross-shore dune erosion processes and were disregarded from this
research:
A) Pre-storm degraded dune geometry a with dune crest elevation below 4 m,
NAVD88.
B) Increase in area to the primary frontal dune, from pre and post-storm profile
comparison.
C) Proximity (within 5 meters) of dune transect to man-made structures.
E) Post-storm missing area from the landward portion of the primary frontal dune
area, causing uncertainty of the oceanside contribution to erosion.
Table 3 shows the results for the visual transect inspection conducted for each of the three
events. The lettered cases labeled in this table correspond to the qualities listed above. Any
transects highlighted in grey were and were utilized for this study. As shown below, 35, 27,
and 18 transects were used to represent the erosion effects of Hurricane Isabel, the Three
Event Case, and Hurricane Irene.
Table 3: Screened transects, with grey transects selected for research.
Storm Event Storm Event
Transect Isabel 3 Event Irene Transect Isabel 3 Event Irene 1 Case B Case E 24 Case A 2 Case D Case A Case E 25 3 Case B Case E 26 Case A 4 Case B Case E 27 Case B
5 Case B 28 Case E
6 29
7 Case E 30 Case E
8 31 Case D Case D Case E 9 Case D Case D Case D 32 Case D Case B Case E 10 Case D Case E 33 Case D
11 Case D Case E 34
12 Case E 35
13 Case C Case C Case E 36 14 Case C Case C Case E 37
15 Case A Case E 38
16 Case A Case E 39
17 Case A Case E 40
18 Case D Case E 41
19 Case E 42
20 Case A Case E 43 Case D
21 Case D Case E 44
Figur show visua thus t 3.3 After chara retrea cases meas above
re 16 illustra
ws Transect 9
alization indi
this transect
Figur
FIELD DUN r screening tr
acteristics ne
at/removal p
s for the anal
urements. F
e requiremen
ates the 3D v
9 overlaid on
icated that th
was omitted
e 16: 3D imag
NE ANALYSI ransects, eac
eeded to, A)
predictions o
lysis of medi
For each scre
nts:
visualization
n the pre-stor
here was a vi
d from resear
gery of transect
IS
ch profile wa
compare the
f both profil
ian retreat ca
eened transe
used to scre
rm DEM of
isible longsh
rch.
t compromised
as analyzed t
e dune retrea
le morpholog
ase erosion v
ct, three dun
een profiles.
the Hurrican
hore slope of
d by lack of lon
to determine
at/removal fi
gy technique
values, and C
ne features w
This particu
ne Irene even
f the dunefac
ng-shore unifor
e the specific
ield response
es, B) identif
C) delineate
were gathered
ular exampl
nt. The
ce of Transe
rmity.
c dune
e to the
fy field retre
erosion
d to satisfy t e
ect 9,
eat
A) The landward limit of the dune reservoir.
B) The elevation of the dune toe.
C) The dune retreat or dune removal designation, quantified from field analysis.
The methodology for determining each of these three features is explained in the following
subsections.
3.3.1 DETERMINATION OF THE RESERVOIR LANDWARD LIMIT
The first feature, the reservoir landward limit, was used to delineate the area of the primary
frontal dune reservoir for the application the Hallermeier and Rhodes methodology. For
most profiles in this research, Figure 2 was used as a guideline for dune reservoir selection:
the location of the peak was selected as the landward limit for ridge-type profiles, and the
peak location seaward of the steep rear slope was selected as the landward limit for
mound-type dune geometries. Some complexly shaped dunes caused the reservoir landward limit to
be more difficult to delineate. Research has shown that once dune erosion extends to the rear
dune slope of a profile, complete removal of the dune is expected to occur at an accelerated
rate (Dewberry & Davis, 1989). Hallermeier and Rhodes suggested that the mapping partner
select the sand reservoir that would be most likely to resist this type of dune failure (1988).
Current FEMA guidelines for mapping partners also reflect this recommendation, but a
specific methodology for establishing a dune reservoir is not supplied by FEMA or
the area of the dune reservoir, as recommended by Hallermeier and Rhodes (Dewberry &
Davis, 1989).
To account for the diverse dune geometries that compose the study site, a methodology was
constructed to satisfy the typical conditions illustrated in Figure 2 and also provide a standard
for complex dunes with questionable reservoir landward limit locations. This methodology
was established by comparing dune peak heights and dune widths for different time periods
along the study site, in both plots and 3D visualizations. One such dune visualization is
shown in Figure 17, using the elevation from the 2003 pre-Isabel DEM (magnified by 1.5)
and the coloration is from the 2002 NCOneMap orthophoto. The size of these dunes can be
compared to the pavement width of NC 12, which is approximately 10 meters wide. This
example shows that there are two separate dune ridge lines in the southern portion of the
study site that converge near Transect 33. The Hallermeier and Rhodes methodology is
designed to account for erosion of the primary dune by delineating the frontal dune reservoir;
therefore, a dune reservoir that extended to the secondary dune would be considered
erroneous for this research. Comparing Figure 17 to plots of each pre-storm profile showed
that the maximum width of the top of primary dune mounds is approximately 11 meters.
This site characteristic was incorporated as an assumption into the landward reservoir limit
methodology to ensure that no secondary dune was incorporated into the primary frontal
dune reservoir. Additionally, dunes with multiple peaks were scrutinized to determine if the
reservoir should extend to the maximum peak, the most seaward peak, or the most landward
The f each satisf each F following me pre-storm pr
fy the condit
transect was
Figure 17: 3D I
ethodology f
rofile and is
tions of aver
s included in
Imagery of sou
for the selec
show in Fig
age ridge an
n the individu
uthern region o
tion of the re
gure 18 below
nd mound-typ
ual plots of A
of study site, de
eservoir land
w. This met
pe dunes. T
Appendix A
epicting a land
dward limit
thodology w
The frontal du
A.
dward secondar
was used on
was found to
une reservoi
ry dune system n
ir for
3.3.2 As ill guide this r also u Fi
2 DUNE TO lustrated in F
elines to alte
research to d
used to delin
igure 18: Meth
OE SELECTIO Figure 3, the
er all dune re
determine the
neate the Dun
hodology for se
ON
e location of
emoval cases
e retreat or re
ne Toe Eros
election of the
f the dune toe
s. Likewise,
emoval statu
ion measure
dune reservoir
e was used in
, the location
us of each tra
ement shown
r landward limi
n Hallermei
n of the dune
ansect. This
n in Section it.
er and Rhod
e toe was use
s elevation w
3.6.1.2.
des’
ed in