CARLTON, TROY ALAN. Examining the Interrelationships of Partnerships, the Built Environment and Leisure Time Physical Activity in Rural Public Schools. (Under the direction of Dr. Michael Kanters).
Having access to recreational spaces and facilities has been positively associated with higher physical activity (PA) rates. Governmental agencies have identified shared use agreements (SUAs) as a potential combatant for the continued physical inactivity epidemic. Although the sharing of public school facilities can provide opportunities for PA, limited information exists into the environmental and policy contexts of SUAs within school environments and how active people are when given access to these facilities. The purpose of this study is to investigate the effect of public school level SUAs of facilities during non-school hours on the amount and type of leisure time physical activity (LTPA) of outside community members and programs in rural North Carolina communities. In addition, this study seeks to quantify the association that facility quality has on LTPA. A mixed
by
Troy Alan Carlton
A thesis submitted to the Graduate Faculty of North Carolina State University
in partial fulfillment of the requirements for the degree of
Master of Science
Parks, Recreation and Tourism Management
Raleigh, North Carolina 2015
APPROVED BY:
_______________________________ _______________________________
Dr. Michael A. Kanters Dr. Jason N. Bocarro
Committee Chair
_______________________________ _______________________________
DEDICATION
BIOGRAPHY
ACKNOWLEDGMENTS
I would like to thank my advisor, Michael Kanters, for helping me navigate the treacherous waters of thesis writing. Dr. Kanters always had a trust and belief in me that I never understood. As members of my committee, Dr. Jason Bocarro, Dr. Michael Edwards, and Dr. Myron Floyd also played a profound role in providing support, guidance and
direction for me to complete my thesis research.
None of this would be possible without the support of the North Carolina Community Transformation Program (CTG) and its staff members. A special thanks goes specifically to Sharon Nelson and Jill Rushing.
My good friend, Dr. Luis Suau invested his valuable spare time providing advice whenever I needed it and made himself available whenever I had a question or concern. His skills, experience and expertise in data management is one of the primary reasons why this study was such a success. Luis consistently checked in with me, offering advice on next steps in the writing process. He contributed so much without ever asking for anything in return. He is one of the most humble men I know.
I would like to also recognize Dr. Thom McKenzie of San Diego State University for assisting me in the understanding of systematic observation protocols and the extensive training of data collectors. Also, a big thank you to Joào David from the University of Porto, Portugal for spearheading the iOS development of iSOPARC.
Lastly, a huge THANK YOU to the community members who practically
TABLE OF CONTENTS
LIST OF TABLES ... viii
LIST OF FIGURES ... ix
CHAPTER ONE: INTRODUCTION ... 1
Statement of the Problem ... 12
Significance of the Study... 13
Research Questions ... 16
Delimitations ... 17
Definition of Terms ... 17
CHAPTER TWO: LITERATURE REVIEW ... 20
The Foundation and Application of the Social Ecological Model ... 20
Policy Approaches in Health Promotion ... 25
School-based Policies for Physical Activity ... 31
Measures ... 39
CHAPTER THREE: METHODS ... 47
Sampling ... 47
Instruments ... 51
Structured Physical Activity Survey ... 51
System for Observing Play and Recreation in Communities... 52
Physical Activity Resource Assessment ... 52
Observer training and reliability ... 53
Data Collection Procedures ... 55
Analysis ... 59
Shared use ratio... 59
Shared use programs. ... 60
Facility quality. ... 60
PA dependent variables of interest. ... 61
Bivariate correlations. ... 62
Multiple linear regression. ... 62
CHAPTER FOUR: RESULTS ... 63
Descriptive Statistics ... 63
SOPARC ... 63
S-PARA ... 70
Bivariate Correlations... 72
Linear regression ... 77
CHAPTER FIVE: DISCUSSION ... 82
The Role of Organized Programming ... 88
Facility Quality ... 91
Study Strengths and Limitations ... 93
Conclusion and Recommendations ... 97
REFERENCES ... 104
LIST OF TABLES
Table 1: Grade Level, Rurality, Socioeconomic Status (SES), and
Racial/Ethnic Characteristics of Study Schools ... 50
Table 2: Observation Schedule for Data Collectors Using iSOPARC ... 58
Table 3: Cohen’s Kappa Coefficients by Gender, Age, and Physical Activity Level ... 64
Table 4: Distribution of Facility Users by Gender ... 65
Table 5: Distribution of Facility Users by Age ... 66
Table 6: Participant Physical Activity Levels by Facility Category... 68
Table 7: Frequency of Empty Observations by Facility Category ... 69
Table 8: Average Persons and METs Per Observation by Facility Category ... 70
Table 9: Descriptive Statistics for Overall School Facility Quality Scores ... 72
Table 10: Descriptive Statistics for Calculated Shared Use Ratio, Shared Use Programs, and Dependent Variables by School ... 74
Table 11: Correlation Coefficients between Shared Use Ratio and Dependent Variables .. 75
Table 12: Correlation Coefficients between Shared Use Programming Sessions and Dependent Variables ... 75
Table 13: Summary of Regression Analysis for Facility Quality Variables Predicting Physical Activity ... 80
LIST OF FIGURES
Figure 1: Physical Inactivity Levels in the U.S. by Age ... 2
Figure 2: Ecological model of four domains of active living ... 23
Figure 3: Model showing strength of reach and permanence across ecological influences ... 25
Figure 4: Proposed linkages between policy, theoretical variables, and PA ... 27
Figure 5: Presumptive model of how policy movies from formulation to implementation and thereby influencing PA directly through the environment ... 28
Figure 6: Policy Areas to Support Physical Activity at School ... 32
Figure 7: Locations of Final 20 Sites Selected for On-site Data Collection ... 49
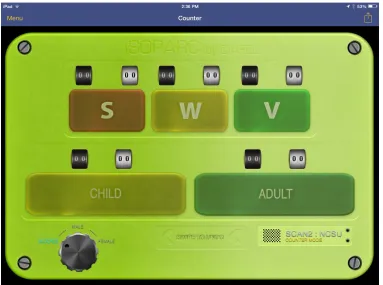
Figure 8: Screen Shot of iSOPARC Counter Tool ... 54
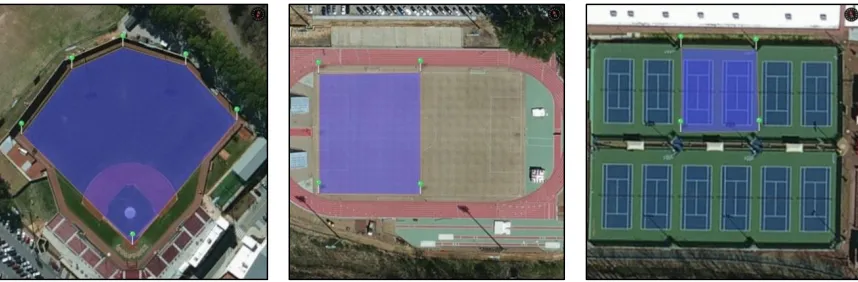
Figure 9: Examples of Mapped and Subdivided Target Areas in the iSOPARC App ... 57
Figure 10: Observed Physical Activity Levels of Facility Users by School ... 67
Figure 11: Bivariate Linear Correlation between Shared Use Programming Sessions and Participants ... 76
CHAPTER ONE: INTRODUCTION “An unused facility is a terrible thing to waste”
– Dr. Thomas McKenzie, Emeritus Professor at San Diego State University
Regular physical activity (PA) embodies healthy living and a higher quality of life (Haskell, Lee, Pate, et al., 2007; Institute of Medicine, 2013). Children and adults who meet the recommended levels of PA receive an array of physical, mental, social, and emotional health benefits while reducing the risk of cardiovascular disease, Type II diabetes, and
premature mortality (Beighle, Beets, Erwin & Moore, 2010; Kahn, Ramsey, Brownson, et al., 2010; The North Carolina Institute of Medicine, 2011; U.S. Department of Health & Human Services, 2009; 2011). Despite the many benefits of PA, a significant proportion of people in the United States spend a majority of their time engaging in sedentary behaviors with little or no moderate-to-vigorous physical activity (MVPA) performed on a regular basis (Ogden, Carroll, Kit, & Flegal, 2014; Troiano, Berrigan, Dodd, Masse, Tilert & McDowell, 2008).
Americans are not engaging in sufficient amounts of PA, especially in rural, low-income and minority communities (Floyd, Bocarro, Smith, Baran, Moore, Cosco & Fant, 2011; McAlexander, Banda, McAlexander, & Lee, 2009; Powell, Slater, Chaloupka, & Harper, 2006; Diez Roux, Evenson, McGinn, Brown, Moore, Brines & Jacobs, 2007). Eighty percent of American adults do not meet the aerobic and muscle strengthening recommendations for PA (Centers for Disease Control and Prevention (CDC), 2014). Additionally, according to the Healthy People 2020 report by the U.S. Department of Health & Human Services (2008), nearly 30 percent of U.S. adults do not engage in any leisure-time physical activity (LTPA).
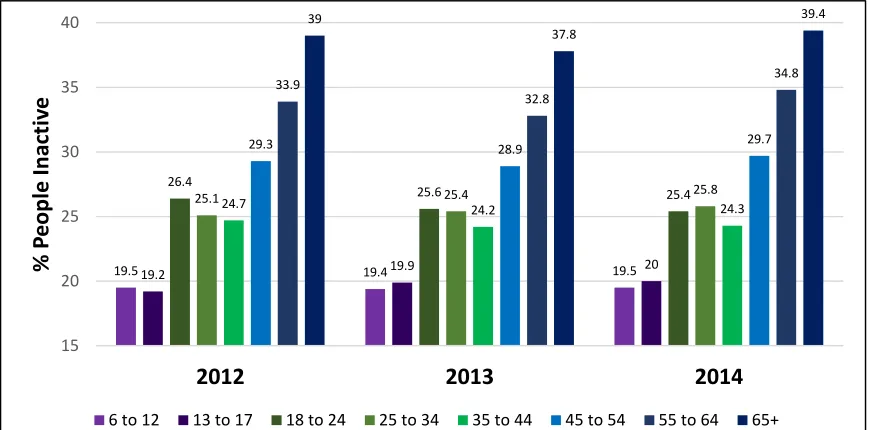
Figure 1: Physical Inactivity Levels in the U.S. by Age (Physical Activity Council, 2015)
The most recent report by the Physical Activity Council (2015) illustrates how
physical inactivity remains an urgent public health issue. As seen in Figure 1, the percentage of people who are physically inactive has risen marginally over the past three years and
19.519.2 19.419.9 19.5 20
26.4
25.6 25.4
25.124.7 25.4 25.8
24.2 24.3
29.3 28.9 29.7
33.9 32.8 34.8 39 37.8 39.4 15 20 25 30 35 40
2012 2013 2014
% P e op le In act iv e
progress for decreasing the physically inactive population remains stagnant. Indeed, the U.S. is experiencing the highest percentage of physically inactive people over the last six years. The physical inactivity crisis has led researchers and practitioners to seek innovative models and methods to inform strategies to increase LTPA. Also, several national and international organizations like the CDC (2011), American Heart Association (2011), World Health Association (2008), The Australian National Health and Medical Research Council, have recognized the issue of increased physical inactivity and have prioritized the need to find solutions to address this (Keener, Goodman, Lowry, Zaro, S., & Kettel Khan, 2009; Sacks et al., 2008; Young et al., 2013).
A complex web of genetic, behavioral, lifestyle, community structural, policy, and built environment factors contribute to high rates of physical inactivity. To address this complex and seemingly intractable issue, interventions that target key social, environmental, and policy levers that yield broad-based community health benefits are required. Ecological models offer the conceptual scope and strategic orientation needed to address various
physical inactivity influences among children, adolescents and adults (Giles-Corti & Donovan, 2002; Stokols, Grzywacz, McMahan & Phillips, 2003).
Under social ecological models, human behavior is posited to have multiple levels of influence (Fleury & Lee, 2006; Sallis, Bauman, & Pratt, 1998; Spence & Lee, 2003).
Various conceptualizations of the levels of influences on behavior have emerged, but most factors are generally categorized under one of five domains: (a) intrapersonal (e.g.,
access to resources) or (e) policy (e.g., local, state and national laws) (Fleury & Lee, 2006; Sallis et al., 2006; Sallis, Bauman, & Pratt, 1998; Spence & Lee, 2003). Because there are multiple levels of influences, behavioral change, such as encouraging more PA, is maximized when interventions under all five domains are combined (Brownson, Baker, Housemann, Brennan, & Bacak, 2001; Heath, Parra, Sarmiento et al., 2012; Sallis et al., 1998; Sallis, 2008). More recently, the Social Ecological Model (SEM) has adapted the general ecological framework to explain and change PA behavior and inform multi-level interventions, including those that address the policy and built environments (Bocarro, Kanters, Cerin, Floyd, Casper, Suau & McKenzie, 2012; Durant et al., 2009; Jones, Brener, McManus, 2003, McLeroy, Bibeau, Steckler & Glanz, 1988).
In light of the evidence showing the growing sedentary behavior in the U.S. population and the health consequences of not being physically active, stakeholders have been searching for ways to increase PA. Access to recreational spaces and facilities has been positively associated with higher LTPA, lower obesity rates, beneficial health outcomes and lifelong active living behaviors (Durant et al., 2009; Giles-Corti & Donovan, 2002; Kahn et al., 2010; Norman, Nutter, Ryan, Sallis, Calfas & Patrick, 2006). LTPA may be most
2006; Sallis et al., 2001). A recent study approximated that 50% of all vigorous PA
occurring in local public parks were attributed to residents living within a half mile radius of the park boundaries (Han, Cohen, & McKenzie, 2013). Moreover, Norman et al. (2006) concluded that access to recreation facilities is significantly associated with MVPA for adults and adolescents. Yet, the proportion of the population living within half of a mile of a public park is 39.2 percent in the U.S. and 13.5 percent in North Carolina. A majority of the
population lacks convenient access to public facilities conducive to PA, particularly in states such as North Carolina.
A key element in fostering an active lifestyle is an environment that facilitates
opportunities for PA, like that of local parks and schools (Spengler, Carroll, Connaughton, & Evenson, 2010). One of the challenges in increasing PA for communities is committing resources to construct activity-friendly environments such as school playgrounds, ball fields, parks, walking trails and other recreational facilities. Schools can play a similar role as that of public parks in providing available and accessible places for the facilitation of programs and people to be more physically active. School facilities are important in facilitating both children and adult PA but are only valuable when being used (Spengler, 2012). Despite public schools being conducive to LTPA, as many as 68% of designated sport and recreation areas have been found to be completely vacant during after school hours (Bocarro et al., 2012).
Community entities often seek use of public school facilities because of the unique advantages that these spaces provide. For instance, public schools have established
volumes of people (Keener et al., 2009). Having accessibility to schools during non-school hours through policy initiatives is growing in popularity among local government officials (Institute of Medicine, 2009). Access to school resources can be thought of as quick and easy solutions to positively influence LTPA behavior in that school facilities are often centrally located complete with gymnasiums, playgrounds, sports fields, tracks and
basketball courts and built using public funds. Furthermore, public middle and high schools are also readily available and safe environments for active play and recreation through after school programs and youth sport organizations (Bassett, Fitzhugh, Heath, Erwin, Frederick, Wolff, Welch & Stout, 2013; Coleman, Geller, Rosenkranz, & Dzewaltowski, 2008;
Dzewaltowski, Rosenkranz, Geller, Coleman, Welk, Hastmann & Milliken, 2010; Pate & O’Neill, 2009; Spengler, 2012).
a written agreement between a school district and a private organization setting the terms and conditions for sharing the school district’s facilities, costs and risks associated with opening the property for after-hours use (ChangeLab Solutions, 2010; Evenson, Wen, Lee, Heinrich, & Eyler, 2010). The terms of the SUA can be communicated in a formal, written contract or more informally agreed upon verbally, otherwise known as “handshake agreements”. As a form of public policy, SUAs are increasingly being explored and examined as a vehicle for driving active living initiatives. For instance, one of the 15 goals stated in the Healthy People 2020 report was to increase the percent of public schools that provide access to PA facilities outside of normal school hours by 10 percent (U.S. Department of Health & Human Services, 2008).
Regardless of the favorable arguments to opening school facilities to outside programs, a relatively recent report indicated that only 28.8% of the nation’s public and private schools provide access to their PA spaces and facilities for all persons outside of normal school hours (i.e., before and after the school day, on weekends, and during summer and other vacations) (U.S. Department of Health & Human Services, 2008). According to the Trust for America’s Health (2014), approximately 70% of school districts nationwide have no policy regarding the facilitation of SUAs. Thus, school PA facilities are a largely untapped community asset for PA.
is one of only 20 states that provide policy guidance for schools on SUAs (CDC, 2014). Nationally, nearly 60% of 988 surveyed schools made their PA facilities available for people after school and on weekends (Lee, Burgeson, Fulton, & Spain, 2007). Similarly, the 2012 School Health Policies and Practices Study reported that 61.6% of school districts have formal SUAs (Everett-Jones & Wendel, 2015). Given these studies, it is difficult to determine an accurate status of shared use with so many fluctuating reports.
Nonetheless, just the presence or absence of facilities may not be a valid way to investigate access to resources (Lee, Boothe, Reese-Smith, Regan, Howard, 2005; Sallis, Floyd, Rodriguez, & Saelens, 2012). In addition to policy interventions, the level of quality that public facilities has been hypothesized to be a major factor in influencing PA behavior (McKenzie, Moody, Carlson, Lopez, & Elder, 2013). According to Kent & Thompson (2014), built environmental supports such as facility quality can be modified to facilitate or constrain PA and have been shown to vary based on population groups (e.g., economically disadvantaged) and in diverse contexts (e.g., inner city, suburban, regional, and rural). So while the evidence for strong policy interventions is growing, to be effective, these should be supported with built environment interventions to maximize effectiveness (Kent &
Thompson et al., 2014).
Engler & Menachemi, 2012). Increasingly, studies have shown that PA can be dependent on the number and condition of facilities and amenities, perceived safety, and aesthetics (Cohen, Han, Derose, Williamson, Marsh, Rudick, & McKenzie, 2012a; Cohen et al., 2007; Cohen, Lapham, Evenson, Williamson, Golinelli, Ward, Hillier, & McKenzie, 2013; McCormack, Rock, Toohey, & Hignell, 2010). For example, Heinrich et al. (2008) found that
neighborhoods with more amenities, higher-quality PA feature ratings and fewer incivilities resulted in lower obesity rates among residents. Additionally, the quality of publicly
available recreational facilities has been cited in multiple studies as a better indicator for PA than the mere absence or presence of facilities (Frost et al., 2010; Heinrich, Lee, Suminski, et al., 2007; Lee et al., 2005; Lee & Cubbin, 2009; McAlexander et al., 2009).
Existing research regarding the relationship between SUAs and PA is limited, and primarily delimited to urban environments. For example, in 12 Los Angeles schools that permitted their grounds to be used by the entire community, 10 schools included organized PA programs being implemented either some or all of the time that the facilities were open to shared use (Lafleur, Gonzalez, Schwarte, Banthia, Kuo, Verderber & Simon, 2013).
Findings showed that community use and PA was higher at school sites with shared use programs versus schools without such programs. Other researchers have found that the relationship between shared use of school facilities and school operating costs is not significant, supporting the notion that if more afterschool programs were available, more people could participate in PA (Kanters, Bocarro, Filardo, Edwards, McKenzie & Floyd, 2014a).
The few studies directly measuring the effect of SUAs have been primarily focused in urban areas. Research has shown that people living in rural areas are more likely to be economically disadvantaged, lack resources for extracurricular activity, and have less
supportive environments than urbanized communities (Edwards, Bocarro & Kanters, 2012). Disparities in regards to access to adequate PA facilities among rural and urban areas have been researched (Edwards, Kanters & Bocarro, 2011; Everett-Jones, Brener & McManus, 2003; Frost et al., 2010; Shores & West, 2010) but not in the context of shared use
Limited research suggests opening facilities to people after school hours can increase LTPA. Programmed activities through SUAs has been found to be a key factor in generating more use of public resources (Lafleur et al., 2013). The amount of programming offered in parks has also been strongly correlated with the number of people and intensity of PA
observed (Cohen et al., 2007; Cohen, Stetodji, Evenson, Ward, Lapham, Hillier & McKenzie, 2011; Floyd et al., 2011). The availability of organized programs can also reduce sedentary behaviors like watching television and playing video games (Durant et al., 2009). The strong argument, and one that is addressed in this study, is that the addition of SUAs provide more opportunities for PA programming to occur. Thus, indirectly affecting PA by providing more options and closer proximity to programs.
Moreover, the limited evidence on the role that both SUAs and facility quality play in promoting PA, especially in non-urban environments calls for further study. For example, Kanters et al. (2014b) discussed the need to not only fully explore the extent of shared use, the quantity and type of programs, and the amount of PA resulting from SUAs but also the quality of public school facilities. Access to and the quality of community recreation facilities were found to be relevant in occurrence of PA (McKenzie et al., 2013). Adding environmental context to shared use may give a richer insight into the influence of SUAs and facility quality on accomplishing PA strategies.
in several ways. For instance, rural communities are less likely than urbanized communities to have the same opportunities for people to participate in extracurricular sport programs and public spaces for PA outside of school (Edwards et al., 2011; Kanters et al., 2013). Rural schools generally offer fewer programs, facilities, social supports, and transportation
offerings than more urbanized areas do (Edwards et al., 2011). The presence of features such as sidewalks has been positively associated with increased PA around schools (Brownson et al., 2009). However, sidewalks are almost meaningless if not directly linked with an
urbanized neighborhood (Hutch, Bouye, Skillen, Lee, Whitehead & Rashid, 2011). People living in rural areas may lack the transportation and financial means to acquire access to public facilities. With higher amounts of environmental barriers existing for rural areas, limited empirical research supports the notion that rural populations are disadvantaged in regards to PA and accessibility.
Statement of the Problem
Although studies suggest policies allowing access to school PA facilities and resources increase LTPA, activity in schools with SUAs have not been observed nor
described in the research, particularly in rural settings. Additionally, the association between LTPA and facility quality has not been extensively addressed in previous work on LTPA and shared use of school resources. Therefore, the purpose of this study is to investigate the effect of public school level SUAs of facilities during non-school hours on the amount and type of LTPA of outside community members and programs in rural communities. In
provides valuable evidence to better inform decisions about the impact of community-wide sharing of facilities in rural communities as well as the absence or presence of various amenities and incivilities in these spaces.
Significance of the Study
Schools are unique in having the ability to promote PA and increase energy
expenditure for both children and adults (Story et al., 2014). Public health advocates have identified school spaces as an important resource for increasing PA among children and adults. In some cases, neighborhood schools may be the only place for people to be active (Filardo, Vincent, Allen & Franklin, 2010).
The need to find creative and innovative answers to sustaining active living initiatives has never been greater. Although policies such as SUAs have been identified as a potential combatant to unhealthy PA behaviors, very little is known about the effects that access policies like SUAs have on LTPA. SUAs come in many diverse shapes and sizes with various levels of content. For example, a general open use policy for an outdoor track looks significantly different than a formal written contract specifying the conditions of a youth basketball team using a gymnasium to play their games. These agreements can also vary widely depending on location, culture, and demographic makeup of a community. Given the difficulty of successfully applying and sustaining SUAs to a broad range of communities, we simply do not know how much PA occurs as a result of shared use and what policy
of poor quality with high grass and evidence of litter or vandalism, few people would be inclined to be physically active regardless of the SUA in place.
Are SUAs really enough to increase LTPA? This study is needed to add context to the existing literature by offering empirical evidence on the interplay between policy and built environments on LTPA in rural settings. Previous studies have noted there may be more needed to change sedentary behaviors than just incorporating a SUA (Kanters, et al., 2014b; Schmid et al., 2006). That is, even the most organized, clear, and mutually beneficial SUA can fail at facilitating increased LTPA behavior due to various environmental factors. In general, very little research on SUAs has been done. Additionally, what little research that exists has primarily been conducted in urban areas (Everett-Jones & Wendel, 2015). Rural areas are more at risk to having fewer accessible PA resources and higher levels of health disparities than urban areas (Trust for America’s Health, 2014). However, attention to rural areas is lacking. A major contribution of this study is the inclusion and analysis of diverse, rural public schools not located in highly urbanized areas.
More research is needed not only on the relationship between shared use and LTPA, but the relationships between LTPA and the built environment as well. Associations between built environmental factors and PA levels in schools have received relatively little empirical study (Eyler, 2003; Jackson, Dannenberg, & Frumkin, 2013; Sallis et al., 2012). An in depth study connecting PA to the policy and built environments in North Carolina could fill a gap in research by not only connecting LTPA to shared use, but relating objectively measured LTPA with the quality of each facility and providing context into the types of
Tester & Baker, 2009). This study will contribute to the knowledge of SUAs and their potential role in creating positive LTPA environments while also quantifying the impact of facility and resource quality on LTPA. Most of the public schools included in this study are situated in rural areas where little attention to research has been devoted. The overarching goal is to turn research into practice by providing real findings to help inform local
stakeholder decisions on the creation of open access policies for greater after school utilization of safe, accessible, and available resources.
Further, North Carolina was included in the list of the top 10 most inactive states in America with a 26.9% completely inactive population (Physical Activity Council, 2015). North Carolina is also unique in that it has the second highest rural population in the country (U.S. Bureau of the Census, 2006). Hence, from a regional perspective, if there is any state that would benefit most from a study focused on active living solutions for rural
communities, North Carolina is arguably one of the strongest candidates.
The lack of studies in rural settings remains to be a gap in research surrounding LTPA. Few researchers have assessed the availability of PA resources in rural settings (Edwards et al., 2012). In fact, much of the research has only focused on neighborhood disparities within cities (Giles-Corti & Donovan, 2002; McKenzie et al., 2013).
attention in the area of place disparities greatly limits our understanding of population wide PA behavior. In addition, almost all studies of shared use have examined urban areas (Hodge, 2015; Kanters et al., 2014a; Spengler, 2012). Initiatives that increase LTPA for people living in rural environments needs to be further explored, especially in regards to the utility of SUAs in providing available and accessible PA programming. Examining the efficacy of SUAs in rural communities could have huge implications for practitioners in rural settings who may be contemplating how a multi-level intervention such as incorporating more shared use programming could translate into a viable solution to promote active living.
This study will offer objective, empirical LTPA data from a selection of North Carolina public schools who participate in SUAs during non-school hours. This study will add to the body of literature by providing valuable baseline LTPA data in rural North Carolina communities, inform policy intervention strategies, and identify possible environmental barriers to sharing facilities.
Research Questions
The focus of this thesis was to investigate the association between SUAs and LTPA levels and to measure the impact of built environment variables (i.e., facility quality) in facilitating more opportunities for people to be more physically active. The primary goal is to provide a clearer picture into the context of active SUAs, provide the number and type of participants and programs that result from SUAs, determine if shared use translates into more LTPA, and to see if the quality of facilities has any relationship on the level of use.
Therefore, this study will address the following research questions:
of outside/shared use programs?
2. What is the relationship between LTPA and outside/shared use programs? 3. What is the relationship among LTPA, type of facility, and facility quality?
Delimitations
This study was delimited by the following conditions:
1. Schools whose principals provided survey responses related to shared use.
2. Only public middle and high schools in North Carolina were included in the study. 3. Observations were delimited to after school hours (3:00PM to 7:30PM on weekdays)
and weekend days (9:00AM to 7:00PM). Before school hour observations were not recorded.
4. No pre- and post- test intervention and evaluation of SUAs was conducted.
Definition of Terms
1. Physical Activity (PA): Any bodily movement produced by skeletal muscles that requires energy expenditure – including activities undertaken while working, playing, carrying out household chores, travelling, and engaging in recreational pursuits (World Health Organization, 2008).
a. MET: “The ratio of exercise metabolic rate. One MET is defined as the energy expenditure for sitting quietly, which, for the average adult, approximates 3.5 ml of oxygen uptake per kilogram of body weight per minute (1.2 kcal/min for a 70-kg individual). For example, a 2-MET activity requires two times the metabolic energy expenditure of sitting quietly” (CDC, 2012a, p. 4).
3. CDC Recommended Levels of Physical Activity: Set at 60 minutes of MVPA/day for children and adolescents and 30 minutes of MVPA/day for adults (CDC, 2012b). 4. Leisure-time Physical Activity (LTPA): Exercise, sports, recreation, or hobbies that
are not associated with activities as part of one’s regular job duties, household, and transportation (Brown et al., 2010).
5. Shared Use: When a space is used by the school during the school hours and by a non-school user after school hours. For example, a grassy field for physical
education instructors during the school day and for after school youth sports activities during after school hours (Filardo et al., 2010).
6. Public Education Use: The primary uses for public school buildings and grounds (Filardo et al., 2010).
7. Civic Use: The occasional shared use of school buildings and ground by individuals, groups, or organizations. For example, use of schools for voting, community
meetings, special events, as emergency shelters, as well as the casual use of grounds by the public for recreational use (Filardo et al., 2010).
Heart Association, 2012).
9. Barriers: Obstacles that inhibit or prevent one’s ability to adopt and, once begun, to adhere to an activity over time (Frank, Engelke & Schmid, 2003).
10.Policy: Legislative or regulatory action taken by federal, state, city, or local governments, government agencies, or nongovernmental organizations such as schools or corporations that influence or guide behavior (Schmid, et al., 2006). 11.Organizational Policy: A policy instituted within specific organizations that define
appropriate behavior within the confines of the organization (e.g., corporations, schools, or health departments) (Schmid, 1995).
12.Built Environment: The form and character of communities, made up of specific places (e.g., homes, streets, offices, parking lots, shopping malls, restaurants, parks, movie theaters) that constitute a city, town or suburb (Brown et al., 2010).
CHAPTER TWO: LITERATURE REVIEW
The primary purpose of this study was to investigate the interrelationships between SUAs, the built environment, and LTPA behavior. Literature specific to previous academic research examined several relevant topics. The review presents the theoretical framework guiding this study as well as providing an overview of policy and environmental approaches in community based PA. This section will summarize what I have learned from these studies and how they serve as the foundation for my current research. I will subsequently discuss the social ecological framework, benefits and measurements of PA, policy environment, role of public schools, previous studies on the utility of SUAs, and the applications of both
observational and survey instruments.
The Foundation and Application of the Social Ecological Model
An ecological approach to explaining human development concerns itself with understanding the contexts and interactions between the individual and his or her
surroundings. There has been significant increase in the application of ecological models in guiding health promotion research (Cochrane & Davey, 2008; Fleury & Lee, 2006; Richard, Gauvin, & Raine, 2011; Sallis, Owen, & Fisher, 2008).
framework. Hence, the social ecological framework is interdisciplinary by nature and is used in fields of epidemiology, medical sociology, public health, health psychology and others (McLeroy et al., 1988). A social ecological perspective is based on a broad, overarching paradigm that bridges several different fields of research, rather than from one theory (Stokols, 1996b).
Many studies have adapted the SEM to help examine the behavior of people in various environments including areas devoted to sport and recreation (Blanchard, McGannon, Spence, Rhodes, Nehl, Baker & Bostwick, 2005; Elder, Lytle, Sallis, et al., 2007; Ettner & Grzywacz, 2001; Fleury & Lee, 2006; King & Sallis, 2009; Riley, Taylor, & Elliott, 2001; Robertson-Wilson, Leatherdale & Wong, 2008). Others have recommended using the SEM to address the current obesity epidemic and low levels of PA (Sallis et al., 1998).
As stated earlier, the premise behind social ecological approaches is that
environments and particular social factors either enable or constrain behavior by promoting or discouraging particular actions. Stokols (1992) used the framework of social ecology to develop his own social ecological model under four assumptions. First, health behavior is influenced by physical environments, social environments and personal attributes. Second, human-environment interactions occur at varying levels of combination (individuals,
Further testing of ecological models of PA has been recommended by multiple researchers as well as being the main guide for the CDC (Humpel, Owen & Leslie, 2002; Riley et al., 2001; Robertson-Wilson et al., 2008; Sallis et al., 2006b; Stokols, 1996b). Behavior change is expected to be maximized when environments and policies support healthful choices, motivate and educate people to make those choices. Lastly, ecological models are most powerful when they are behavior-specific. The strength of using a social ecological framework is that more models can be developed for specific PA behaviors and population subgroups. For example, the use of parks by rural community members.
Despite the well-documented benefits of PA, close to 83 million Americans continue to live a predominantly sedentary lifestyle (Physical Activity Council, 2015). Giles-Corti (2006) suggests that targeting interventions to both at both the individual and environment are required to increase PA. There is also evidence that supports that interventions across multiple levels are the most effective in influencing PA.
A defined ecological model for PA promotion was developed by Spence and Lee (2003) explaining PA behavior as being influenced by the relationship between
Figure 2: Ecological model of four domains of active living (Sallis et al., 2012).
There has been a significant increase in the application of social ecological models in guiding health promotion research. In fact, the combination of environmental, policy, social, and individual intervention strategies is being recommended for various unhealthy behaviors (Brownson, Kelly, Eyler, et al. 2008; Schmid et al., 2006). Previous researchers have
adapted the SEM to explain human behavior but the one that is most applicable is model of active living (Sallis et al., 2006a). The model shown in Figure 3 best illustrates the SEM through four environments. The first level are intrapersonal influences such as age, gender, race, and socio-economic status. The next level is the social or cultural environment pertaining to family, peers and social groups. The physical or built environment includes resources, facilities, and the geography. The outer most level of influence is the policy environment encompassing all governmental laws, regulations and policies. As intervention strategies move from addressing the intrapersonal factors to focusing on the policy
Figure 3: Model showing strength of reach and permanence across ecological influences (Sallis, 2014, p. 8)
This study will use the SEM as a guiding theoretical framework in examining the interrelationships between policies, and built/physical environments and LTPA.
Policy Approaches in Health Promotion
Health-related public policy can be described as laws or legislation impacting directly or indirectly on health. In other words, public health policies create supportive environments encouraging people toward health enhancing behaviors (Woods & Mutrie, 2012). An
Environmental and policy strategies have been cited as being more effective than individual behavior modification approaches at reaching target populations (Eyler, 2003; Schmid, Pratt, & Hovze, 1995). The reason being that policies can benefit all people
exposed to the environment rather than devoting change efforts to one person’s behavior at a time. For example, counseling to prevent alcohol abuse has been shown to be ineffective without the help of policy interventions such as increasing taxes or controlling the number of alcohol outlets in communities (Institute of Medicine, 2011). The literature surrounding health promotion through policy strategies has focused heavily on (a) nutrition or dietary behaviors and (b) PA. Public health efforts to improve nutrition and increase PA have previously emphasized changes at the individual level of ecological models, yielding ineffective and unsustainable results (Lyn, Aytur, Davis, et al., 2013). However, organizations such as the CDC and Institute of Medicine have led the movement from
addressing intrapersonal and social levels of the SEM framework to policy solutions aimed at altering the environment in a way that positively influences population-level dietary and PA behaviors (Institute of Medicine, 2011).
Sacks et al. (2008) set out state and local policy actions for both the PA and nutrition system environments. These actions were a result of a systematic review of proposed
solutions/options from practitioners for positively influencing both environments. Examples cited for the nutrition system included production subsidies and taxes, laws restricting marketing unhealthy foods, products sold in schools, land-use management in food
and open spaces for physical activities, equipment for schools, public liability, physical education in schools, building design standards, and access of general community to school sports facilities (Sacks, Swinburn, & Lawrence, 2008).
A PA policy has been defined as a public health policy that defines PA as a priority area, identifies specific population goals and targets, and offers a plan of action to
accomplish the stated goals (Bellew, Schöeppe, Bull, & Bauman, 2008). Successful policies have the potential to influence all individuals within a geographical area like a school or workplace (Edwards, Kanters, & Bocarro, 2014; Spengler, Young, & Linton, 2007; Ward, 2011; Woods & Mutrie, 2012). Dunton et al. (2010) outlined the four PA policy strategies: (1) provide information about the behavior, (2) increase/decrease opportunities for behavior, (3) provide incentives/disincentives for behavior, and (4) require/prohibit behavior. To date, there is little research on which type of policy strategy is the most effective in increasing PA at the population level (Beets, Huberty, Beighle, Moore, Webster, Ajja & Weaver, 2013; Dunton, Cousineau, & Reynolds, 2010). However, a conceptual model was developed to help visualize the connection between policy strategies, various theoretical constructs, and PA, shown in Figure 4.
Persuading people to adopt and sustain recommended levels of PA remains a major public health challenge (Giles-Corti, 2006). Policy research and intervention strategies for PA has only recently become relevant for public health practice (Dunton et al., 2010;
McCann, 2006; Schmid et al., 2006). According to Schmid et al. (2006), policy provides an organizing structure and guidance for collective and individual behavior. Policy and
environmental interventions have been an important part of the public health approach to physical activity promotion (Lyn et al., 2013; Sacks et al., 2008; Schmid et al., 2006). For promoting greater physical activity, public policy studies have primarily focused on (a) selecting and funding investments in physical activity resources, and (b) creating or terminating regulations that promote or discourage physical activity (Sallis et al., 2006a). The evidence concerning the efficacy of policy implementation and uptake within the public health sector is limited (Cox, Berends, Sallis, Marie, John, Gonzalez & Agron, 2011; Sallis et al., 1998). Additionally, evaluating the impact of partnerships and policies on facility use and physical activity has been recommended in future research (Beets, Webster, Saunders & Huberty, 2013; Kanters et al., 2014b).
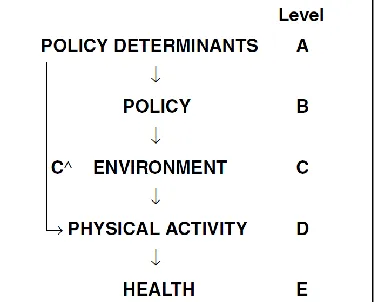
A simple illustration from Figure 5 depicts a model showing policy’s direct and indirect effects on PA. The implied causal sequence from the determinants of policy (Level A), policy’s direct effects on PA (C^), and its indirect effect on PA through its application on the environment (Level C) (Schmid et al., 2006). The links between environment and PA (Level C-Level D) are established and growing (Heath, Brownson, Kruger, Miles, Powell et al., 2006; Kahn et al., 2010; Schneider, Pestronk, & Jarris, 2013).
underpinnings supporting the change of the policy environment to increase PA, additional work is called for in this area.
Access to PA facilities and the aesthetic qualities of the surroundings are consistently found to be influential in PA levels (Choy et al., 2008; Kanters et al., 2014a; Norman et al., 2006; Oyeyemi, Ishaku, Deforche, et al., 2014; Roemmich et al., 2006). A journal scan identified 19 quantitative studies assessing the relationships with PA behavior and
environmental attributes (Humpel et al., 2002). The authors concluded that, although more empirical evidence is needed, accessibility of facilities had significant associations with PA. Lack of access of places to exercise has been previously reported as a leading barrier to physical activity (Brownson et al., 2008; Eyler, 2003; Sallis et al., 1998). Saelens et al. (2003) found evidence of more walking for transportation among adults living in “walkable neighborhoods”. A few studies have used multi-level modeling focused on built
environment variables. For instance, the presence of sidewalks is associated with more walking for transport in many studies (Giles-Corti & Donovan, 2002; Owen, 2007; Sallis, 2003). Similarly, changes in national transportation funding to favor public transit may result in more utilitarian physical activity such as walking from the bus stop to work (Schmid et al., 2006).
expand efforts to promote active living environments (Waterman & White, 2014). Changes in local policies, such as a school system’s decision to require physical education or to open school grounds to the public have been proposed to have more immediate and direct effects on PA (Brownson et al., 2001; Schmid et al., 2006).
School-based Policies for Physical Activity
Research surrounding policies affecting school-based PA has primarily emphasized physical education (P.E.) and sport offerings (Institute of Medicine, 2013). Existing state and national organization policies for PA in after school programming have set benchmarks for students to achieve appropriate amounts of PA, which can most readily be delivered through P.E. sessions, intramural, and varsity sports. For example, California has a policy that requires an afterschool program provide a minimum of 30 to 60 minutes of moderate-to-vigorous PA, limit sitting to no more than 60 minutes at a time, and limit screen time to 60 minutes per session (Beets et al., 2013b). Beets et al. (2013b) also reported that in other states such as Indiana, Maine, and Michigan, any after school program must offer a chance for 30 minutes of PA for every 3-hour time block. North Carolina programs are required to allot 20% of program time for moderate-to-vigorous PA.
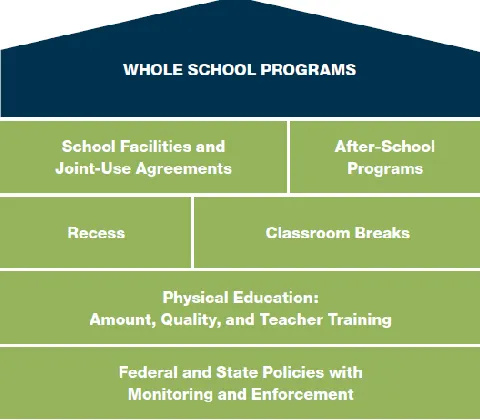
Public schools can play an essential role in providing additional opportunities for PA across the school day. Whole school programs to support PA in school are beginning to gain traction in the public school system (Ward, 2011). As seen in Figure 6, this concept not only include policies addressing interscholastic sports and P.E., but also interventions concerning recess, after-school programs, classroom breaks, and SUAs. In a large study in U.S. middle schools that employed such whole school programs, researchers found a 24 percent increase in active participation among girls, and a 12 percent increase among boys (Simon, Wagner, DiVita, et al., 2004). After-school and intramural programs have been cited as contributing to daily MVPA requirements in some empirical studies but research in the school
environment continues to be limited (Choy et al., 2008; Lubans & Morgan, 2008; Trost, Rosenkranz & Dzewaltowski, 2008)
Including intramural sports in the school setting has been called for as an example of a policy change to increase student participation and better promote PA within schools (Bocarro, Kanters, Edwards, Casper & McKenzie, 2014; Edwards et al., 2014; Kanters, et al., 2013). A study of four middle schools in North Carolina measured effect of a policy change of adopting more intramural sports in addition to the interscholastic/varsity sports already in place. The authors estimated that the policy implementation benefitted both economically disadvantaged and not economically disadvantaged students by increasing PA by 4.9% and 1.2% respectively. Moreover, a simulation of all middle schools adopting an intramural sports policy statewide was approximated to increase sports participation by 21.2%, resulting in 43,505 new sports participants (Edwards et al., 2014).
One suburban county in Illinois leveraged a federal policy change initiative by creating convenient and safe places to be active via increasing opportunities for PA. The grant program led to 150 policy changes in 127 schools and 73 communities, citing that active living initiatives yielded the greatest reach and potential impact. By the end of the project, 19 school districts including 115 schools advanced one or more policy changes that increased opportunities for PA before, during, and after school (Bassett et al., 2013).
Local government uses capital spending to make improvements to existing schools.
Policies that build or improve access to existing facilities may influence PA at the community level (Eyler, 2003). People who have access to recreational facilities and programs are more active than those without access (Sallis et al., 2001). One of the first studies to examine the availability of school PA facilities for public use and the associated barriers and benefits in making facilities available found that outdoor facilities were available more often than indoor facilities (Evenson & McGinn, 2010). Beets et al. (2009) conducted a meta-analysis and found four out of six after school intervention studies reported positive effects on PA. An recent study on four middle schools was done to examine whether school policy (i.e., intramural or varsity) predicted likelihood that students would engage in after-school MVPA in specific physical activity areas (Bocarro et al., 2012). The authors concluded that shared use of sport facilities during the time periods immediately following the release of school could yield greater and more efficient utilization of facilities. In a broader study on thirty middle schools in North Carolina, the relationship between shared use and school operating costs were measured (Kanters et al., 2014a). Findings showed that schools do not incur significant additional facility operating costs when more programs and children use school facilities after hours. Further, the amount of shared use by schools was associated with an increase in both male and female participation in after school programs. If SUAs can include liability protection and clearly communicate facility operation,
maintenance and repair costs between schools and an outside entity, then accessible places for PA could become more available for civic use (Kanters et al., 2014a).
Whitaker, Burdette & Colabianchi, 2006). But communities with high racial minorities, lower income and in a rural setting are less likely to have access to recreational facilities than higher-income or predominately Caucasian communities (Powell et al., 2006). In a 2009 survey, 69 percent of schools in low-income and primarily Black and Latino communities reported recreational facilities were open to the public outside of school hours (Spengler, Connaughton, & Maddock, 2011). A study in California found income-related disparities concerning access to school facilities. Sixty-eight percent of respondents from higher-income districts reported that some or all of their schools were open for public recreational use outside school hours, compared to only 44 percent of respondents from lower-income districts (Cox et al., 2011).
Data from a national survey of public schools from the School Health Policies and Programs Study (SHPPS) found 67 percent of the 921 schools allowed outside, public use of physical activity facilities. However, this percentage did not change between 2000 and 2006 indicating a lack of progress toward increasing the proportion of the nation’s public and private schools that provide access to facilities for all persons outside school hours (Evenson et al., 2010b). Furthermore, only 29 percent of the schools surveyed offered all types of shared use for youth sports teams, community sponsored youth activity classes, supervised open gym or free play during the following times: before school, after school, evenings, weekends, or during school vacations (U.S. Department of Health & Human Services, 2008). Similarly, Lee et al. (2007) surveyed 988 elementary, middle and high schools and 60% made their PA facilities available in the evenings, 58% after school hours, 52% on the weekends, 46% during school vacations, and 11% before school hours (Lee et al., 2007).
Policy stakeholders have cited that convenient access, low cost, creating relationships, and location are the most common motivational factors for sharing school facilities with individuals and community organizations (Beighle et al., 2010). Further, there are more public school buildings than any other public facility in the United States; 6.6 billion square feet of space on more than 1 million acres of land (Filardo et al., 2010). Even though not every acre of public school land is devoted to PA, most campuses have an inventory of standard spaces conducive to PA opportunities for serving high volumes of people.
non-school use can be challenging and, many times, impossible. One of the challenges in increasing PA is for communities to commit resources to construct environments (e.g., playgrounds, ball fields, parks, trails and other recreational facilities). Cost, liability, poorly designed spaces, inadequate decision-making processes are all additional barriers to shared use (Filardo et al., 2010).
A national survey of principals from lower-income communities provided the most commonly cited reasons that schools did not allow public use of their recreational facilities. The following reasons were identified as extremely important for limited or no access: liability concerns (61%); insurance (61%); costs (60%); staffing (57%); safety concerns (57%); and maintenance costs and responsibilities (55%) (Spengler, 2012). Another survey of California school administrators found the most frequently cited reasons for restricting use to the public during after school hours were lack of staffing (45%); liability concerns (44%); safety concerns (44%); insufficient funding (39%); and risk of vandalism (38%) (Cox et al., 2011). In four communities in the United States, varying in education, race and
socioeconomic status. Evenson and McGinn (2010) found that safety, insurance and liability concerns were the main perceived barriers to making recreational facilities available for public use. Similarly, a national survey of school principals reported that 83% of all
Nearly 90% of all school-age children are enrolled in public schools (Filardo et al., 2010). Fewer families today have multiple children or any children at all. From 1960 to 2008, the percent of all households having at least one child under 18 years old dropped by 16 percent (U.S. Census, 2008). This lessens school space demands during public education use hours and reduces demand for school space by students. As a result, school spaces often go under-utilized and could be available for shared use in communities. However, the growth of the U.S. population has contributed to the increase in public school enrollment and is projected to increase by 2 million students by 2015 (U.S. Dept. of Education, 2009). As more students fill up schools, the school grounds and resources are so frequently used by the school and students that gaining access to school facilities is difficult. Athletic and extra-curricular activities can fill up the school after hours and over weekend periods; leaving the school sites with full utilization of their spaces and little room for shared use.
In addition to the lack of research on SUAs in schools, much of the analysis of access to school resources has been predominantly focused in urban schools (Giles-Corti &
Measures
The ways in which access policies and PA have been measured has evolved over the past few decades (Brownson et al., 2001; 2009). Research has moved from focusing on compliance with supervised exercise programs in relation to proximity facilities to studying the impact of the community environment, (e.g., the convenience of facilities) on PA
(Brownson et al., 2009). Better measurements of the built and policy environment have been developed and PA surveys have become more comprehensive, allowing assessment of specific behaviors in relation to the environment (Kanters et al., 2014b). Researchers have thus developed and adapted several audit tools in recent years. For example, shared use and policies associated with physical activity has been best measured through interviews or self-administered questionnaires, such as the Structured Physical Activity Survey (SPAS
(Evenson & McGinn, 2010; Spengler, 2012)). Combining surveys with objective, systematic observation measures is a trend many researchers are attempting to incorporate into new studies (Farley et al., 2007; Keadle et al., 2014). Reliable observational tools have been applied to school settings to count people in specific settings in addition to contextual
information: System for Observing Play and Recreation in Communities (SOPARC) and the Physical Activity Resource Assessment (PARA).
Vaughan, 2013; Bocarro, Floyd, Moore, Baran, Danninger, Smith & Cosco, 2009; Bocarro et al., 2012; Chung-Do, Davis, Lee, Jokura, Choy & Maddock, 2011; Cohen et al., 2007; 2011; 2013; Cohen, Marsh, Williamson, Golinelli, & McKenzie, 2012b; Floyd et al., 2011; Lafleur et al., 2013; McKenzie, Cohen, Sehgal, & Williamson, 2006; Mckenzie, Crespo, Baquero, & Elder, 2010; Parra, McKenzie, Ribeiro, et al., 2010; Pleson, Nieuwendyk, Lee, Chaddah, Nykiforuk & Schopflocher, 2014; Price, Reed, & Hooker, 2012; Reed, Morrison, & Arant, 2009; Shores & West, 2010; Tester & Baker, 2009).
in San Francisco, CA to calculate physical activity levels in low-income neighborhoods that underwent major field renovations. Both intervention parks experienced a significant
increase in overall physical activity among male and female visitors (Tester & Baker, 2009). Another pre and post-test study was done using systematic observation to determine whether the installation of new outdoor exercise equipment in 12 public parks impacted physical activity levels (Cohen et al., 2012). Findings indicated that the installation of fitness zones increased the level of moderate to vigorous physical activity at a favorable cost-effect ratio. On the other hand, the difference between the overall park use of the fitness zone parks and the 10 control parks was not statistically significant (Cohen et al., 2012). Cohen and colleagues followed with a national study on the relationship between physical activity and socio-economic status of surrounding neighborhood parks consisted of 24 parks in the metropolitan cities of Albuquerque, NM, Chapel Hill/Durham, NC, Columbus, OH, and Philadelphia, PA (Cohen et al., 2013). Researchers observed almost 36,000 individuals and found that neighborhood poverty level, perception of safety and the presence of incivilities were not associated with the number of park users, however, programmed and supervised activities and the number of facilities were strongly correlated with park use and physical activity (Cohen et al., 2013). Researchers in Recife, Brazil used SOPARC to test the
children observed were sedentary (52.6%) in addition to 34.2% and 13.2% as being moderate and vigorously active, respectively (Floyd et al., 2011). Playgrounds were the most popular choice of setting for children (40.3%) while the sports fields (10.8%) and courts (9.4%) were among the target areas that had minimal presence of children. Bocarro et al. (2009) obtained direct observations of 2,145 children in 23 parks in Raleigh/Durham, North Carolina. Three age groupings were established: 0 to 5 years old (Young Children); 6 to 12 (Middle
Childhood), and 13 to 18 (Older Children). Results reported 98% inter-observer agreement by age group and gender by physical activity codes (Bocarro et al., 2009).
16 times higher in schools with shared use agreements in place (Lafleur et al., 2013). In a study in North Carolina, 1,188 SOPLAY observations were completed in two school between the after school period of 2:30 and 4:30 P.M (Bocarro et al., 2014). Intramural sports were found to generate more physical activity than interscholastic sports among boys and the lowest physical activity levels in interscholastic sports were baseball, softball, cheerleading, and football.
The Structured Physical Activity Survey (SPAS) identifies the frequency, duration, and type of structured afterschool physical activity programs offered at a school, how many boys and girls participated in each program, when programs were offered, who sponsored them, and whether or not there was a fee for participating (Powers, Conway, Mckenzie, Sallis, & Marshall, 2002). The SPAS was originally designed to assess PA opportunities through public school programming (e.g., intramural, interscholastic, and club programs) (McKenzie et al., 2013). Although new, SPAS has been cited as a viable tool to include in analyzing and developing comprehensive school physical activity models (McKenzie & Lounsbery, 2013). Recently, a summary of P.E. teacher effectiveness research mentioned the utility of SPAS in shedding light on physical activity opportunities that schools can provide before and after school hours (McKenzie & Lounsbery, 2013).
An early study in San Diego County, California used SPAS to assess the type,
showed that 69.6% of activity programs were offered after school but accommodated only 5.5% of the daily school attendance. Powers and colleagues (2002) concluded that PA levels could be improved by increasing program offerings before and after school.
The application of SPAS has also been used in settings other than schools. McKenzie et al. (2013) surveyed 30 community recreation centers in five diverse cities in southern California in an investigation on whether economic disparities were associated with recreation center environmental characteristics. Recreation supervisors completed a modified version of the SPAS documenting opportunities for children 6-10 years old to participate in structured physical activity programs at the center over the past two weeks. Findings from the study posited that the poorer neighborhoods provided fewer options of physical activity programs for children to choose; however, results were not statistically significant (Mckenzie et al., 2013).
One of the latest cases administering the SPAS was an examination of the amount and type of afterschool physical activity programs provided by public middle schools and the additional operating costs as a result of the additional community-sponsored programs (Kanters et al., 2014a). The sample of schools came from one of the largest school districts in the country and data were collected four times over the course of one year to capture seasonality changes in activity. The authors concluded that schools with higher amounts of participants in after school programs did not have significant increases in operating expenses (Kanters et al., 2014a).
actual physical environment as it is directly observed (Brownson et al., 2009). The PARA is a brief, one-page, check-box instrument to systematically document and describe the type, features, amenities, quality and incivilities of a variety of physical activity resources (Lee et al., 2005). The audit tool allows systematic observation of the physical environment, including the presence and qualities of features hypothesized to influence physical activity behavior.
PARA was first developed in 2005 in an effort to study the link between neighborhood factors and physical activity in seventeen neighborhoods in a major
metropolitan city (Lee et al., 2005). The overall environment for physical activity resources was different among the neighborhoods while the net number of physical activity resources did not vary. This suggested that merely the presence or absence of facilities may not be a valid way to investigate access to resources (Lee et al., 2005). The authors stated that, understandably, neighborhoods with the presence of litter and a higher proportion of incivilities encourages less desirable behavior and not promoting recreational physical activity.
obesity and environmental factors. The major finding was that more supportive
neighborhoods (those with greater accessibility, more amenities, higher-quality physical activity feature ratings and fewer incivilities) correlated with lower obesity prevalence rates among residents (Heinrich et al., 2008).
CHAPTER THREE: METHODS
The purpose of this study is two-fold: (1) examine the relationship between SUA programs and LTPA behavior, and (2) examine the association of facility quality on LTPA. This study followed a non-experimental research design where a sample of public middle and high schools across North Carolina were selected to participate. A mixed methodology of observations and surveys were used to address the research questions. This chapter describes in detail the methods employed in the study. Study methods were approved by the
Institutional Review Board for Human Subjects Research at North Carolina State University (see Appendices D-E).
Sampling
Through the Community Transformation Grant (CTG) Project, the Centers for Disease Control and Prevention (CDC) and Department of Health and Human Services (DHHS) provided support for obtaining and analyzing baseline data through a statewide survey. A baseline survey was e-mailed to all public elementary, middle, and high schools (N=2,359) in North Carolina using Qualtrics. Qualtrics is a web-based survey software tool used to capture survey results from users who are privately given access to a survey. Contact information for principals was compiled from the 2012 North Carolina Department of Public Instruction (DPI) database. The contents of the e-mail included a welcome message,
description of the study, a statement of confidentiality and a URL link to the survey. The questionnaire comprised of 22 questions related to the shared use of school facilities. Among other identifiable school characteristics, the analysis was primarily based on whether
or other), type of agreement (e.g., informal, formal, or no agreement), and perceived barriers to shared use (e.g., costs, liability concerns, scheduling, etc.). A total of 1,230 usable
questionnaires were received for an overall response rate of 52.14%. Findings from this survey were used to identify potential schools to participate in the study. Mainly, the 1,066 public schools whose principals responded ‘yes’ to sharing their facilities with outside groups or individuals during after school hours provided the sampling frame.
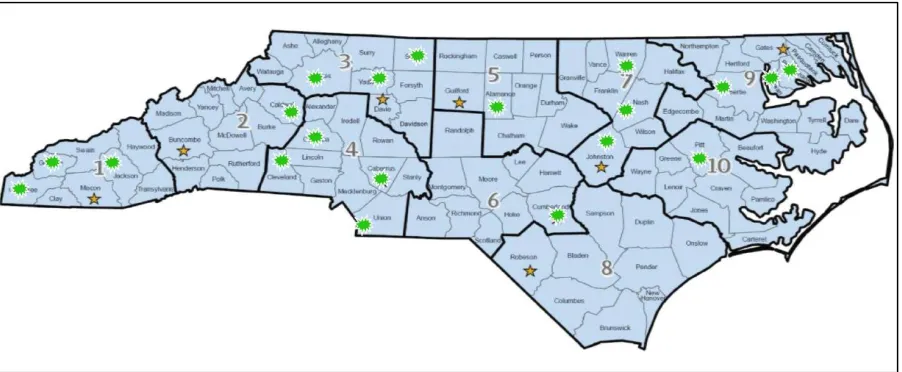
Twenty public schools in North Carolina comprising both middle and high schools were selected to participate in the study (Figure 7). The schools were selected using a stratified nonrandom sampling method so that each of the 10 CTG regions were represented and included in the study (Eat Smart Move More North Carolina, 2013). The decision regarding which schools would be included in the study were based on several
referred to the National Center for Education Statistics classification system for determining rurality of schools (U.S. Department of Education, 2015). The NCES does not rely on county boundaries but instead, uses mapping technology, budget data, latitude and longitude coordinates in relationship to urbanized areas to code individual schools. Using the NCES codes as a guide and previous methods coding public schools’ locale (Edwards et al., 2011), the investigators determined what schools were given higher priority for being located in a rural territory.
Figure 7: Locations of Final 20 Sites Selected for On-site Data Collection
Table 1: Grade Level, Rurality, Socioeconomic Status (SES), and Racial/Ethnic Characteristics of Study Schools
School #
Grade
Level Locale
Title I
School SES
1 % White % Black % Hispanic
1 Middle Suburban No 40.7 56.5 19.8 17.8
2 High Suburban Yes 58.9 43.5 32.9 18.4
3 High Urban Yes 77.7 8.6 41.1 46.4
4 High Rural-Fringe Yes 68.2 70.9 11.1 12.6 5 High Rural-Fringe Yes 42.6 80.0 9.4 3.4 6 High Rural-Fringe Yes 54.7 93.8 2.5 2.3
7 High Urban Yes 48.9 36.1 53.6 5.7
8 Middle Rural Yes 59.8 75.9 5.0 17.2
9 High Rural Yes 57.7 83.6 0.3 1.7
10 Middle Rural Yes 86.4 13.2 72.1 6.3
11 Middle Rural-Fringe Yes 52.2 59.3 26.0 6.5 12 High Rural-Fringe No 13.8 80.2 10.7 5.9
13 High Suburban Yes 47.8 65.3 7.0 20.0
14 Middle Rural Yes 64.1 48.6 23.9 23.9
15 High Rural Yes 87.5 7.0 90.8 0.9
16 Middle Rural-Fringe Yes 56.6 70.6 22.2 3.8 17 High Rural-Fringe Yes 47.6 85.9 0.8 3.8
18 High Rural Yes 56.4 51.2 42.6 2.5
19 High Rural Yes 53.0 64.2 32.7 1.4
20 Middle Rural Yes 72.7 87.4 0.4 6.5
1Percent of student population receiving free or reduced price lunch
Finally, schools were offered a $100 VISA® gift card given to the athletic department as an incentive to participate in this study. The incentive was awarded only after the