EFFICIENT PROBABILISTIC SEISMIC SOIL-STRUCTURE
INTERACTION (SSI) ANALYSIS FOR NUCLEAR STRUCTURES
USING A REDUCED-ORDER MODELING IN PROBABILISTIC SPACE
Dan M Ghiocel1 and Mircea Grigoriu2
1
Ghiocel Predictive Technologies, Inc., Rochester, New York, USA ([email protected])
2
Cornell University, Ithaca, New York, USA
ABSTRACT
The paper investigates different reduced-order modeling approaches for performing fast probabilistic seismic SSI analyses. Three types of ROM approaches are considered: i) Latin Hypercube Sampling (LHS) simulation, ii) Random Vibration Theory-based (RVT) simulation, and iii) Stochastic Reduced Order Modeling (SROM) simulation. While LHS and RVT are classical approaches, currently recommended by the new ASCE 04-2013 standard, SROM is a recently developed, new approach based on an advanced probabilistic modeling. Comparative results are shown for the EPRI AP1000 RB stick model for both soil and rock sites. The paper shows that all the three ROM approaches are useful tools for probabilistic seismic SSI analysis. However, it is noted that the RVT results are quite sensitive to the particular analytical approach employed for estimating maximum probabilistic response. The newer SROM approach appears to be highly efficient, apparently with a faster statistical convergence than LHS.
INTRODUCTION
The reduced-order modeling (ROM) approaches in probabilistic space play the role of accelerators of the statistical convergence for simulated probabilistic responses. Using ROM, the number of the required samples to compute probabilistic SSI responses is drastically reduced in comparison with the standard Monte Carlo simulation. The paper investigates different reduced-order modeling approaches for performing fast probabilistic seismic SSI analyses. Three types of ROM approaches in probabilistic space are considered: i) Latin Hypercube Sampling (LHS) simulation, ii) Random Vibration Theory-based (RVT) simulation, and iii) Stochastic Reduced Order Modeling (SROM) simulation.
While LHS and RVT are classical approaches, SROM is a recently new approach based on an advanced probabilistic modeling.
Latin Hypercube Sampling (LHS) Approach
2
LHS simulations is assembled by repeating this sampling process, without replacement, a total of N times until the values in all probability bins are exhausted.Random Vibration Theory (RVT) Approach
The random vibration theory (RVT) approach uses the analytical relationship between the power spectral density functions and the response spectra. The RVT approach is based on the linear random vibration theory applicable to linear time-invariant dynamic systems excited by Gaussian processes. For such systems, the dynamic responses are also Gaussian processes.
The RVT approach is applied in conjunction with the SSI methodology based on complex frequency approach were the input and outputs are defined in frequency domain by acceleration power spectral density functions that are associated to acceleration response spectra. RVT can be used for either deterministic or probabilistic SSI analysis. The advantage of RVT is its simplicity, since it does not need to use acceleration time histories.
Assuming that the seismic input and SSI response motions are realizations of Gaussian processes, the RVT approach computes directly the in-structure response spectra (ISRS) from the power spectral density (PSD) functions of the SSI response motions. To compute ISRS from PSD, the maximum of the stochastic response is determined by solving the “first-passage problem” for Gaussian processes. The “first passage problem” consists of computing the maximum value of the stochastic response for a given motion duration, T. The motion duration T should correspond to the stationary, intense part of the motion that can be defined as the time for the accumulated energy of the input motion to increase from 5% to 75% of its total energy (Arias Intensity).
To compute the mean maximum response, Xmax, the response peak factor p and the standard deviation
σ
X of the process X need to be determined. Then, mean maximum response is computed simplyX
p
Xmax =
σ
(1)where
∫
∞( )
∞ −=
ω
ω
σ
X2S
Xd
in whichS
X( )
ω
is the PSD of the stochastic response. Similarly, using a peakfactor q, the standard deviation of the maximum response max X
σ
can be computed byX X q
σ
σ
=max (2)
Herein, different analytical formulations are used to compute the response peak factors:
1) MK-UK Approach: Maharaj Kaul-Unruh-Kana formulation for the probabilistic maximum response peak factor given the probability of non-exceedance P (Unruh and Kana, 1981):
2 / 1 0 ) ln( ln 2 − − = P T p
ω
π
(3)where
ω
0 is the circular frequency of interest for maximum response computation.It should be noted that the MK-UK formulation provides directly the probability-level maximum response for a given non-exceedance probability P.
3
(
)
(
T
)
T
p
0 0 ln 2 5772 . 0 ln 2ν
ν
+
=
(4)(
)
[
(
(
)
)
3.2]
0
0 13 2ln
4 . 5 ln 2 2 . 1
T
T
q
ν
ν
−
+
=
(5)where the mean crossing rate is defined by
2 0 0
1
λ
λ
π
ν
=
in whichλ
0=∫
∞( )
∞ −
=
ω
ω
σ
X2S
Xd
and2 2
σ
X&λ
=∫
∞( )
∞ −
=
ω
2S
Xω
d
ω
.3) Alan Davenport formulation (AD-DK) for maximum response statistical moment peak factors including Der Kiureghian’s correction for motion frequency content (Igusa and Der Kiureghian, 1983):
(
)
(
T
)
T
p
e eν
ν
ln 2 5772 . 0 ln 2+
=
(6)(
)
[
(
(
)
)
3.2]
ln 2 13 4 . 5 ln 2 2 . 1
T
T
q
e eν
ν
−
+
=
(7)where
(
)
(
)
0 0.45 e 0 0max 2.1, 2
T
T
1.63
0.38
T
T
δν
ν
=
δ
−
ν
ν
; 0
0.1
; 0.1
0.69
; 0.69
1
< δ ≤
< δ <
≤ δ <
(8)
in which the frequency content shape factor is
2 1 0 2
1 λ
δ = −
λ λ in which
λ
1=∫
( )
∞
∞
−
ω
S
Xω
d
ω
Replacing the equations 4 and 5 of the AD approach, or the equations 6 and 7 of the AD-DK approach in the equations 1 and 2, the first two statistical moments of the maximum response can be computed. Then, to compute probability-level responses for a given non-exceedance probability can be computed using Gumbel or Lognormal distribution. Herein a Lognormal distribution was considered.
The RVT approach has the advantage that for performing probabilistic seismic analysis of a deterministic system using a single simulation analysis rather than a set of randomized simulation analyses. This reduces the probabilistic space of the seismic input variations to a deterministic value for which only a single value simulation is sufficient. If the system has stochastic properties, structural stiffness and damping, and/or soil layer stiffness and damping are random variables, then, RVT could be used in the context of LHS simulations to replace the simulation results for a set of random seismic inputs by a single expected value. This provides a significant probabilistic space reduction and accelerates statistical convergence of the simulated SSI results.
Stochastic Reduced-Order Modeling (SROM) Approach
4
apparently requires a fraction of the computational effort amount required by Monte Carlo simulation, and potentially even LHS simulation in high-dimensional probabilistic spaces.
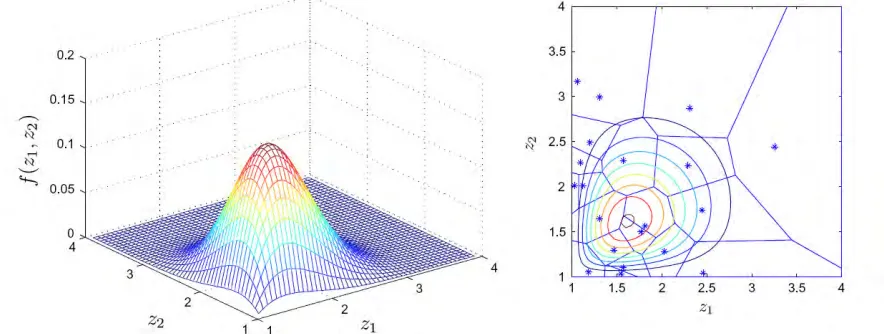
Figure 1 Illustrative Application of SROM to A Skewed Joint Input PDF
The SROM approach combines features of the smart Monte Carlo simulation, in the sense that it uses a relatively small number of samples
z
Kto characterize the input random vector Z in an optimal manner and the point collocation method, in the sense that it interpolates between deterministic responsesK
u
corresponding toz
K. The SROM approach approximates the response surface based onu
K mappings defined over the Voronoi cells centered onz
K. An application of the SROM approach to a bivariate vector Z using only 20 deterministic samplesz
Kis shown in Figure 1. The left and right panels in the figure show the density of Z and the simulated stochastic tessellation cells centered on the samplesz
K.CASE STUDIES AND COMPARATIVE RESULTS
The EPRI AP1000 RB complex SSI model was used for a deep soil site (Vs = 1,000 fps) and a rock site (Vs=6,000 fps). The probabilistic seismic inputs were defined by site-specific GRS with random spectral amplitude variations (Ghiocel and Stoyanov, 2013). The Vs and Damping soil profiles were modeled by random fields with specific statistical variation and spatial correlation structure with depth (Ghiocel and Stoyanov, 2013). No random variability was assumed for structural properties. The reference results were obtained using 100 LHS simulations for probabilistic SSI analysis.
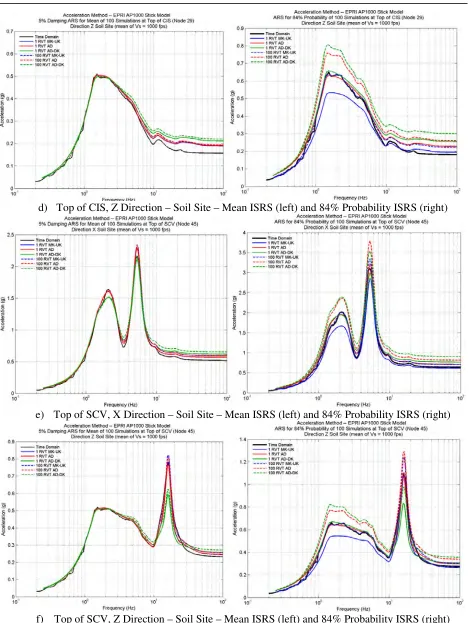
Figures 2 and 3 show a comparison between 100 LHS simulation results and RVT results using different analytical approaches for computing the maximum responses, namely MK-UK, AD and AD-DK. The LHS reference results are denoted in the plot legends by “Time Domain”. The RVT approach was applied assuming i) a single shape of the mean GRS input and ii) 100 randomized spectral shapes of GRS input.
For the mean ISRS shown in the left plots, all analytical variants of the RVT approach appear to provide reasonable results for both soil and rock sites. The MK-UK and AD approaches perform the best, while the AD-DK approach that is supposed to be better than the AD approach, is sometimes too high, sometimes too low when compared with the reference “Time Domain” results based on 100 LHS simulations. It should be noted that the use of 1 or 100 GRS shape simulations has a negligible effect on the computed mean ISRS.
5
a) Basemat Center, X-Direction – Soil Site – Mean ISRS (left) and 84% Probability ISRS (right)
b) Basemat Center, Z Direction – Soil Site – Mean ISRS (left) and 84% Probability ISRS (right)
6
d) Top of CIS, Z Direction – Soil Site – Mean ISRS (left) and 84% Probability ISRS (right)
e) Top of SCV, X Direction – Soil Site – Mean ISRS (left) and 84% Probability ISRS (right)
f) Top of SCV, Z Direction – Soil Site – Mean ISRS (left) and 84% Probability ISRS (right) Figure 2 Comparative LHS and RVT Solutions for Mean ISRS (left plots) and
7
a) Basemat Center, X Direction – Rock Site – Mean ISRS (left) and 84% Probability ISRS (right)
b) Basemat Center, Z Direction – Rock Site – Mean ISRS (left) and 84% Probability ISRS (right)
8
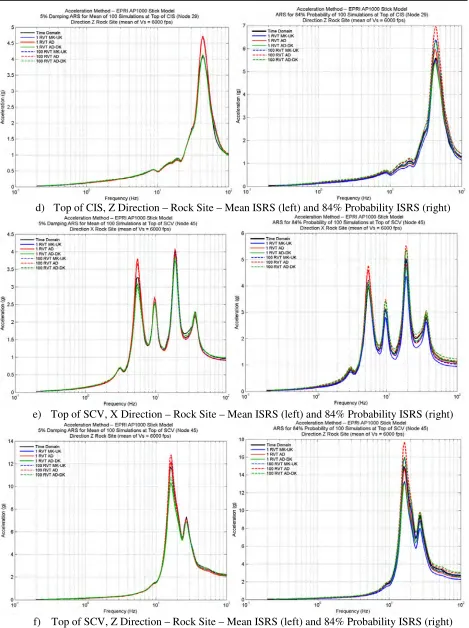
d) Top of CIS, Z Direction – Rock Site – Mean ISRS (left) and 84% Probability ISRS (right)
e) Top of SCV, X Direction – Rock Site – Mean ISRS (left) and 84% Probability ISRS (right)
f) Top of SCV, Z Direction – Rock Site – Mean ISRS (left) and 84% Probability ISRS (right) Figure 3 Comparative LHS and RVT Solutions for Mean ISRS (left plots) and
9
The best performance is achieved by the MK-UK approach with 100 GRS random spectral shapes and the AD approach with 1 GRS mean spectral shape. The MK-UK approach with 1 GRS mean shape and the AD-DK approach perform not so well, in several cases providing highly unconservative ISRS.
Based on the results shown in Figures 2 and 3, the MK-UK approach with 100 GRS shapes and the AD with 1 GRS mean shape are recommended. The AD-DK approach is not recommended since provides, as shown, for several cases significantly unconservative results.
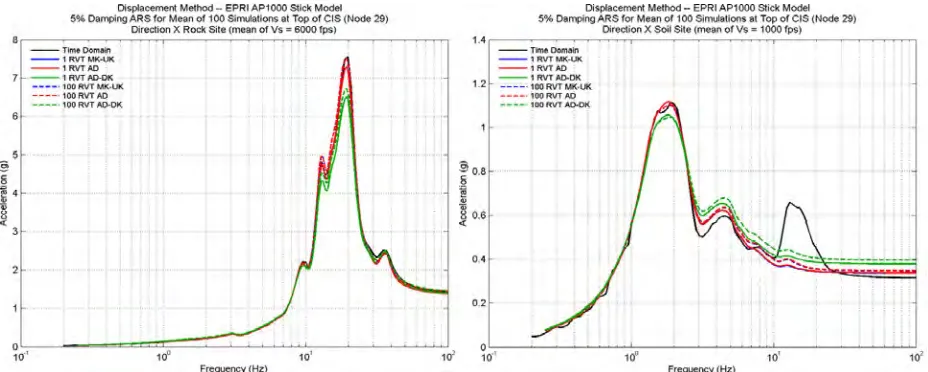
The above the RVT approach implementations were done using acceleration PSD functions. Alternate approaches based on displacement PSD functions are also provided in the literature (Deng and Ostadan, 2012). However, the use of the displacement PSD functions appears to provide reasonable results only for rock sites, being sometime highly unconservative for soil sites, as shown in Figure 4. It appears the “failure” of the RVT approach based on displacement PSD occurs for ISRS that have multiple dominant spectral peaks, particularly for the highest frequency peaks.
Figure 4 Mean ISRS Computed at Top of CIS for Rock Site (left) and Soil Site (right)
The SROM approach was also investigated for a reduced number of samples. The considered probabilistic inputs were a random scale factor for GRS with a c.o.v of 20%, a pair of negatively correlated random variables for soil Vs and damping with c.o.v. of 20% and 30%, respectively, and a pair of negatively correlated random variable for structural stiffness variation and damping with c.o.v. of 15% and 20%. For LHS these variables were considered with a Lognormal distribution, while for SROM their were considered with a Beta distribution having the same statistical means and coefficients of variation.
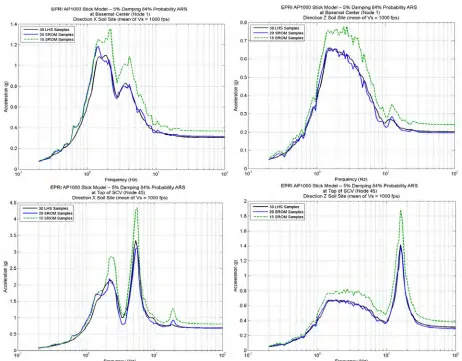
Figure 5 shows a comparison between 84% probability ISRS using SROM and LHS simulations for the soil site. The comparison is made for 30 LHS simulations and 15 and 20 SROM simulations. It should be noted that the ISRS computed for only 20 SROM samples are close to the ISRS computed for 30 LHS samples. The ISRS differences are less than 10%. Similar results were also obtained for rock site. It is difficult to conclude based on the limited obtained results, if the SROM simulation approach is more competitive than the LHS simulation approach. Additional investigations are needed for reduced number of samples using both LHS and SROM simulations.
CONCLUSIONS
The paper shows that all the three ROM approaches are useful tools for probabilistic seismic SSI analysis. However, it is noted that the RVT results are quite sensitive to the particular analytical approach employed for estimating maximum probabilistic response.
10
Figure 5 84% Probability ISRS Computed for Soil Site Using LHS and SROM Simulations
REFERENCES
Davenport, A. (1964). “Note on the Distribution of the Largest Value of A Random Function with Application to Gust Loading”, Proceedings. Institute of Civil Engineers, Vol. 28, 187-196
Deng, N. and Ostadan, F.(2012).”Random Vibration Theory-Based Soil-Structure Interaction Analysis”, the 15th WCEE, Lisbon
Ghiocel, D.M. and Stoyanov, G. (2013). “Comparative Probabilistic-Deterministic Investigations for the Evaluation of Soil-Structure Interaction Response, SMiRT22 Conference, Division IV, San Francisco
Grigoriu, M. (2012) “A Method for Solving Stochastic Equations by Reduced Order Models and Local Approximations”, Journal of Computational Physics, Vol. 231 (2012) 6495-6513
Igusa, T. and Der Kiureghian, A.(1983).”Dynamic Analysis of Multiple Tuned and Arbitrarily Supported Secondary Systems”, UCB EERC 83-07
Iman, R.L. (1999), “Latin Hypercube Sampling”, Encylopedia of Statistical Science, Update Volume 3, John Wiley Interscience, New York