Analysis of Underwater Data using DNN
Dr. S.R.Ganorkar, Priyanka A. Wankhade
Professor, Department of Electronics &Telecommunication, Sinhgad College of Engineering, Pune, Savitribai Phule
Pune University, India
Student, Department of Electronics &Telecommunication, Sinhgad College of Engineering , Pune, Savitribai Phule
Pune University Pune, India
ABSTRACT: This paper is concerned with the detection and classification of object in underwater video. Identifying and arranging objects in frames is a vital submerged application with pertinence to maritime transportation and barrier. By taking into consideration the limitations of side scan sonar images, often introduce large infraclassvariability’s due to imaging modalities that reduces the discriminative power of any classification algorithm and limiting the possibilities of improving classification accuracy. So, to make the proposed method the robust one we are here using the k means clustering for the segmentation andDNN (Deep Neural Network) classifier is used for the classification purpose.According to the features extracted by method HOG ,we can classify the object based on RGB plane into two classes.In this proposed system, we are classifying the objects as ‘Dynamic’ and ‘Static’.
KEYWORDS: Video Frames, K-means clustering method, HOG feature extractor, DNN classifier.
I. INTRODUCTION
II. RELATEDWORK
Various authors work on the system, some of the literatures are listed below:
Naveen Kumar and ShrikantS.Narayanan[1] have detected and classified the objects in underwater images depending upon highlight and shadow features of the objects.
It has been demonstrated that a median filter eliminates impulse noise with insignificant mutilation of substantial articles and hard edges. [2]
V. Myers et.al In this paper the template matching technique is discussed. The proposed template matching technique was tried on an extensive informational collection of genuine sonar information and was appeared to beat two different techniques in view of standardized cross-connection.[3]
J. Stack et.al.This paper has introduced a future methodology for automation of underwater mine recognition that is founded on adaptive perception algorithms, and this adaption depends on new data from both ecological portrayal and incidental presentation to a human administrator [4]. This paper has analyzed various image processing techniques which can possibly help the identification and characterization of mine-like protests in side output sonar symbolism. In side sweep sonar-imaging applications, five parts of Computer-Aided Detection and Classification (CADCAC) framework are analyzed. These parts are Image preprocessing, Segmentation, Feature extraction, Computer-Aided Detection and Computer-Aided Classification. For each of these parts, picture preparing procedures with the possibility to enhance the execution of submerged mine side output sonar frameworks were talked about, and cases of fruitful or informational techniques from the writing were given. At long last, some broad picture handling contemplations basic to each imaging technique were given Introduce the chose diagram of picture preparing methods among the current frameworks and furthermore show the discovering rate of mine location. The need of human element of the mine hunting system is emphasized [5].
J. Liu et.al.This paper introduced an utterance verification method in light of dynamic garbage evaluation. Recognition and verification on isolated and continuous words are tested [6].
W. Kenneth Stewart, Min Jiang, and Martin Marraanalyzed the computerized segmentation method in the year (1994) [7].
C. T. Zahn et.al. In this paper the family of graph-theoretical algorithms in light of the negligible traversing tree are fit for identifying a few sorts of cluster structure in discretionary point sets; depiction of the identified groups is conceivable now and again by augmentations of the strategy. Brief examination is made of the utilization of group discovery to scientific classification and the choice of good component spaces for example acknowledgment. Point by point examinations of a few planar group location issues are outlined by content and figures [9].
III. SYSTEM ARCHITECTURE
The proposed system of the status classification about object inunderwaterimages is given below
• Pre Processing:
Image preprocessing typically denotes a processing step transforming a source image into a new image which is fundamentally similar to the source image, but differs in certain aspects, e.g. improved contrast. According to the above defnition, preprocessing results in changing the brightness of individual image pixels. This step includes the physical transformation of the RGB and the grayscale image.
• Image Enhancement:
Image enhancement is the process of adjusting digital images so that results are more suitable for display or further image analysis. This project is using morphological filtering techniques such as top hat and bottom hat filtering using structuring elementhaving shape disk. After that image is converted to (YCbCr)color mapping for further purpose.Morphological equations are given as follows:
For Top-hat filtering:
( ) = − ∘ (1)
For Bottom – hat filtering:
( ) = ∙ − (2)
Where, ∘ denotes the opening operation.Theopening of f by a structuring element b is the dilation of the erosion of that set i.e f.
Where, ∙ is the closing operation. The closing of f by a structuring element b is the erosion of the dilation of that set.
• Image segmentation :
The image segmentation is the way toward dividing a computerized image into various fragments i.e. sets of pixels, otherwise called super-pixels. The objective of division is to rearrange or potentially change the portrayal of a image into something that is more important and less demanding to analyze.Here, we are using K-means Clustering method for segmentation.The K-means algorithm is an technique that is used to partition an image into K clusters. The basic algorithm is
1. Pick K cluster centers, either randomly or based on some heuristic method. i.e k means clustering. 2. Assign each pixel in the image to the cluster that minimizes the distance between the pixel and the cluster
center.
3. Re-compute the cluster centers by averaging all of the pixels in the cluster.
4. Repeat steps 2 and 3 until convergence is attained (i.e. no pixels change clusters) according to Euclidian distance.
In this case, distance is the squared or absolute difference between a pixel and a cluster center. The difference is typically based on pixel color, intensity, texture, and location, or a weighted combination of these factors. K can be selected manually, randomly, or by a heuristic. This algorithm is guaranteed to converge, but it may not return the optimal solution. The quality of the solution depends on the initial set of clusters and the value of K.
Feature Extraction:
1) This step is basically responsible for extracting the key element which serves as the basis for analyzing the output. Here we are using the HOG i.e Histogram of Oriented Gradients for the feature extraction. The technique counts occurrences of gradient orientation in localized portions of an image. The HOG descriptor has a few key advantages over other descriptors. Since it operates on local cells, it is invariant to geometric and photometric transformations, except for object orientation. Such changes would only appear in larger spatial regions.
1. Gradient computation:
2. Orientation binning:
The second step of calculation is creating the cell histograms. Each pixel within the cell casts a weighted vote for an orientation-based histogram channel based on the values found in the gradient computation. The cells themselves can either be rectangular or radial in shape, and the histogram channels are evenly spread over 0 to 180 degrees or 0 to 360 degrees, depending on whether the gradient is “unsigned” or “signed”.
3. Descriptor blocks:
To account for changes in illumination and contrast, the gradient strengths must be locally normalized, which requires grouping the cells together into larger, spatially connected blocks. The HOG descriptor is then the concatenated vector of the components of the normalized cell histograms from all of the block regions. These blocks typically overlap, meaning that each cell contributes more than once to the final descriptor.
4. Block normalization:
Dalal and Triggs explored four different methods for block normalization. This project is using one of them as follows:
L1-sqrt: f =
|| || (3)
Classification:
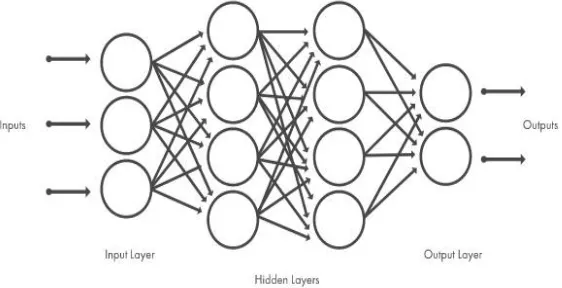
Classification is a general process related to categorization, the process in which ideas and objects are recognized, differentiated and understood.A deep neural network (DNN) is an ANN with multiple hidden layers between the input and output layers. Similar to shallow ANNs, DNNs can model complex non-linear relationships. DNN architectures generate compositional models where the object is expressed as a layered composition of primitives. The extra layers enable composition of features from lower layers, potentially modeling complex data with fewer units than a similarly performing shallow network. Deep architectures include many variants of a few basic approaches. Each architecture has found success in specific domains. It is not always possible to compare the performance of multiple architectures, unless they have been evaluated on the same data sets.DNNs are typically feedforward networks in which data flows from the input layer to the output layer without looping back.Architecture for DNN is shown in figure below.
Fig 2: Nerural Network with interconnected nodes
IV. CONTRIBUTION
V. RESULTS
1] Image Resizing: The resizing of the input image is done using ‘imresize’ MATLAB function.Figure 2 (a) and (b) represents the input image and resized image.
Fig 3 : Input and Resized Images
2] Filtering: Figure 3(a) is the resized input image andfigure 3(b) is the output enhanced image after morphological filtering i.e Top hat and Bottom hat filtering.
a.Resized Input Image b. Enhanced Image
Fig 4: Morphological Filtering Output
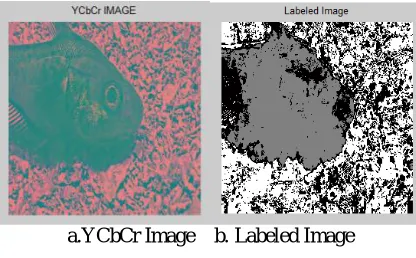
3] Color Transformation: Enhanced images aretransformed into LAB channel images for further segmentation
process. Figure 4 (a),(b) and represents the output after color transformation.
a.YCbCr Image b. Labeled Image
Fig 5: Color Transformation
Fig 6(a): Segmented image
Finally, object is detected and classifythe status as follows:
Fig 7[(a)-(b)] : Classification of status of the object
VI. EXPERIMENTAL SETUP
The MATLAB functions have been used to calculate the values of various parameters of the images.These values are used to differentiate whether a given image is containing object in sea bed or not. 175 different images are used as training and testing set. Hundred of these images are positive images where as the rest are negative images.The parameters of the two hundred images are arranged into a matrix form and fed to the Support Vector Machine.
Total data set taken: - 175 images
Out of which 76 images are related to class ‘Dynamic’ and 99 images are related to class ‘Static’. 1. For class ‘Dynamic’:
Total dynamic images: 76 images
Confusion Matrix is given below:
Detected Non detected
(Dynamic) (Static) Detected
(Dynamic) 31[TP] 7[TN]
If input is Dynamic, detected as Dynamic
If input is Dynamic, detected as Dynamic
Non detected 5[FP] 33[FN]
Accuracy = ( ) = = = 84.21%Sensitivity = = = 81.57%Specificity = = 86.84%
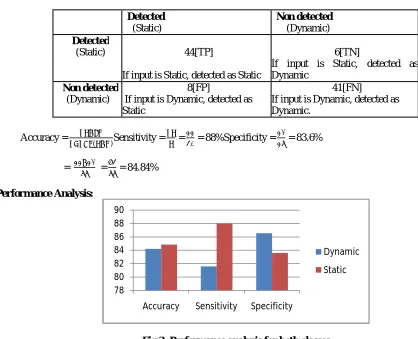
2. For class ‘Static’ :
Total dynamic images:99 images Confusion Matrix is given below:
Detected Non detected
(Static) (Dynamic)
Detected
(Static) 44[TP] 6[TN]
If input is Static, detected as Static
If input is Static, detected as Dynamic
Non detected 8[FP] 41[FN]
(Dynamic) If input is Dynamic, detected as Static
If input is Dynamic, detected as Dynamic.
Accuracy =
( )Sensitivity = = = 88%Specificity = = 83.6%
= = = 84.84%
Performance Analysis:
Fig 3: Performance analysis for both classes
According to numerical values in terms percentage are calculated using formulas and plot for both class as shown in above figure.
VII. CONCLUSION
The proposed system detects the Object Classification in Underwater Images by Using Object Features with the help of K means clustering segmentation and the DNN(Deep Neural Network) is used for the classification purpose. The accuracy of the proposed system is better than the previous methods.
78 80 82 84 86 88 90
Accuracy Sensitivity Specificity
Dynamic
REFERENCES
1. Naveen Kumar,Shrikant S. Narayanan, “Robust Object Classifiaction in Underwater Sidescan Sonar Images by using Reliability Aware Fusion
of Shadow Features”,2015
2. Anthony, R. Castellano, and Brian, C. Gray, “Autonomous Interpretation of Side Scan Sonar Returns” General Dynamics Electric Boat
Division.
3. Kenneth Stewart, Min Jiang, and Martin Marra “A Neural Network Approach to Classification of Side scan Sonar Imagery from a Miocene
Ridge Area “Member, zee, IEEE journal of oceanic engineering, vol. 19, no. 2, April 1994.
4. Caminero, D. De La Torre, L. Villarrubia, C. Martin, and L. Hernández, “On-line garbage modeling with discriminant analysis for utterance
verification,” in Proc. 4th Int. Conf. Spoken Lang., 1996, vol. 4, pp. 2111–2114.
5. V. Myers and J. Fawcett, “A template matching procedure for automatic target recognition in synthetic aperture sonar imagery,” IEEE Signal
Process. Lett., vol. 17, no. 7, pp. 683–686, Jul. 2010.
6. Stack, “Automation for underwater mine recognition: Current trendsand future strategy,” in Proc. SPIE, 2011, vol. 8017, DOI:
10.1117/12.884475.
7. “The WEKA Data Mining Software: An Update SIGKDD Explorations” Volume 11, Issue 1 Page 10-18
8. J. G. Wilpon, L. R. Rabiner, C.-H. Lee, and E. Goldman, “Automatic recognition of keywords in unconstrained speech using hidden Markov
models,” IEEE Trans. Acoust. Speech Signal Process., vol. 38, no. 11, pp. 1870–1878, Nov. 1990.
9. J. Liu and X. Zhu, “Utterance verification based on dynamic garbage evaluation approach,” in Proc. IEEE 5th Int. Conf. Signal Process., 2000,
vol. 2, pp. 819–822.
10. C. T. Zahn, “Graph-theoretical methods for detecting and describing gestalt clusters,” IEEE Trans. Comput., vol. C-20, no. 1, pp. 68–86, Jan.
![Fig 7[(a)-(b)] : Classification of status of the object](https://thumb-us.123doks.com/thumbv2/123dok_us/1393612.1172040/6.595.104.496.361.503/fig-b-classification-status-object.webp)