University of Windsor University of Windsor
Scholarship at UWindsor
Scholarship at UWindsor
Electronic Theses and Dissertations Theses, Dissertations, and Major Papers
2013
Material Logistics Management: Strategies and Methodologies
Material Logistics Management: Strategies and Methodologies
Development for Economic and Environmental Optimization
Development for Economic and Environmental Optimization
Andrea Caratti
University of Windsor
Follow this and additional works at: https://scholar.uwindsor.ca/etd
Recommended Citation Recommended Citation
Caratti, Andrea, "Material Logistics Management: Strategies and Methodologies Development for Economic and Environmental Optimization" (2013). Electronic Theses and Dissertations. 4962.
https://scholar.uwindsor.ca/etd/4962
This online database contains the full-text of PhD dissertations and Masters’ theses of University of Windsor students from 1954 forward. These documents are made available for personal study and research purposes only, in accordance with the Canadian Copyright Act and the Creative Commons license—CC BY-NC-ND (Attribution, Non-Commercial, No Derivative Works). Under this license, works must always be attributed to the copyright holder (original author), cannot be used for any commercial purposes, and may not be altered. Any other use would require the permission of the copyright holder. Students may inquire about withdrawing their dissertation and/or thesis from this database. For additional inquiries, please contact the repository administrator via email
Material Logistics Management: Strategies and Methodologies Development for
Economic and Environmental Optimization
By
Andrea Caratti
A Thesis
Submitted to the Faculty of Graduate Studies
through Mechanical, Automotive and Materials Engineering in Partial Fulfillment of the Requirements for
the Degree of Master of Applied Science at the University of Windsor
Windsor, Ontario, Canada
2013
Material Logistics Management: Strategies and Methodologies Development for
Economic and Environmental Optimization
by
Andrea Caratti
APPROVED BY:
______________________________________________
Zbigniew Pasek
Department of Industrial and Manufacturing Systems Engineering
______________________________________________
Daniel Green
Department of Mechanical, Automotive, and Materials Engineering
______________________________________________
Edwin Tam, Advisor
Department of Mechanical, Automotive, and Materials Engineering (cross appointment), Department of Civil and Environmental Engineering
iii
DECLARATION OF ORIGINALITY
I hereby certify that I am the sole author of this thesis and that no part of this thesis has been published or submitted for publication.
I certify that, to the best of my knowledge, my thesis does not infringe upon anyone’s copyright nor violate any proprietary rights and that any ideas, techniques, quotations, or any other material from the work of other people included in my thesis, published or otherwise, are fully acknowledged in accordance with the standard referencing practices. Furthermore, to the extent that I have included copyrighted material that surpasses the bounds of fair dealing within the meaning of the Canada Copyright Act, I certify that I have obtained a written permission from the copyright owner(s) to include such material(s) in my thesis and have included copies of such copyright clearances to my appendix.
iv ABSTRACT
This thesis is focused on finding solutions able to maximize logistics processes efficiency and reduce the impact of transportation on the environment at the same time.
The main purposes of the research have been two: finding strategies and methodologies for the reduction of the standard container management complexity and the development of a model for the selection of the optimal container solution both from an economic and environmental perspective.
v
DEDICATION
To my parents,
vi
ACKNOWLEDGEMENTS
This thesis is the result of the great joint venture between two prestigious universities and two leading automotive companies, and it is thanks to the support and guidance of many people from all these institutions that this work was developed.
Firstly, I would like to express my profound gratitude to the Joint Double Degree Master Program coordinators Dr. Peter Frise and Prof. Giovanni Belingardi, Mohammed Malik and Edoardo Rabino for their constant commitment to the success of this exchange program, and for giving me the opportunity to live an exceptional life, academic and professional experience. Special thanks go also to Dr. Edwin Tam from the University of Windsor and Prof. Carlo Rafele from Politecnico di Torino, for their patience and precious assistance both during the academic year and during the writing of the thesis. Moreover, I am particularly grateful also to Jan Stewart and Mike Huston, who were always very helpful throughout the whole period spent in Windsor.
I am profoundly grateful to all the people who assisted me in Chrysler and Fiat, starting from my tutors Sachin Malik, Jeffrey Moore, Stacy Schmidt, Stefano Rossi, Julien Etienne Mascolo and Nereo Pallaro as well as Olgierd Andrycz, Andrea Ronco and Eric Schimmel for their tremendous help and the efforts they put into getting over the difficulties and ensuring the great quality of my experience in both the Companies. I would like to thank also Antonio Mancina, Julie Dow and all the colleagues I worked with, who supported me both professionally and morally: Andrea Ronco, Erin Wehyer, Gail Marquette, Ron Plant, Jason Green, Jeff Casper, Janine, Pete Rospino, Sergio Bessone, Davide Scassa, Michael McDermott, Matthew Desmon, Patrick Lund (Ghafari) and David Lucke (Ryder Logistics).
Last but not least, I am profoundly grateful to Prof. Gaspare Randazzo from Politecnico di Torino and advisor of my B.Sc. in Automotive Engineering for the continuous help and support provided to me also during this important experience.
vii
TABLE OF CONTENTS
DECLARATION OF ORIGINALITY ... iii
ABSTRACT ... iv
DEDICATION ...v
ACKNOWLEDGEMENTS ... vi
LIST OF TABLES ...xv
LIST OF FIGURES ... xvii
LIST OF APPENDICES ... xxiii
LIST OF ABBREVIATIONS / SYMBOLS ... xxiv
NOMENCLATURE ...xxv
CHAPTER 1 INTRODUCTION ...1
1.1 Introduction ... 1
1.2 Problem Statement ... 2
1.3 Objectives and Hypothesis ... 3
1.4 Major Steps and Issues ... 4
1.5 Thesis Organization ... 6
CHAPTER 2 REVIEW OF LITERATURE ...8
2.1 Definitions ... 8
2.1.1 Packaging...8
2.1.2 Packaging Solution ...9
2.2 Industrial Packaging Classification and Taxonomy ... 9
viii
2.2.2 Secondary Packaging ...10
2.3 Returnable Packaging, Expendable Packaging, and Packaging Materials ... 10
2.3.1 Returnable Packaging ...10
2.3.2 Expendable Packaging ...12
2.4 Demands on Packaging ... 14
2.4.1 Logistical Aspects...14
2.4.2 Environmental Aspect ...15
2.4.3 Marketing Aspect ...15
2.5 Packaging Functions ... 15
2.5.1 Utility Function...16
2.5.2 Protection Function...17
2.5.3 Identification Function ...17
2.6 Packaging Supply Chain ... 17
2.7 Costs Affected by Packaging ... 18
2.7.1 Cost of Container Handling ...19
2.7.2 Cost of Transportation ...19
2.7.3 Cost of Quality...20
2.7.4 Cost of Packaging Disposal and Recycling ...22
2.8 Environmental Considerations on Packaging ... 22
ix
2.9 Latest Research ... 25
2.9.1 Comparison of Different Packaging Materials and Solutions on a Cost Basis for Volvo Logistic Corporation - Hamed Khademi Kord and Ali Pazirandeh ...25
2.9.2 Volvo Logistics Corporation Returnable Packaging System - Jacob Beselin Hallberg…...27
2.9.3 Automotive Supply Chain: Unlocking Potential Cost Savings in Automotive Packaging - Deloitte ...27
CHAPTER 3 ANALYSIS OF PACKAGING SOLUTIONS ...30
3.1 Expendable Cardboard Container ... 30
3.1.1 Corrugated Pallet Boxes ...32
3.1.2 Corner Supports ...32
3.1.3 Corrugated Cartons ...33
3.1.4 Interior Dunnage ...36
3.1.5 Containment of Cardboard Boxes in Unit Loads ...36
3.2 Returnable Containers ... 37
3.2.1 Plastic Returnable Containers ...38
3.2.2 Basic Information on Plastic Returnable Container Manufacturing ...42
3.2.3 Custom Racks and Standard Containers ...44
3.3 Expendable Back-Up ... 52
3.4 Ownership ... 53
x
3.6 Cleaning, Damage and Repair of Returnable Containers ... 54
3.7 Implementation of Returnable/Expendable Programs ... 55
3.7.1 Pre-Concept Meetings and Analysis ...55
3.7.2 Proposed Packaging Solution Review and Final Testing ...55
3.7.3 Containers Allocations ...56
3.7.4 Unit Loading Information in the Information System ...56
3.8 Combination Returnable and Expendable ... 56
CHAPTER 4 ANALYSIS OF MATERIAL FLOW TYPES, BENCHMARKING FIAT-CHRYSLER AND ANALYSIS FOR REDUCTION OF STANDARD CONTAINER COMPLEXITY ...57
4.1 Review of Material Flow Types and Their Requirements in the Automotive Industry (Chrysler - Fiat Case Study) ... 57
4.1.1 Just in Sequence...58
4.1.2 Just in Time ...61
4.1.3 Indirect Material Flows ...62
4.2 Benchmarking Analysis Fiat - Chrysler ... 64
4.3 Analysis for Reducing Standard Container Types ... 74
4.3.1 Benefits achievable with standard container types reduction ...74
4.3.2 Chrysler Plants Analysis for Standard Container Types Reduction ...78
CHAPTER 5 PACKAGING SELECTION MODEL CREATION...90
5.1 Technical, Ergonomics and Quality Requirements ... 90
xi
5.2.1 Railroad Boxcar ...96
5.2.2 Truckload Direct Carrier ...97
5.2.3 Intermodal ...97
5.2.4 Truckload Geographic Shipping/Receiving (GEO) ...99
5.2.5 Scheduled Delivery Program ...100
5.2.6 Dedicated Logistics Centers ...100
5.2.7 Common Carrier LTL ...100
5.2.8 Supplier Delivery/Private Carrier ...101
5.2.9 Parcel Delivery (PD) ...101
5.2.10 Emergency Methods ...101
5.2.11 Indications and Guidelines for Mode Determination...101
5.2.12 Bill of Lading ...102
5.2.13 Equipment Types and Dimensions ...102
5.3 Material Flow, Material Handling and Operational Requirements ... 103
5.3.1 Material Classification ...104
5.3.2 Material Classification, Maximum Inventory Level and Material Flow Type106 5.3.3 Container Handling Activities ...111
5.4 Creation of the Packaging Selection Macro Model ... 113
xii
5.4.2 Selection between Expendable and Returnable Containers and Choice of the
Material…. ...113
5.4.3 Selection between Standard and Specific Container ...116
5.4.4 Standard Container Type Selection ...116
5.4.5 Carbon Dioxide Emissions as Environmental Performance Measure ...117
5.5 Multi Criteria Decision Making and Decision Theory ... 119
5.5.1 Decision Theory ...119
5.5.2 Multi Criteria Decision Making (MCDM) ...120
5.6 Container Selection Model Outline and Procedure ... 121
5.6.1 Packaging Selection Model Procedure ...122
5.7 Creation of the Decision Making Tool for Selection of the Optimal Standard Packaging Solution ... 134
5.7.1 Macro Model Flow Chart ...135
5.7.2 Input Sheet ...136
5.7.3 Matrix Class-Inventory Level ...140
5.7.4 Number of Containers per Transport Vessel Computation ...140
5.7.5 Computations and Requirements Check ...141
5.7.6 Graphs and Overall Graphs ...146
5.7.7 Total Cost Evaluations...147
5.7.8 Environmental Evaluations...147
xiii
5.7.10 Overall R-Index ...148
5.7.11 Overall R-Index vs. Overall E-Index ...148
5.7.12 Cost Sensitivity Analysis ...149
CHAPTER 6 ANALYSIS OF RESULTS ...150
6.1 Outcomes of the Analysis for the Reduction of Standard Container Complexity ... 150
6.1.1 Results from Plant-Based Analyses ...150
6.1.2 Results from Overall Analysis – All Chrysler Plants ...161
6.2 Key Factors for Environmental Performance Evaluation in the Selection between Expendable / Returnable Packaging and in the Choice of the Material ... 167
6.2.1 Primary Key Factors ...168
6.2.2 Secondary Key Factors ...170
6.2.3 Additional Factors ...172
6.3 Results from Packaging Selection Model Testing with Fiat and Chrysler Data ... 173
6.3.1 Model Testing with Fiat Data ...173
6.3.2 Model Testing with Chrysler Data ...191
6.3.3 Accuracy of the Model ...204
CHAPTER 7 CONCLUSIONS AND RECOMMENDATIONS ...205
7.1 Summary ... 205
7.2 Original Contribution and Strengths of the Packaging Selection Model ... 206
7.3 Further Recommendations ... 208
xiv
7.3.2 Recommended Use of the Model ...209
7.3.3 Further Trade-Off between R-Index and E-Index ...210
7.3.4 Higher Level of Analyses – DfE Implications ...210
BIBLIOGRAPHY ...212
APPENDICES ...218
Appendix A: Packaging Selection Model Spreadsheets and Instructions ... 218
xv
LIST OF TABLES
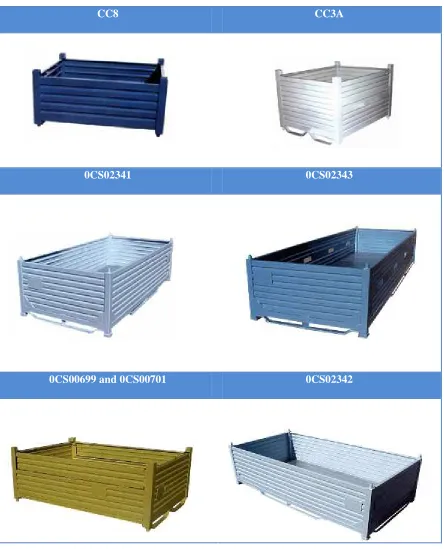
Table 3.1 – Some examples of standard non-collapsible metal bins. ... 46
Table 3.2 – Some examples of standard collapsible metal bins. ... 47
Table 3.3 – Examples of standard non-collapsible plastic bins. ... 48
Table 3.4 – Some examples of standard collapsible plastic containers. ... 50
Table 3.5 – Examples of standard totes. ... 51
Table 3.6 – Examples of standard totes with lid. ... 52
Table 4.1 – Chrysler standard containers list with dimensions (measurement unit: inches, lbs.). .. 72
Table 4.2 – Fiat/Chrysler standard container comparison. ... 73
Table 4.3 – Chrysler plastic totes similar in dimensions to Fiat plastic totes. ... 74
Table 4.4 – Example of a small portion of the list part number/associated standard packaging for Jefferson North Assembly Plant. ... 82
Table 4.5 – Number of part numbers assigned to each standard tote type, Jefferson North Assembly Plant ... 83
Table 4.6 - Percentage of part numbers assigned to each standard tote type, Jefferson North Assembly Plant ... 84
Table 4.7 - Example of standard tote dimension analysis, Jefferson North Assembly Plant. ... 88
Table 5.1 – Ergonomic weight limit requirements, lbs. ... 94
Table 5.2 – Daily ship volume – suggested ship mode. ... 101
Table 5.3 – Distance to the plant – suggested mean of transport. ... 102
Table 5.4 – Equipment types and dimensions. ... 103
Table 5.5 – Material classification. ... 105
Table 5.6 – Material classification and related maximum inventory requirement. ... 107
xvi
Table 6.1 – Cumulative percentage of part numbers assigned to each standard tote type, Sterling
Heights Assembly Plant. ... 151
Table 6.2 - Number of part numbers assigned to each standard tote type, Sterling Heights Assembly Plant. ... 153
Table 6.3 – Percentage of part numbers assigned to each standard tote type, Sterling Heights Assembly Plant. ... 154
Table 6.4 – Standard totes dimensional analysis, Sterling Heights Assembly Plant... 156
Table 6.5 – Standard totes to be kept in the standard list and to be used only as exceptions, Sterling Heights Assembly Plant. ... 157
Table 6.6 – Standard bulk containers dimensional analysis, Sterling Heights Assembly Plant. ... 160
Table 6.7 – Standard totes dimensional analysis, overall analysis. ... 162
Table 6.8 – Standard bulk containers dimensional analysis, overall analysis. ... 165
Table 6.9 – Energy use for different transport modes. ... 171
Table 6.10 – Environmental Emission Factors (from U.S. E.P.A.). ... 176
Table 6.11 – Overall R-Index and E-Index values, packaging ranking. ... 189
xvii
LIST OF FIGURES
Figure 2.1 - Example of returnable packaging. [6] ... 11
Figure 2.2 - Example of one-way packaging. [8] ... 12
Figure 2.3 - Three main aspects of packaging. [9] ... 14
Figure 2.4 - Overview of packaging aspects and functions. ... 16
Figure 2.5 - Simplified view of package production and usage cycle. ... 18
Figure 2.6 - External package dimensions. [15] ... 20
Figure 2.7 - Trade-off between packaging purchasing cost and cost of poor quality, transportation cost and material handling equipment cost. [17] ... 22
Figure 2.8 - Elements that determine the environmental impact equation in packaging. [18] ... 23
Figure 2.9 - The Financial Model based on different logistical and environmental factors for the selected packaging solutions. [9] ... 26
Figure 2.10 - Savings estimates based on Deloitte analysis of a mid-to-large sized vehicle program. [1] ... 29
Figure 3.1 – Certificate of box maker. [20] ... 31
Figure 3.2 - Breakaway pallet box with perforations on the bottom. [21] ... 32
Figure 3.3 – Example of wood corner support. [20] ... 33
Figure 3.4 – Example of possible corner support options. [20] ... 33
Figure 3.5 – Single-face cardboard. [21] ... 34
Figure 3.6 – Double face single wall cardboard. [21] ... 34
Figure 3.7 – Double face double wall cardboard. [21]... 34
Figure 3.8 – Double face triple wall cardboard. [21] ... 35
Figure 3.9 – Properly palletized unit load (side view). ... 35
xviii
Figure 3.11 – Sketch of a standard non-collapsible metal basket. [20] ... 48
Figure 3.12 – Half slotted box with cover. [15] ... 52
Figure 3.13 – Example of unit load with multiple packs. ... 54
Figure 4.1 – Build to Sequence. [23] ... 58
Figure 4.2 – External Ship to Sequence. [23] ... 59
Figure 4.3 – Internal Ship to Sequence. [23] ... 60
Figure 4.4 – Internal Pick to Sequence. [23] ... 61
Figure 4.5 – Just in Time. [23] ... 62
Figure 4.6 – Indirect flow through plant buffer. [23] ... 63
Figure 4.7 – Indirect flow through plant warehouse. [23] ... 63
Figure 4.8 – Indirect flow from consolidation center or advanced warehouse. [23] ... 64
Figure 4.9 – Fiat plastic standard totes (measurement unit: mm and kg). ... 67
Figure 4.10 – Fiat plastic bulk standard containers (measurement unit: mm and kg). ... 68
Figure 4.11 – Fiat plastic bulk standard container, high load capacity (measurement unit: mm and kg). ... 69
Figure 4.12 – Fiat steel bulk standard containers (measurement unit: mm and kg). ... 69
Figure 4.13 – Fiat steel bulk standard container (measurement unit: mm and kg). ... 70
Figure 4.14 – Fiat nest-able plastic standard totes (measurement unit: mm and kg). ... 70
Figure 4.15 – Example of warehouse equipment for standard totes. [24] ... 75
Figure 4.16 – Example of line side equipment for standard totes. [23] ... 75
Figure 4.17 – Example of return of empty containers used by two different suppliers. ... 77
Figure 4.18 – Standard containers storage area. ... 78
Figure 4.19 – Chrysler locations in Canada, U.S.A. and Mexico. ... 78
Figure 4.20 – CRATES software user interface. ... 79
xix
Figure 4.22 – Dimension analysis, example from standard totes reduction study, Jefferson North
Assembly Plant. ... 88
Figure 5.1 – Data gathering and cooperation from many company departments and Chrysler tier-1s, packaging selection model creation... 90
Figure 5.2 – Component dimension evaluation by means of Teamcenter Visualization Professional® software. ... 92
Figure 5.3 – Dimension property panel, Teamcenter Visualization Professional® software. ... 92
Figure 5.4 – Vehicle weights system, example of weight inquiry for a part number. ... 93
Figure 5.5 – Example of dunnage use for external mirrors. ... 95
Figure 5.6 – 53’ standard truckload trailer. ... 97
Figure 5.7 – Sketch of a roadrailer. [25] ... 98
Figure 5.8 – Roadrailer setup. [26] ... 98
Figure 5.9 – Stack containers. [27] ... 99
Figure 5.10 – Milk run. [28] ... 99
Figure 5.11 – Cross dock functioning scheme. [29] ... 100
Figure 5.12 – Example of storage equipment for standard plastic totes. ... 111
Figure 5.13 – Example of dolly used for container handling inside the plant, dimension constraints. [23] ... 111
Figure 5.14 – Flowchart of the macro model for packaging selection. ... 114
Figure 5.15 – Percentage of emission of carbon dioxide in the atmosphere for each human activity. [30] ... 117
Figure 5.16 – Carbon dioxide emissions in the U.S. from 1990 to 2011. [30] ... 118
Figure 5.17 – Screenshot of a part of the Input Sheet of the Standard Packaging Selection Tool. ... 136
xx
Figure 5.19 – Screenshot of part of Computations and Requirements Check spreadsheet (example
with Fiat data). ... 142
Figure 5.20 – Screenshot of part of Computations and Requirements Check spreadsheet (example
with Fiat data). ... 143
Figure 5.21 – Screenshot of part of Computations and Requirements Check spreadsheet (example
with Fiat data). ... 145
Figure 6.1 – Pareto chart for standard totes, Sterling Heights Assembly Plant. ... 152
Figure 6.2 – Number of part numbers assigned to each standard tote type, Sterling Heights
Assembly Plant. ... 153
Figure 6.3 – Percentage of part numbers assigned to each standard tote type, Sterling Heights
Assembly Plant. ... 155
Figure 6.4 – Percentage of part numbers assigned to each standard tote type, Sterling Heights
Assembly Plant. ... 157
Figure 6.5 – Number of part numbers assigned to each standard bulk type, Sterling Heights
Assembly Plant. ... 159
Figure 6.6 – Percentage of part numbers assigned to each standard bulk type, Sterling Heights
Assembly Plant. ... 160
Figure 6.7 – Percentage of part numbers assigned to each standard tote type, overall analysis. 161
Figure 6.8 – Percentage over total number of part numbers assigned to standard totes, overall
dimensional analysis. ... 163
Figure 6.9 – Percentages per height over total number of part numbers assigned to footprint class,
standard totes dimensional analysis. ... 163
Figure 6.10 – Percentage of part numbers assigned to each standard tote type, overall analysis.
... 164
Figure 6.11 – Percentage over total number of part numbers assigned to standard bulks, overall
xxi
Figure 6.12 – Percentages per height over total number of part numbers assigned to footprint
class, standard bulks dimensional analysis. ... 167
Figure 6.13 – Route from supplier to ILC and finally to assembly plant... 175
Figure 6.14 – Containers volume filling percentage. ... 178
Figure 6.15 – Containers density: number of parts inside the container. ... 179
Figure 6.16 – Investment for new containers allocated to the production program. ... 180
Figure 6.17 – Forecasted manpower cost for containers handling, entire duration of the program.
... 181
Figure 6.18 – Forecasted total shipping cost (full and empty containers), entire duration of the
program. ... 182
Figure 6.19 – Total cost components sensitivity analysis. ... 183
Figure 6.20 – Environmental impact, Kg of carbon dioxide emitted during the entire duration of
the program. ... 185
Figure 6.21 – Overall R-Index: total cost comparison index. ... 186
Figure 6.22 – Overall E-Index: environmental impact comparison index. ... 187
Figure 6.23 – Overall R-Index versus E-Index: final comparison for the selection of the optimal
solution. ... 188
Figure 6.24 – Official Unit Load Data Sheet, complete air filter... 190
Figure 6.25 – Small lot totes fill percentage, comparative analysis. ... 193
Figure 6.26 – Small lot tote density (number of parts contained), comparative analysis. ... 193
Figure 6.27 – Investment for small lot totes allocated to the production program and component
considered, comparative analysis. ... 194
Figure 6.28 – Manpower cost for small lot totes handling, entire duration of the production
program, comparative analysis. ... 195
Figure 6.29 – Manpower cost for small lot totes handling, entire duration of the production
xxii
Figure 6.31 – R-Index for small lot totes: total cost comparison index. ... 199
Figure 6.32 – E-Index for small lot totes: environmental impact comparison index. ... 200
Figure 6.33 – Overall R-Index versus E-Index: final comparison for the selection of the optimal
solution. ... 201
xxiii
LIST OF APPENDICES
xxiv
LIST OF ABBREVIATIONS / SYMBOLS
CKD Completely Knocked Down
GEO Geographic Shipment
GHG Greenhouse Gases
ILC Integrated Logistics Center
IND Indirect Flow
JIS Just In Sequence
JIT Just In Time
JNAP Jefferson North Assembly Plant
KPI Key Performance Indicator
LCA Life Cycle Assessment
LTL Less Than Truck Load
NVAA Not Value Added Activities
OEM Original Equipment Manufacturer
SHAP Sterling Heights Assembly Plant
TIS Transport Information Service
TL Truck Load
TNAP Toledo North Assembly Plant
WCL World Class Logistics
xxv
NOMENCLATURE
Daily cost for container rental
Cost for container unloading from the transport vessel and
storing in the warehouse
Cost for picking up the container from the rack in the storage area and placing it on the dolly, entire program
Cost for delivering the container from the warehouse/buffer to the line or kitting/re-packing area
Cost for picking up the empty container from the line and delivering it to the storage area
Cost for picking up the empty container or unit load (of empty totes) and load the transport vessel
Total manpower cost for container handling, entire duration
of the program
Cost per mile
Cost for container rental (entire duration of the program)
Total shipping cost, entire duration of the program
Container cost
d Decision
D Set of available decision
Optimal decision
xxvi
Distance from supplier to assembly plant
Container density (number of parts contained)
E E-Index, environmental performance comparison index
Number of available excess containers
Repair Factor
Service Factor
H Height of the container
H Height of the transport vessel load unit
Investment for containers
Inventory level for the container solution
_!" Maximum inventory level
#$ Integer
%&'(/*
Kilograms of carbon dioxide for gallon or liter of fuel
consumed
L Length of the container
L Length of the transport vessel load unit
,-/
Average mileage per gallon or liter for the selected mode of
transport
#./
Number of empty containers handled at the same time for transport vessel loading
#.0
Number of full containers handled at the same time for
transport vessel unloading
xxvii mode of transport
#1 Number of containers needed
# Number of containers to purchase
#2 Number of parts used per vehicle
N45
Number of transport vessels of empty containers that have
to be shipped, entire duration of the program
N46
Number of transport vessels of full containers that have to
be shipped, entire duration of the program
N4787
Total number of transport vessel to be shipped for full and
empty containers, entire duration of the program
#9: Number of container turns, i-year
#;<: Number of vehicle produced per hour, i-year
#=>9 Number of working days per year
o Outcome
O Set of all possible outcomes
R R-Index, total cost comparison index
? Manpower cost rate
RA6 Full/empty volume ratio of the container
B> System days at plant location
B> Total system days
$C
Time for container or unit load unloading from the transport
vessel and storing in the warehouse
xxviii
storage area and placing it on the dolly
$D
Time for delivering the container from the
warehouse/buffer to the line or kitting/re-packing area
$E
Time for picking up the empty container from the line and delivering it to the storage area
$F
Time for picking up the empty container or unit load (of empty totes) and load the transport vessel
G> Utility of a decision
G Utility if an outcome
H>: Daily production volume, i-year
H Volume mix
IJ*K Ergonomic weight limit for bulk container
IJ* Ergonomic weight limit for tote
IL Dolly load capacity
I Weight of the container
I> Dolly weight
I>M Dunnage weight
I Container load capacity
INN Most stringent weight limit
I
Overall weight (weight loaded on the transport vessel for
shipment), entire duration of the program
xxix
I! Weight of parts inside the container
W Width of the transport vessel load unit
IK Total weight for bulk container
1 CHAPTER 1 INTRODUCTION
1.1Introduction
The increasing focus on sustainability to introduce solutions that are environmentally friendly and economically viable and, consequently, aimed at reducing shipping cost, increasing logistics efficiency, safeguarding health, reducing traffic congestion, and conserving natural resources, is one of the Fiat and Chrysler Group’s principal priorities as summarized in their World Class Logistic and Green Logistic Principles.
The challenge for logistics managers is to coordinate the activities of moving materials, components and products along the supply chain, from suppliers to manufacturing sites and out to the sales network in a way that meets corporate and customer requirements, maximizes efficiency, and reduces the impact of transport on the environment.
The efficiency and environmental sustainability of logistics processes are key factors in creating value. Together with minimizing costs and optimizing freight flows, the Group’s efforts are centered on reducing environmental impact by reducing logistics-related emissions and minimizing the use of non-reusable packaging.
Packaging has a significant impact on the efficiency and effectiveness of the supply chains. Improvements can be achieved through improving and developing novel packaging logistics. In order to enable these improvements, innovative models are needed to facilitate creative and preferred packaging solution along the supply chain.
2
Data and based on Deloitte primary research interviews conducted through their Automotive Study). [1]
All these issues highlight that selecting the best packaging solution is an important and complex process which, if carried out optimally, can lead to considerable advantages by reducing the costs related to the container management, increasing the efficiency of transport, and reducing the environmental impact.
1.2Problem Statement
Fiat Group Automobiles and Chrysler LLC are currently not using a model/tool for selecting the best packaging solution from both economic and environmental perspectives. When a new vehicle model program is launched, selecting the packaging solution for each of the parts listed in the bill of materials can take a very long time. The packaging solution selection process usually starts as soon as an electronic bill of material is created by the Engineering Department and is fully completed just before the start of production (Job 1) or sometimes even later. Consequently, there is considerable room for increasing the efficiency and effectiveness of the selection and decision process.
Economic and environmental evaluations are not carried out during this selection process: the focus is on material flow and operational requirements. For example, the economic and environmental impacts in selecting an expendable versus a returnable packaging solution is not explicitly considered. These same evaluations are not carried out in selecting between different possible standard containers that meet material flow and operational requirements. One packaging solution could better optimize the saturation, or “full use” of a mode of transport with respect to another, or,it can reduce the investment in buying more containers, or decrease the manpower cost due to the handling. However, these considerations and computations are not currently part of the container selection process.
3
previous programs, are re-used, without evaluating whether new or substantially different packaging solutions that might be better from an operational, economic and environmental point of view.
Finally, a benchmarking study between Fiat Group Automobiles and Chrysler LLC highlights that Fiat is using significantly fewer container types when compared to the list of standard containers used by Chrysler. Arguably, handling fewer containers should simplify the management complexity, improve the level of standardization, and obtain greater economic and environmental benefits.
1.3Objectives and Hypothesis
This project is aimed at developing a selection and decision process that when modeled, will enable Fiat and Chrysler LLC to use this model/tool for selecting the preferred packaging solution for each part of the bill of materials, and reduce the time needed for this evaluation process. Significant economic and environmental aspects, which have not been considered until now, will be explicitly incorporated from the first stages of the container selection process.
Selecting the optimal container solution should bring savings in the total cost through a better understanding and subsequent streamlining (and ideally reduction of) the investment for new containers, logistic shipping (better saturation of the mean of transport) and handling. Moreover, elements of a life-cycle assessment approach, along with cost analysis, will underscore key factors to understand in what cases (depending on parameters such as distance, production volume, etc.) it is more convenient, both from an environmental and economic perspective, to use expendable or returnable packaging and to select the preferred macro-family of container types (plastic or steel, cardboard or wood).
4
could be an example. Also reducing the time needed to assign the appropriate container solution to all of the parts listed in the bill of materials will reduce or even eliminate the amount of temporary expendable containers needed, resulting in less overall environmental impact.
The reduction of the number of standard container types (rationalization) could be the first step towards increased logistic efficiency and sustainability. Also this action will bring savings to the Company and decrease environmental impacts, thanks to the decreased complexity in the container selection and management, possibility to increase container pooling, improved standardization of all the handling and storage equipment, reduced stocks and room occupied for each container type, as well as reducing the risk of having excess containers that cannot be used anymore when a program ends and a new one is launched.
1.4Major Steps and Issues
First, a review of the various packaging/containerization solutions as well as all possible material flow types and their requirements in Automotive Industry (Fiat and Chrysler case studies and benchmarking process) will be conducted and presented. There are many practical cases from Fiat and Chrysler plants, logistic consolidation centers (Villanova S.p.A. and Detroit Linc) and Tier-1 suppliers in the automotive industry that showcase what are the solutions currently used and how they can be benchmarked.
All current North American vehicle programs (by plant, both in the US, Canada and Mexico) have been analyzed to determine what are the containers most/least used to provide an initial scan of the container types that could be maintained and the ones that could be deleted or reduced for future programs.
5
members of Sterling Heights Assembly Plant Logistics team and Material Logistics Management team as well as with the suppliers, have provided significant additional information about the current situation and what are the main research requirements and issues to be addressed.
The methodology then examines the definition and issues for the macro-methodology for container selection is then defined. Then the methodology focuses on each requirement that has to be met by a standard container, and setting objective measures/indices to be used for comparing different solutions. In order to test and validate the model, a real case study is examined. has been considered.
Finally, a study of selected, significant is undertaken of the economic and environmental aspects of each archetype of material flow/container macro-family using aspects of Life Cycle Assessments (LCA) and through the supply chain. One main objective is to determine which key factors that, given the parameters influencing the situation, indicate what could be the best macro-family solution of packaging (expendable or returnable, plastic or steel, cardboard or wood), both from an economic and environmental point of view. Finally, the model, which is focused on standard containers, has also been implemented into an automated tool to help evaluate and then select the preferred packaging solution.
6
1.5Thesis Organization
The remainder of the thesis is organized into the following chapters.
Chapter 2 contains a literature survey related to packaging solutions, costs and
environmental issues, with a focus on the automotive field. Firstly, a background about packaging classifications and materials is provided, illustrating the main pros and cons of each solution. Then, the main packaging demands and functions on packaging and requirements to be fulfilled have been highlighted. In order to explain how a high logistic efficiency and a low environmental impact can be achieved at the same time, the main life-cycle costs affected by a packaging solution as well as the main environmental factors are described. Finally, previous research, carried out in the packaging logistics field, are reported and their results discussed.
Chapter 3 explains the packaging types and related activities carried out within Fiat
Group Automobiles and Chrysler LLC. This overview serves as a basis for understanding the issues concerning different packages, and how the packages may be handled.
Chapter 4 reviews the material flow types and how components flow through the supply
chain, and presents the various shipping dynamics and issues that would be significant to the automotive industry.
Chapter 5 outlines how various factors and issues are incorporated into the model, and
develops the series of equations that form the computations within the model. Aspects of decision theory and Multi Criteria Decision Analysis are introduced. The chapter outlines the steps followed to develop the model and how it is implemented as a selection tool.
Chapter 6 provides the results of the research and their analysis. First the output of the
7
choice of packaging material are discussed. Finally, the testing of the model using both Fiat and Chrysler practical cases as well as the sensitivity to its parameters is discussed.
Chapter 7 presents the conclusions and the recommendations. The research activity is
8 CHAPTER 2
REVIEW OF LITERATURE
2.1Definitions
2.1.1 Packaging
According to Paine, packaging is defined as a coordinated system of preparing goods for transport, distribution, storage, retailing and end-use. [2] Another definition is provided by the EC Directive 94/EC of the European Parliament and the Council on Packaging and Packaging Waste: “packaging shall mean all products made of any materials of any nature to be used for the containment, protection, handling, delivery and presentation of goods, from raw materials to processed goods, from the producer to the user or the consumer”. [3] This definition highlights different important issues related to packaging: packaging materials, functions of the packaging, type of products contained in a package, and the role of different parties involved in the packaging supply chain. The above terms can be defined within this research as:
• Packaging materials considered in this research project are limited to wood, plastic, cardboard and metal, since they are the most common in the automotive industry. • Packaging has several functions that influence the effectiveness and efficiency of
logistics activities. A total cost analysis is usually performed considering different functions and costs that a packaging solution offers through several steps within the supply chain.
9
• Finally, there is a differentiation between different types of users of packaging. In general, there are two major categories in business relations: business-to-business (B2B) and business-to-customer (B2C). The marketing function of the packaging has little or no importance in the analysis of business-to-business arrangements like the situations addressed in this research. Instead, logistical performance and environmental issues are usually the main source of requirements on B2B packaging. [4]
2.1.2 Packaging Solution
Various packaging alternatives are generally referred to as packaging solutions. These solutions range from a simple pallet to complete packaging units like containers. Small plastic totes and cardboard boxes are also considered as packaging solutions. In other words, every single or set of shaped materials that is used for product containment can be considered as a potential packaging solution.
2.2Industrial Packaging Classification and Taxonomy
Because this research will address different types of packaging solutions used in the automotive field, it helps to classify or group them into macro-categories.
2.2.1 Primary Packaging
10
need for multi-unit (secondary) packaging or they can be grouped in unit loads (a very common solution adopted for plastic totes).
2.2.2 Secondary Packaging
A number of primary packages are placed into distribution packaging mainly to achieve storage, handling and transportation efficiency. Examples of distribution packaging are wooden or plastic pallets, wooden or steel containers and large plastic containers. Small boxes like corrugated cardboard or plastic totes can be first filled with smaller products and then loaded into distribution packaging (unit loads). This arrangement provides further protection, product information, ergonomic efficiency, and so on, in addition to facilitating handling, storage and transportation. Using packaging aids/components – often called dunnage - to help prevent products from moving about and to provide further interior protection is quite common in order to fulfill all the required functionality of packaging, including protection for quality issues.
2.3Returnable Packaging, Expendable Packaging, and Packaging Materials
In the following sections, an overview is provided on various packaging materials that are commonly used in the automotive field. Materials and their characteristics usually utilized for returnable packaging will be presented first, followed by the most used materials adopted for expendable packaging.
Each packaging material has its own unique features and properties. Some materials are light weight, some are heavy, some provide good protection, and so forth. These materials can be used either individually or in combination with each other.
2.3.1 Returnable Packaging
11
Figure 2.1 - Example of returnable packaging. [6]
2.3.1.1 Plastic
Plastic is the most used material used for returnable packaging. “Plastic” refers to a range of materials with different properties, which in turns are also characterized by a wide price range. Polyethylene (PE) and polypropylene (PP) are commonly used for packaging mainly because they provide a good balance between quality and price (they are relatively inexpensive). Packages made of these plastic materials range from simple plastic bags and warping to more structured plastic totes and containers.
Polyethylene is usually classified by density into low density (PE-LD) and high density (PE-HD). Low density polyethylene has a density of approximately 0.93 - 0.94 g/PQD and it is produced by a low pressure process while high density polyethylene has a density of approximately 0.94 - 0.96 g/PQD and it is produced usually with a high pressure manufacturing process. [7]
The usual melting point temperature for polyethylene usage is approximately 105 °C for low density, while for high density is approximately 120 °C. [7] Finally, every kind of polyethylene is water resistant, so plastic packages can be used also in environments with high humidity without losing their functionality and mechanical properties.
2.3.1.2 Metal
12
Steel is an alloy of iron, which has carbon content lower than 2%. Due to its high strength, steel could be also used just for specific support parts in large packages. Steel is generally considered stronger and cheaper than aluminum but it is also much heavier.
The most important differences between aluminum and steel are the lighter weight and higher resistance to corrosion of the former with respect to the latter. However, aluminum is much more expensive since significant energy is required in its production process. The high energies required to produce new aluminum are in contrast to recycling recovered aluminum (by melting): a much smaller percentage of energy is needed. Pure aluminum cannot be used for packaging applications because it tends to be too soft and plastic: alloys of aluminum, which are strengthened, are used instead.
2.3.2 Expendable Packaging
Cardboard boxes or containers can be used as primary or secondary packaging material. Since cardboard boxes can be used only once, they are defined as one-way or expendable packaging material. Expendable packaging can be made of other materials than cardboard, such as wood. The common characteristic for one-way packaging is that it is usually discarded after it has been used once.
Figure 2.2 - Example of one-way packaging. [8]
2.3.2.1 Cardboard
13
glued to the flat layers (called liners). The plane layer makes provides strength while the corrugated layer ensures the protection against impacts.
Four different types of corrugated fiberboards can be generally distinguished and selected depending on the application needs: single-faced has one-liner and fluting, single wall has two liners on both sides of the fluting, double wall has two layers of fluting and, finally, triple wall has three layers of fluting. The higher the number of flutings is, the greater the protection against impacts.
Tests are usually performed to assess mechanical properties of paperboard packaging materials. The most important are: puncture resistance (measured as the force applied for a puncture tool to pass through a test specimen), edge crush resistance (defined as the resistance to crushing of a orthogonal test specimen of corrugated cardboard) and, finally, bursting strength (which is the resistance exerted by a specimen of cardboard to avoid the bursting when exposed to pressure). This technical info has been gathered from Transport Information Service [7]. When moisture is absorbed, mechanical characteristics of the cardboard package are affected and water absorption can also cause the damage of corrosive prone package contents.
2.3.2.2 Wood
Along with cardboard, wood is often used as expendable material in the automotive industry. Sometimes, it can also be used as returnable packaging (especially for food industry applications). As packaging material, wood is characterized by high strength and high stiffness ensuring at the same time a relatively light weight with respect to other rigid metal materials. The specific weight of wood is largely determined by the species of wood and moisture content. The average density of hard-woods can be generally assumed to be in the range between 650 kg/QD and 750 kg/QD, while it is approximately 450 - 550 kg/QD for soft-woods. [7]
14
vapor and conversely, it absorbs water vapor in a relatively moist environment, drastically changing its dimensions and losing its mechanical properties.
Wooden packages are especially suited for small-scale production and can be manufactured in various forms including containers, small boxes, crates and pallets. Moreover, for large-scale production, it is predominately used as oversea transport packages, to eliminate the significant costs associated with the return of empties.
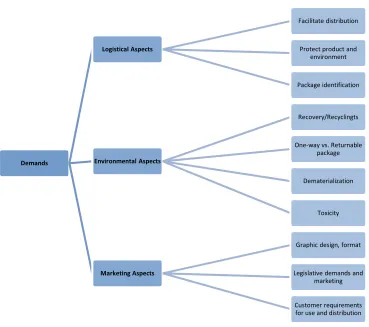
2.4Demands on Packaging
Packaging has always to meet various demands and requirements. These demands can be divided into three main aspects: logistical, environmental and marketing, as illustrated in Figure 2.3. [9]
Figure 2.3 - Three main aspects of packaging. [9]
Generally, the marketing aspect is a major concern for the retail industry, but usually automotive companies (such as Fiat and Chrysler focused in this thesis work) do not take marketing function into account if the consumer is not directly involved
2.4.1 Logistical Aspects
15
activities, etc., are all part of this important function. There is an increasing trend to view packaging in terms of the value that it provides in logistics, rather than in terms of traditional materials for the simple containment of products. [10] In fact, packaging is part of the overall logistics system and process. The goal is to minimize the cost of packaging materials as well as to reduce the cost of damage, waste and the cost of performing logistics operations. Packaging adds value mainly by providing all the required functions (presented in the section 2.5) and ensuring at the same time the lowest possible economic impact (total cost generated).
2.4.2 Environmental Aspect
The environmental function focuses at improving resource economy, reducing environmental stresses (like carbon dioxide emissions) and facilitating the reuse of packaging. A systems approach is very important when deciding on how a packaging method meets the environmental demands. Usually life cycle assessments (LCA) are needed to obtain a comprehensive and consistent evaluation about the overall environmental impact generated. [11]
2.4.3 Marketing Aspect
Packaging fulfills the market function by helping make the product more attractive. Through an appealing design and layout, the packaging has the potentiality to attract more customers. [12] According to this definition, this function is an important concern of retail industry, which deals with final customers. However, in the automotive field, packages are only used by their business customers so this aspect is usually not considered, and will not be examined in this research.
2.5Packaging Functions
16
distribution chain is exposed to so many, heavy and often conflicting demands as the packaging.
Figure 2.4 - Overview of packaging aspects and functions.
2.5.1 Utility Function
The utility function for packaging is a general term and is related to how packaging affects the productivity, efficiency and total cost of logistical operations along the supply chain. All the logistics and handling operations (such as truck loading, warehouse picking, line feeding, packaging waste reduction, etc.) are affected by packaging utility. Ergonomics can also be considered as a utility issue. In fact, healthy workers are generally more productive; conversely, personal injuries incur significant costs to the companies. The total cost for all logistics operations is affected by the utility functions of packaging, such as volume and weight efficiency, dimensional compatibility with
Demands
Logistical Aspects
Facilitate distribution
Protect product and environment
Package identification
Environmental Aspects
Recovery/Recyclingts
One-way vs. Returnable package
Dematerialization
Toxicity
Marketing Aspects
Graphic design, format
Legislative demands and marketing
17
transport vessels and handling/storing equipment, handle-ability, cleanliness, assembly/disassembly time, and overall ergonomics.
2.5.2 Protection Function
The protection function of packaging is its ability to protect a product throughout a logistical system, from the point of origin to the final point of use. Protection is an extremely important packaging function. In-transit damage can destroy all of the value added to a product during the previous processes along the supply chain. Thus, damage wastes production, logistics and environmental resources. Moreover, replacement orders add further costs and impose unnecessary (and repeated) environmental impacts. Any delays may result in lost customers and thus a long-term loss of opportunity.
2.5.3 Identification Function
The identification function of a package helps identify the material contained inside the package along with the origin of the package and destination. This process could be conducted through RFID (Radio Frequency Identification) transmitters, scanning barcodes or simple labels. Usually RFID systems are very costly, thus they are adopted for very expensive containers and in the case the number of containers lost along the supply chain is sufficiently high to justify this investment (benefit vs. costs analysis).
2.6Packaging Supply Chain
Figure 2.5 illustrates the general scheme of the packaging production supply chain. This scheme can apply to every industry (not only automotive). Within the supply chain, packages go through a number of stages in order to provide logistical utility, but, at the same time, most of these stages are associated with logistical cost and environmental impacts.
18
followed from the point it enters the supply chain until the point it is disposed or recycled.
Figure 2.5 - Simplified view of package production and usage cycle.
2.7Costs Affected by Packaging
Packaging cost is not simply related to its purchasing cost: it affects the total cost and efficiency of every logistical activity. Therefore, the impact on the productivity of logistical systems is significant. [14] In the following sections, some of the most important costs affected by packaging or their associated issues are presented. These costs will be considered in this research when developing the packaging selection model.
19 2.7.1 Cost of Container Handling
The cost for container handling is depends on the number of turns needed during the production day, and on the possibility to handle more than one package at the same time. In other words, the number of parts that can be contained (package density) and stack-ability are two key factors heavily affecting the handling efficiency performances of a packaging solution. Furthermore, the act of re-packing adds significantly to the total cost from packaging handling. The repacking can be carried out for different reasons, including ergonomic issues and company policies (i.e. World Class Manufacturing principles do not allow the usage of cardboard or wood packaging at the assembly line side). Handling time is usually lower when eliminating expendable packaging, and, therefore, there will be operational benefits for the company. Usually, expendable packaging systems also require more space at the assembly plant than a returnable packaging system because specific areas are needed to collect the immense amount of cardboard to be disposed after the usage.
2.7.2 Cost of Transportation
Costs related to transportation (shipments) depend on how well the packaging is filled (packaging density) and how well it uses the space in the vessel transporting the packages. An extremely important aspect is the stack-ability of containers and their dimensional compatibility with transport vessel dimensions so that the loading unit can be used to its full potential, which would indicate high cubic saturation.
In general, the load efficiency for transportation is higher with expendable packaging if it is possible to stack them one over the other; sometimes wooden parts are inserted in the cardboard packaging to ensure the stack-ability. This is because expendable packages often are more weight/volume efficient than returnable packages which are built with a stronger and heavier structure in order to withstand more usages.
20
defined as the relation between the volume occupied by the contained components and packaging outer volume
Transport vessel saturation, instead, is defined as the ratio between the volume of packaging loaded in the loading unit and loading unit dimensions. This parameter depends on packaging outer dimensions and their compatibility with transport vessel loading unit dimensions.
Figure 2.6 - External package dimensions. [15]
Weight efficiency is defined as the ratio between the weight of parts contained and total weight given by the sum of parts and package weight. A general requirement on the packaging is that it should be light in weight as possible. In fact, heavy goods, instead of volume, often have the weight as a limiting factor: if this happens, it would be possible to load more goods if the packaging is lighter. On the other hand, low volume and weight efficiency results in an increase of handling, transportation and warehousing costs. Thus, both volume and weight efficiencies are key factors to reduce logistic costs related to packaging and transportation.
2.7.3 Cost of Quality
21
Furthermore, the rougher the mode of transport, the more a package needs to be designed to ensure protection. Less expensive transportation modes, such as rail and road, generally have more package shaking during the travel, and so more packaging resources are required to keep the damaged goods to acceptable levels. The type of transport with the highest amount of damaged goods are border-crossing transports, where there are up to three times more transport damages than a regional or national transport. [16]
The same considerations are valid also for material handling equipment. Damage is more likely to occur for parts that are manually handled and so more robust packaging is needed, compared to components which are moved by means of automatic handling equipment.
22
Figure 2.7 - Trade-off between packaging purchasing cost and cost of poor quality, transportation cost and material
handling equipment cost. [17]
2.7.4 Cost of Packaging Disposal and Recycling
Packages at the end of the life cycle have to be disposed or recycled; this is not a negligible cost for the company. Therefore, accounting for the packaging end of life stages can be not only environmentally but also economically rewarding. All the packages that are disposed have been previously bought and have undergone many activities and steps through the supply chain (such as handling, transportation, etc.): disposal means the value of shipping is now gone, and at the very least, the container is no longer available for reuse. Reducing the amount of waste minimizes the use of expendable packaging, and should save costs for purchasing and disposal.
2.8Environmental Considerations on Packaging
23
handling packaging materials, and to also reduce the emissions generated by logistics transportation. Packaging can clearly contribute to sustainability by limiting product waste and unnecessary over production due to damage or loss. At the same time, packaging requires the use of natural resources and has a direct impact on the environment.
Recycling and reusing materials are ways to reduce the amount of resources needed to produce packaging. Figure 2.8 [18] demonstrates that theoretically there is an optimum quantity of material usage in packaging that ensures the most sustainable trade-off between reducing product wastage (due to poor quality and damages) and reducing packaging material.
Figure 2.8 - Elements that determine the environmental impact equation in packaging. [18]
Most importantly, the figure shows that also under-packing has a greater negative environmental impact than over-packaging because it results in product loss and eventual waste of all the added value.
2.8.1 Returnable Packaging vs. Expendable Packaging from an Environmental
Perspective
24
be avoided or their usage minimized (e.g., within the percentage levels allowed by environmental regulations).
When selecting between returnable and expendable packaging, it is important to view comprehensively the overall supply chain and life cycle. For instance, it is necessary to weigh the environmental impacts of maintenance, and cleaning and returning empties against the reduction in material and waste obtained by implementing a returnable packaging system instead of an expendable one. In general, a returnable packaging can be more beneficial than expendable packaging if used a certain minimum number of times during its lifetime. The number of times it has to be used, in order to be more environmentally-friendly than expendable packaging would be based on key environmental measures, such as energy consumption, solid waste, pollution, water consumption and emission into the atmosphere. [19]
25
2.9Latest Research
In this section the latest research in the packaging field is summarized, highlighting good and weak points as well as the main differences of these works with respect to the research analysis performed in this thesis.
2.9.1 Comparison of Different Packaging Materials and Solutions on a Cost Basis for
Volvo Logistic Corporation - Hamed Khademi Kord and Ali Pazirandeh
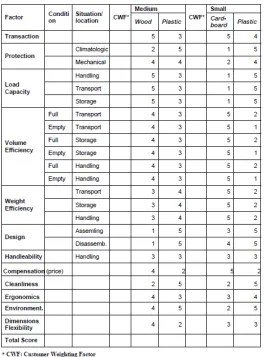
The outcome of the research made by Hamed Khademi Kord and Ali Pazirandeh in 2008 is a very general financial/comparative model, which should allow users to choose the packaging solution with the lowest possible cost. They focused their study on the Volvo Emballage Corporation, whose business concept is to provide packaging logistics services, to manufacturing industries, such as car and truck manufactures. The final conclusion, derived from the research carried out by Kord and Pazirandeh, was that there is no general optimal packaging solution. Customers have their own specific requirements, which lead to their own unique optimal packaging solution.
Various aspects (pros and cons) of different packaging solutions, available at the time of this research, have been described by them to help their customers make an optimal decision. In other words, Kord and Pazirandeh’s study could be considered as a very general decision support system for managers to decide the best available packaging solution based on different weighting factors that can be assigned to each packaging function/cost as shown in Figure 2.9.
The total score can be calculated by the summation of the multiplication of each customer weighting factor by the packaging score within each corresponding category. This could be formulated as follows:
Total Packaging Score = ∑UCustomer weighting factor for each packaging factor ∗
value corresponding to the packaging scorel
26
Figure 2.9 - The Financial Model based on different logistical and environmental factors for the selected packaging
solutions. [9]
27
2.9.2 Volvo Logistics Corporation Returnable Packaging System - Jacob Beselin Hallberg
The objectives of the work carried out by Jacob Beselin Hallberg in 2008 were to:
• Provide guidelines for calculating possible cost savings of using returnable packaging system;
• Search for relevant costs in a production plant that are measurable and affected by packaging; and
• Calculate and present different costs affected by packaging in a pre and post scenario.
The main concern with this work is that it does not investigate possible environmental effects when changing from expendable packaging to returnable packaging. In order to make a complete analysis, addressing life cycle assessments issues would have been helpful to understand what could be the best solution (returnable or expendable) from an environmental perspective. Moreover, this work does not address which is the preferred solution to be adopted from certain input parameters characterizing the investigated situation: it focuses on giving guidelines to make economic evaluations.
2.9.3 Automotive Supply Chain: Unlocking Potential Cost Savings in Automotive
Packaging - Deloitte
Through an extensive analysis carried out in 2012, Deloitte concluded that significant amount of capital is often locked in automotive parts packaging. As previously stated, in the automotive industry, packaging for inbound parts usually costs 2%–4% of the total part value. Thus, the value of packaging for 2012 annual North American part flows alone was estimated to be $5B–$10B, with approximately 30%–40% of that in standard returnable plastic containers.
In both the OEM-owned and the supplier-owned packaging scenarios, the Deloitte study revealed significant issues for the parties involved, including:
![Figure 2.1 - Example of returnable packaging. [6]](https://thumb-us.123doks.com/thumbv2/123dok_us/1417984.1174353/41.612.283.364.75.164/figure-example-of-returnable-packaging.webp)
![Figure 2.2 - Example of one-way packaging. [8]](https://thumb-us.123doks.com/thumbv2/123dok_us/1417984.1174353/42.612.263.392.467.552/figure-example-of-one-way-packaging.webp)
![Figure 2.3. [9]](https://thumb-us.123doks.com/thumbv2/123dok_us/1417984.1174353/44.612.232.419.326.497/figure.webp)
![Figure 2.6 - External package dimensions. [15]](https://thumb-us.123doks.com/thumbv2/123dok_us/1417984.1174353/50.612.236.407.233.384/figure-external-package-dimensions.webp)
![Figure 3.2 - Breakaway pallet box with perforations on the bottom. [21]](https://thumb-us.123doks.com/thumbv2/123dok_us/1417984.1174353/62.612.241.404.314.497/figure-breakaway-pallet-box-perforations.webp)
![Figure 3.4 – Example of possible corner support options. [20]](https://thumb-us.123doks.com/thumbv2/123dok_us/1417984.1174353/63.612.256.396.75.237/figure-example-of-possible-corner-support-options.webp)
![Figure 3.10 – Sketch of a rack. [20]](https://thumb-us.123doks.com/thumbv2/123dok_us/1417984.1174353/75.612.239.415.72.234/figure-sketch-of-a-rack.webp)