INTEGRATION OF SPECTRAL INFORMATION INTO SUPPORT
VECTOR MACIDNES FOR LAND COVER CLASSIFICATION
Mohd Noor Md Sap·, Mojtaba Kohram2
Faculty of Computer Science & Information Systems, University Technology ofMalaysia [email protected]
Abstract:
Support vector machines (SVM) have been widely used for classificationpurposes. These learning machines are based on classification of data through a kernel
function. Classically these kernel functions are either based the Euclidean distance of two
data vectors or their dot products. This is a general formulation which is suitable for most data
sets. However, when dealing with remote sensing images, the addition of spectral information
can add to the divisibility of the data and hence produce higher classification accuracy. In this
paper, instead of the Euclidean distance we use the spectral angle function as a differentiation
measure of two data vectors. The results show that using this method, high quality separation
is achieved leading us to believe that integration of spectral information into the SVM method
is indeed an effective approach.
Keywords: Support Vector Machines, Kernels, Spectral angle, Classification, Land Cover
1.INTRODUCTION
Increase in the quantityofremote sensing sources over the last 20 years has led to a great
amount of research being undertaken in this field. This has been boosted by strong computers
and workstations that are readily available to connnon researchers. Land cover segmentation
is a particular field of interest that has been covered extensively due to the great amount of
information that can be recovered while analyzing the high quality multispectral and
hyperspectral images available today. Numerous classical and innovative classification
techniques have been utilized to exploit this information in order to achieve high accuracy
and robustness (Jia and Richards, 2006).
Among these methods Support Vector Machines (SVMs) (Vapnik, 1998) have drawn a
great deal of attention because of their ability to map data into very high dimensions without
Jilid 19,'Bil.2 (Disember 2007) Jumal Teknologi Maklumat
INTEGRATION OF SPECTRAL INFORMATION INTO SUPPORT
VECTOR MACIDNES FOR LAND COVER CLASSIFICATION
Mohd Noor Md Sap·, Mojtaba Kohram2
Faculty of Computer Science & Information Systems, University Technology ofMalaysia [email protected]
Abstract:
Support vector machines (SVM) have been widely used for classificationpurposes. These learning machines are based on classification of data through a kernel
function. Classically these kernel functions are either based the Euclidean distance of two
data vectors or their dot products. This is a general formulation which is suitable for most data
sets. However, when dealing with remote sensing images, the addition of spectral information
can add to the divisibility of the data and hence produce higher classification accuracy. In this
paper, instead of the Euclidean distance we use the spectral angle function as a differentiation
measure of two data vectors. The results show that using this method, high quality separation
is achieved leading us to believe that integration of spectral information into the SVM method
is indeed an effective approach.
Keywords: Support Vector Machines, Kernels, Spectral angle, Classification, Land Cover
1.INTRODUCTION
Increase in the quantityofremote sensing sources over the last 20 years has led to a great
amount of research being undertaken in this field. This has been boosted by strong computers
and workstations that are readily available to connnon researchers. Land cover segmentation
is a particular field of interest that has been covered extensively due to the great amount of
information that can be recovered while analyzing the high quality multispectral and
hyperspectral images available today. Numerous classical and innovative classification
techniques have been utilized to exploit this information in order to achieve high accuracy
and robustness (Jia and Richards, 2006).
Among these methods Support Vector Machines (SVMs) (Vapnik, 1998) have drawn a
great deal of attention because of their ability to map data into very high dimensions without
much added computational complexity. In addition, their effectiveness in dealing with tlte
Hughes phenomenon (Hughes, 1968) (curse of dimensionality) and solution sparseness (only
some data points are used to achieve the fmal classification) have made them an excellent
candidate for use in remote sensing applications.
SYM separation measures are commonly based on the dot product or Euclidean distance
of the data points. These measures come in the· form of a function called the Kernel, which is
also the source of SYM's nonlinear classification. The draw back of the use of the above
mentioned methods for separation is that they do not take into account the spectral and
contextual information available in remotely acquired images. The inclusion of these features
in the Kernel function may have a positive result and lead to higher classification accuracies.
In this paper we focus on integrating the Spectral Angle function into SYM kernels. In
section 2 the basics of the SYM algorithm are outlined. Section 3 outlines Kernel functions
"
and SYM's nonlinear approach while introducing the spectral angle function. In section 4 the
basics of land cover classification are outlined. Section 5 is dedicated to experiment design.
Section 6 presents experiment results while sections 7 and 8 provide a brief discussion and a
look at future paths available.
2.THESYMApPROACH
In this section we briefly outline the SYM algorithm and its classification process. For
further discussion and a deeper understanding, readers are referred to (Vapnik, 1998; Burges,
1998). Let us start with the basic linear classification of two classes (binary classification).
Assume that the training set consists ofN data points xI where X,
em'
(i=
1, 2, ... , N). Toeach vector we assign a targetY, e {-1,+1}. Our task is to locate a hyperplane f(x)=w·x+b
which correctly classifies these data points into two classes. Among the infmite cl!issifiers
that might perform this task, SYMs select the classifier which maximizes the margin. The
margin is defmed as the distance between the classifier and the closest training points. This
task is accomplished by minimizing:
Jilid 19,'BiI. 2 (Disember 2007) Jumal Teknologi Maklumat
much added computational complexity. In addition, their effectiveness in dealing with tlte
Hughes phenomenon (Hughes, 1968) (curse of dimensionality) and solution sparseness (only
some data points are used to achieve the fmal classification) have made them an excellent
candidate for use in remote sensing applications.
SYM separation measures are commonly based on the dot product or Euclidean distance
of the data points. These measures come in the· form of a function called the Kernel, which is
also the source of SYM's nonlinear classification. The draw back of the use of the above
mentioned methods for separation is that they do not take into account the spectral and
contextual information available in remotely acquired images. The inclusion of these features
in the Kernel function may have a positive result and lead to higher classification accuracies.
In this paper we focus on integrating the Spectral Angle function into SYM kernels. In
section 2 the basics of the SYM algorithm are outlined. Section 3 outlines Kernel functions
"
and SYM's nonlinear approach while introducing the spectral angle function. In section 4 the
basics of land cover classification are outlined. Section 5 is dedicated to experiment design.
Section 6 presents experiment results while sections 7 and 8 provide a brief discussion and a
look at future paths available.
2.THESYMApPROACH
In this section we briefly outline the SYM algorithm and its classification process. For
further discussion and a deeper understanding, readers are referred to (Vapnik, 1998; Burges,
1998). Let us start with the basic linear classification of two classes (binary classification).
Assume that the training set consists ofN data points xI where X,
em'
(i=
1, 2, ... , N). Toeach vector we assign a targetY, e {-1,+1}. Our task is to locate a hyperplane f(x)=w·x+b
which correctly classifies these data points into two classes. Among the infmite cl!issifiers
that might perform this task, SYMs select the classifier which maximizes the margin. The
margin is defmed as the distance between the classifier and the closest training points. This
task is accomplished by minimizing:
subject to:
Y/'(W'X;+b)~1
q/~O
'r:/i=l, ....,N
(1)
The variables
q/
are added to the formulization to allow for misclassifications when the two classes are inseparable. The above formulation maximizes the margin, while minimizingthe errors made during classification by placing a penalty term, C, on the summation of the
errors made by the system. In practice this problem is solved in its dual form using Lagrange
multipliers. Converting to dual form, equation (1) changes into the following quadratic
optimization problem:
Maximize:
,
Subject to:
N
Ly/a;=0,
i-I
C~a/ ~O,i=l,...,N
(2)
whereby a;represent the lagrange multipliers and are bounded by the penalty parameter C,
hence resulting in the constraints occasionally being called the box constraints. This
formulization results in a decision function of the form:
(3) Usually most of the a/ in the optimal solution are equal to 0, and this results in a huge
amount of data not being responsible for classification. Only a select group of vectors called
the support vectors contribute to the solution. This feature (sparseness) of SVMs is very
useful when dealing with large datasets like hyperspectral and multispectral images.
3.KERNELS AND NONLINEAR MACHINES
The problem dealt with up to now has been to linearly classify the data, but for nonlinear
classifications SVMs make use of kernel methods. These methods consist of mapping data
into a high dimensional feature space <1>(x) in which the data can be classified by a linear machine (Figure 1).
Jilid 19,'Bil. 2 (Disember 2007) Jurnal Teknologi Maklumat subject to:
y,,(w,x,+b);d
q,~O
'Vi=I, ....,N
(1)
The variables
q,
are added to the formulization to allow for misclassifications when the two classes are inseparable. The above formulation maximizes the margin, while minimizingthe errors made during classification by placing a penalty term, C, on the summation of the
errors made by the system. In practice this problem is solved in its dual form using Lagrange
multipliers. Converting to dual form, equation (1) changes into the following quadratic
optimization problem:
Maximize:
Subject to:
N
Ly,a,=0,
'-I
C~a, ~O,i= 1,...,N
(2)
whereby a, represent the lagrange multipliers and are bounded by the penalty parameter C,
hence resulting in the constraints occasionally being called the box constraints. This
formulization results in a decision function of the form:
!(x)=sgn(La,'y,(x,·x)+b') (3)
Usually most of the a, in the optimal solution are equal to 0, and this results in a huge
amount of data not being responsible for classification. Only a select group of vectors called
the support vectors contribute to the solution. This feature (sparseness) of SVMs is very
useful when dealing with large datasets like hyperspectral and multispectral images.
3,KERNELS AND NONLINEAR MACHINES
The problem dealt with up to now has been to linearly classify the data, but for nonlinear
classifications SVMs make use of kernel methods. These methods consist of mapping data
into a high dimensional feature space ¢l(x) in which the data can be classified by a linear
machine (Figure1).
.~~o.a
~~~'Q.
[k
.
..
....
""
.
:
..
..
. .. .0.
"
" "
.
..
.
•0 • • •0 • •0 • • :
• • • aO •
.
....
.
~
...
.... .0.
"
.
.
: • •~• • 0..
.
.
.
.
. .
.
.
.
...
--Figure1.General idea of mapping data to a feature space
Taking note of equations (2) and (3) it is observed that wherever the data points appear
they are in fonn of dot products so it is convenient to define a function K as:
K(x,x;)= «I>(x)· «I>(x;)
This functionis called" the kernel function and results in the dot product of the training
vectors in feature space.Inthis manner, instead of taking on the computationally expensive
task of mapping all the data points into feature space, the kernel matrix can be computed with
much more efficiency and speed. By replacing thedatapoints with the kernel function in (2),
the following fonnulation is achieved:
while the decision function can be expressed as:
!(x)=sgn(La;·y,K(x,,x)+b·).
For a function to be categorized as a kernel that function has to fulfill Mercer's conditions
(Vapnik, 1998). These conditions are equivalent to requiring that "for any finite subset of input
space X= {xl,...,x. }, the corresponding matrix is positive semi-defInite (Cristianini, 2000)."
There are many different kernel functions in use. A number of commonly utilized kernel
functions are shown in Table 1. These functions are either based on a quadratic distance (RBF
and inverse multiquadratic) or the dot product of two vectors. Though these functions have
proved effective in many cases, they are flawed because they do not take advantage of the
immense amount of contextual and spectral information available in remote sensing images.
Jilid 19.,' Bil. 2 (Disember 2007) Jurnal Teknologi Maklumat
.~~
~~~~"
Lii
·
.. .
....
··
:.
...
• °0 • • •
.
. .
.
.
...
... :.:0.:
• • • °0 •
·
...
Figure1.General idea of mapping data to a feature space
Taking note of equations (2) and (3) it is observed that wherever the data points appear
they are in fonn of dot products so it is convenient to define a function K as:
K(x.x,)= «1l(x)' «1l(x,)
This functioniscalled the kernel function and results in the dot product of the training
vectors in feature space.Inthismanner. instead of taking on the computationally expensive
task of mapping all the data points into feature space, the kernel matrix can be computed with
much more efficiency and speed. By replacing thedatapoints with the kernel function in (2),
the following fonnulation is achieved:
while the decision function canbeexpressed as:
!(x)=sgn(La,·y,K(x,,x)+b·).
For a function to be categorized as a kernel that function has to fulfill Mercer's conditions
(Vapnik, 1998). These conditions are equivalent to requiring that "for any finite subset of input
space X= {Xl ••••' X. }.the corresponding matrix is positive semi-definite (Cristianini, 2000)."
There are many different kernel functions in use. A number of commonly utilized kernel
functions are shown in Table 1. These functions are either based on a quadratic distance (RBF
and inverse multiquadratic) or the dot product of two vectors. Though these functions have
proved effective in many cases, they are flawed because they do not take advantage of the
immense amount of contextual and spectral information available in remote sensing images.
Table1.Some commonly used kernels
Kernel FunctionK(x,x,) Type of Classifier
exp( - u\Ix - X/
Ir)
Radial Basis Function(RBF) 1
~
1+11
x-x,II!
Inverse multiquadratic (x·Xi+
I)J Polynomial of degree d tan( x .X, -e)
Multi-Layer Perceptrontanh( x .X,
+
1) SigmoidThe spectral angle (SA) function a(x,x/) is defmed to measure the angle between spectral
vectors x and Xi. Ithas the ability to exploit the characteristics described above while being
robust to energy differences (Mercier and Lennon, 2003). An application of this kernel to
target detection can be found in (Kwon and Nasrabadi, 2007). Spectral angle is defmed as:
( x·x
J
a(x, x,)=arccosII
xllll
x',11 •
Using this measure instead of the Euclidean distance, we expect to achieve a competent
classifier that takes into account the spectral signatures of each class of data. Since
la (x,X1)1 is bounded and positive, SA based kernels satisfy Mercer's conditions (Mercier and
Lennon, 2003).
4. LANDCOVER CLASSIFICATION
Land cover is one of the crucial elements for scientific research and real-life earth science
applications. For many years, global, national,· and regional managers and planners have
recognized the importance of land cover information for a variety of activities in diverse fields
such as agriculture, environment, forestry, geology, and hydrology. Due to the large scale
proliferation of remote .sensing data, they have become attractive sources of land cover
information. Several classification algorithms have been developed and successfully
implemented to produce land cover classification from multispectral data. However, these
algorithms fail to deliver high accuracies for classifying hyperspectral images (Richards,
1999).
Scientists and practitioners have made great efforts in developing advanced classification
approaches and techniques for improving classification accuracy (Pal and Mather, 2003).
However, classifying remotely sensed data into a thematic map remains a challenge because
many factors, such as the complexity of the landscape in a study area, selected remotely
Jilid 19; Bil. 2 (Disember 2007) Jumal Teknologi Maklumat
Table1.Some commonly used kernels
Kernel FunctionK(x,x,) Type of Classifier
exp( - u\Ix - X/
Ir)
Radial Basis Function(RBF) 1
~
1+11
x-x,II!
Inverse multiquadratic (x·Xi+
I)J Polynomial of degree d tan( x .X, -e)
Multi-Layer Perceptrontanh( x .X,
+
1) SigmoidThe spectral angle (SA) function a(x,x/) is defmed to measure the angle between spectral
vectors x and Xi. Ithas the ability to exploit the characteristics described above while being
robust to energy differences (Mercier and Lennon, 2003). An application of this kernel to
target detection can be found in (Kwon and Nasrabadi, 2007). Spectral angle is defmed as:
( x·x
J
a(x, x,)=arccosII
xllll
x',11 •
Using this measure instead of the Euclidean distance, we expect to achieve a competent
classifier that takes into account the spectral signatures of each class of data. Since
la (x,X1)1 is bounded and positive, SA based kernels satisfy Mercer's conditions (Mercier and
Lennon, 2003).
4. LANDCOVER CLASSIFICATION
Land cover is one of the crucial elements for scientific research and real-life earth science
applications. For many years, global, national,· and regional managers and planners have
recognized the importance of land cover information for a variety of activities in diverse fields
such as agriculture, environment, forestry, geology, and hydrology. Due to the large scale
proliferation of remote .sensing data, they have become attractive sources of land cover
information. Several classification algorithms have been developed and successfully
implemented to produce land cover classification from multispectral data. However, these
algorithms fail to deliver high accuracies for classifying hyperspectral images (Richards,
1999).
Scientists and practitioners have made great efforts in developing advanced classification
approaches and techniques for improving classification accuracy (Pal and Mather, 2003).
However, classifying remotely sensed data into a thematic map remains a challenge because
many factors, such as the complexity of the landscape in a study area, selected remotely
sensed data, and image-processing and classification approaches, may affect the success of a
classification (Richards, 1999).
Inthe next section we depict our experiment design. This section focuses on enhancing
classification by integrating spectral infonnation into the SYM algorithm. Experiments are
conducted on a hyperspectral image.
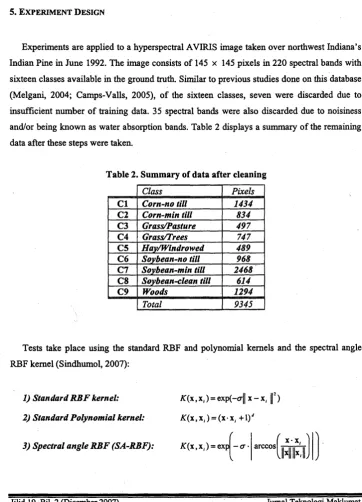
5.EXPERIMENT DESIGN
Experiments are applied to a hyperspectral AVIRIS image taken over northwest Indiana's
Indian Pine in June 1992. The image consists of 145 x 145 pixels in 220 spectral bands with
sixteen classes available in the ground truth. Similar to previous studies done on this database
(Melgani, 2004; Camps-Valls, 2005), of the sixteen classes, seven were discarded due to
insufficient number of training data. 35 spectral bands were also discarded due to noisiness
and/or being known as water absorption bands. Table 2 displays a summary of the remaining
data after these steps were taken.
Table 2. Summary of data after cleaning
Class Pixels
Cl Corn-no till
1434
C2
Corn-min till834
C3
GrassIPasture497
C4
GrasslTrees747
C5
HaylWindrowed489
C6
Soybean-no till968
C7
StJvbean-min till2468
C8
Sovbean-clean till614
C9
Woods1294
Total
9345
Tests take place using the standard RBF and polynomial kernels and the spectral angle
RBF kernel (Sindhumol, 2007):
1) Standard RBF kernel: 2) Standard Polynomial kernel:
3) Spectral angle RBF (SA-RBF):
Jilid 19, Bil. 2 (Disember 2007)
K(x,x,)=exp(-crllX-X,
f)
K(x,x,)=(x,x;+1)4
Jurnal Teknologi Maklumat sensed data, and image-processing and classification approaches, may affect the success of a
classification (Richards, 1999).
Inthe next section we depict our experiment design. This section focuses on enhancing
classification by integrating spectral infonnation into the SVM algorithm. Experiments are
conducted on a hyperspectral image.
5.EXPERIMENT DESIGN
Experiments are applied to a hyperspectral AVIRIS image taken over northwest Indiana's
Indian Pine in June 1992. The image consists of 145 x 145 pixels in 220 spectral bands with
sixteen classes available in the ground truth. Similar to previous studies done on this database
(Melgani, 2004; Camps-Valls, 2005), of the sixteen classes, seven were discarded due to
insufficient number of training data. 35 spectral bands were also discarded duetonoisiness and/or being known as water absorption bands. Table 2 displays a summary of the remaining
data after these steps were taken.
Table 2. Summary of data after cleaning
Class Pixels Cl Corn-no till
1434
C2
Corn-min till834
C3
GrassIPasture497
C4
GrasslTrees747
C5 HavlWindrowed489
C6
Sovbean-no till968
C7
Sovbean-min till2468
C8
Soybean-clean till614
C9
Woods1294
Total
9345
Tests take place using the standard RBF and polynomial kernels and the spectral angle
RBF kernel (Sindhumol, 2007):
1) Standard RBF kernel: 2) Standard Polynomial kernel:
3) Spectral angle RBF (SA-RBF):
Jilid 19, Bil. 2 (Disember 2007)
K(x,x,)=exp(-crll x-x,
f)
K(x,x,)=(X'X, +1)4
K(X,x/)=ex{-cr·1
arcc°s(II:IIII:',II)
I)·
To examine the overall performance of these kernels in the presence of different numbers
of training data, 6 different training and testing sets were randomly created, each using a
different percentage of the data set for training. The different sets consisted of 5, 10, 20, 30,
50 and 70 percent of data for training.
For each kernel, a number of hyperparameters must be tuned so that optimal results may
be achieved during fmal experimentation. To achieve this purpose the training portion of the
data was used. This data was then divided into two parts of 70% and 30%, the latter part
being used for testing while the former was used for training purposes. Using these smaller
data sets an exhaustive grid search was subsequently performed on each of the
aforementioned kernels to pinpoint the optimal values of each kernel's hyperparameters. The
next section depicts experimentation results in detail.
6.EXPERIMENT RESULTS
Preliminary analysis demonstrated the efficacy of scaling the data for testing and training.
To this aim the data was scaled between 1 and -1 in each class. This act diminishes the effect
of high numbers on classification.
Experiments on the different data sets (Table 3) show that while RBFs keep their
superiority over the other kernels, the modified SA~RBF achieves strong results and on occasion even surpasses the polynomial kernel. This demonstrates that the spectral angle RBF
is in fact a useful measure for classification. As expected the accuracy rate of the classifiers
raises as the number of training data rise, but under conditions of few training examples the
RBF classifier proves to be the best with far more accuracy than the other kernels.
Table 3. Accuracy of the Kernels under different amounts of training and testing data.
Percent of data used in training (%)
Kernel 5 10 20 30 50 70
Polynomial 83.72 89.31 91.47 91.82 93.97 95.08
RBF 85.76 90.37 92.26 92.62 94.59 95.79
SA-RBF 82.69 88.72 91.15 91.69 93.88 95.44
Jilid 19, Bil. 2 (Disember 2007) Jurnal Teknologi Maklumat
To examine the overall performance of these kernels in the presence of different numbers
of training data, 6 different training and testing sets were randomly created, each using a
different percentage of the data set for training. The different sets consisted of 5, 10, 20, 30,
50 and 70 percent of data for training.
For each kernel, a number of hyperparameters must be tuned so that optimal results may
be achieved during fmal experimentation. To achieve this purpose the training portion of the
data was used. This data was then divided into two parts of 70% and 30%, the latter part
being used for testing while the former was used for training purposes. Using these smaller
data sets an exhaustive grid search was subsequently performed on each of the
aforementioned kernels to pinpoint the optimal values of each kernel's hyperparameters. The
next section depicts experimentation results in detail.
6.EXPERIMENT RESULTS
Preliminary analysis demonstrated the efficacy of scaling the data for testing and training.
To this aim the data was scaled between 1 and -1 in each class. This act diminishes the effect
of high numbers on classification.
Experiments on the different data sets (Table 3) show that while RBFs keep their
superiority over the other kernels, the modified SA~RBF achieves strong results and on occasion even surpasses the polynomial kernel. This demonstrates that the spectral angle RBF
is in fact a useful measure for classification. As expected the accuracy rate of the classifiers
raises as the number of training data rise, but under conditions of few training examples the
RBF classifier proves to be the best with far more accuracy than the other kernels.
Table 3. Accuracy of the Kernels under different amounts of training and testing data.
Percent of data used in training (%)
Kernel 5 10 20 30 50 70
Polynomial 83.72 89.31 91.47 91.82 93.97 95.08
RBF 85.76 90.37 92.26 92.62 94.59 95.79
SA-RBF 82.69 88.72 91.15 91.69 93.88 95.44
Another experiment undertaken was to compare class by class accuracies of the various
kernels (Table 4). While the RBF function kept its superior stance over other kernels, in
some classes the proposed function actually. surpasses the RBF and polynomial kernels in
terms of accuracy. This leads to the idea that a mixture model of spectral and Euclidean
distance based kernels could achieve results of higher accuracy.
Table 4. Accuracy results of the kernels for different classes of data.
Cl
C2
C3
C4
C5
C6
C7
C8
C9
Polynomial 90.88 86.87 97.35 99.49 99.14 88.26 93.74 95.00 99.17
RBF 91.33 88.48 98.67 99.49 99.14 90.57 94.30 93.93 99.31
SA-RBF 91.18 83.64 97.79 99.74 98.71 89.31 94.06 93.93 99.31
7.DISCUSSION AND FUTURE WORK
The proximity of the results achieved from the SA based classifier to the results acquired
from the best RBF kernels suggests that this kernel can be efficiently utilized for
hyperspectral image classification. The SA based classifier achieved optimal results on some
select classes of data. Future work can tend towards extracting the characteristics of these
classes of data and exploiting this feature of the SA based kernels. For this purpose, mixed
kernels could be the answer. Different mixtures of Euclidean distance and SA based functions
could be experimented to achieve optimal results. The goal is to maintain the superior features
of these kernels while adding to this, spectral signature information whichisreadily available
in hyperspectral images.
8.CONCLUSION
In this paper the spectral angle function was used for ground cover classification of
remotely sensed images. This function was integrated into the support vector machine via the
kernel function. Using this function spectral information was successfully integrated into the
SVM algorithm and results showed thatthisapproach is in fact appropriate and can aid in the
achievement of superior classifiers which use both spectral and geometrical information fOf
classification. To this end, our future work is based on combining these two separation
features to achieve compound kernels with exceeding segregation capabilities.
Jilid 19;Bil. 2 (Disember 2007) Jumal Telcnologi Maklumat
Another experiment undertaken was to compare class by class accuracies of the various
kernels (Table 4). While the RBF function kept its superior stance over other kernels, in
some classes the proposed function actually. surpasses the RBF and polynomial kernels in
terms of accuracy. This leads to the idea that a mixture model of spectral and Euclidean
distance based kernels could achieve results of higher accuracy.
Table 4. Accuracy results of the kernels for different classes of data.
Cl
C2
C3
C4
C5
C6
C7
C8
C9
Polynomial 90.88 86.87 97.35 99.49 99.14 88.26 93.74 95.00 99.17
RBF 91.33 88.48 98.67 99.49 99.14 90.57 94.30 93.93 99.31
SA-RBF 91.18 83.64 97.79 99.74 98.71 89.31 94.06 93.93 99.31
7.DISCUSSION AND FUTURE WORK
The proximity of the results achieved from the SA based classifier to the results acquired
from the best RBF kernels suggests that this kernel can be efficiently utilized for
hyperspectral image classification. The SA based classifier achieved optimal results on some
select classes of data. Future work can tend towards extracting the characteristics of these
classes of data and exploiting this feature of the SA based kernels. For this purpose, mixed
kernels could be the answer. Different mixtures of Euclidean distance and SA based functions
could be experimented to achieve optimal results. The goal is to maintain the superior features
of these kernels while adding to this, spectral signature information which is readily available
in hyperspectral images.
8.CONCLUSION
In this paper the spectral angle function was used for ground cover classification of
remotely sensed images. This function was integrated into the support vector machine via the
kernel function. Using this function spectral information was successfully integrated into the
SVM algorithm and results showed thatthisapproach is in fact appropriate and can aid in the
achievement of superior classifiers which use both spectral and geometrical information fOf
classification. To this end, our future work is based on combining these two separation
features to achieve compound kernels with exceeding segregation capabilities.
Acknowledgments
This research was supported by the Research Management Center, University Technology
Malaysia (UTM) and the Malaysian Ministry of Science, Technology and Innovation
(MOSTI) under vote number 79094.
REFERENCES
C. J. C. Burges, "A Tutorial on Support Vector Machines for Pattern Recognition," 1998.
G. Camps-Valls andL.Bruzzone, "Kernel-Based Method for Hyperspectral Image
Classification," IEEE TRANSA CTIONS ON GEOSCIENCE AND REMOTE SENSING,
vol. 43, 2005.
N. Cristianini and J. Shaw-Taylor, Support Vector Machines. Cambridge, Uk: Cambridge
university Press, 2000.
G. F. Hughes, "On the mean accuracy of statistical pattern recognition," IEEE Trans. In!
Theory,vol. IT-14, pp. 55-63, 1968.
X. Jia and J. A. Richards, Remote Sensing Digital Image Analysis: An Introduction., 4th ed.
Berlin, NY: Springer Verlag, 2006.
H. Kwon and N. M. Nasrabadi, "Kernel Spectral Matched Filter for Hyperspectral Imagery,"
International Journal o/Computer Vision,vol. 71, pp. 127-141,2007.
F. Melgani andL.Bruzzone, "Classification of Hyperspectral Remote Sensing Images With
Support Vector Machines," IEEE TRANSACTIONS ON GEOSCIENCE AND REMOTE
SENSING,vol. 42, 2004.
G. Mercier and M. Lennon, "Support Vector Machines for Hyperspectral Image Classification
with Spectral-based kernels," in IEEE International Geoscience and Remote Sensing
Symposium,2003.
M. Pal, P.M. Mather "An assessment of the effectiveness of decision tree methods for land
cover classification" Remote Sensing of Environment, Vol. 86, pp. 554-565(12),2003.
J.A. Richards, X. Jia "Remote sensing digital image analysis: An introduction." 3rded. Berlin; New York: Springer, 1999.
Jilid 19,' Bil. 2 (Disember 2007) Jumal Teknologi Maklumat
Acknowledgments
This research was supported by the Research Management Center, University Technology
Malaysia (UTM) and the Malaysian Ministry of Science, Technology and Innovation
(MOSTI) under vote number 79094.
REFERENCES
C. J. C. Burges, "A Tutorial on Support Vector Machines for Pattern Recognition," 1998.
G. Camps-Valls and L. Bruzzone, "Kernel-Based Method for Hyperspectral Image
Classification," IEEE TRANSA CTIONS ON GEOSCIENCE AND REMOTE SENSING,
vol. 43, 2005.
N. Cristianini and J. Shaw-Taylor, Support Vector Machines. Cambridge, Uk: Cambridge
university Press, 2000.
G. F. Hughes, "On the mean accuracy of statistical pattern recognition," IEEE Trans. Inf
Theory,vol. IT-14, pp. 55-63, 1968.
X. Jia and J. A. Richards, Remote Sensing Digital Image Analysis: An Introduction., 4th ed.
Berlin, NY: Springer Verlag, 2006.
H. Kwon and N. M. Nasrabadi, "Kernel Spectral Matched Filter for Hyperspectral Imagery,"
International Journal o/Computer Vision, vol. 71, pp. 127-141,2007.
F. Melgani and L. Bruzzone, "Classification of Hyperspectral Remote Sensing Images With
Support Vector Machines," IEEE TRANSACTIONS ON GEOSCIENCE AND REMOTE
SENSING,vol. 42, 2004.
G. Mercier and M. Lennon, "Support Vector Machines for Hyperspectral Image Classification
with Spectral-based kernels," in IEEE International Geoscience and Remote Sensing
Symposium,2003.
M. Pal, P.M. Mather "An assessment of the effectiveness of decision tree methods for land
cover classification" Remote Sensing of Environment, Vol. 86, pp. 554-565(12),2003.
J.A. Richards, X. Jia "Remote sensing digital image analysis: An introduction." 3rded. Berlin; New York: Springer, 1999.
S. Sindhumol and M.Wilscy, "Hyperspectral Image Analysis -A Robust Algorithm using
Support Vectors and Principal Components," in The International Conference on
Computing: Theory and Applications, 2007.
V. N. Vapnik, Statistical Learning Theory. New York: Wiley, 1998.
Jilid 19,'BiL 2 (Disember 2007)
'l~iiMaldumat
S. Sindhumol and M.Wilscy, "Hyperspectral Image Analysis -A Robust Algorithm using
Support Vectors and Principal Components," in The International Conference on
Computing: Theory and Applications, 2007.
V. N. Vapnik, Statistical Learning Theory. New York: Wiley, 1998.