Electronic Theses and Dissertations Theses, Dissertations, and Major Papers
6-1-1986
Project T.E.A.C.H. - Alberta evaluation.
Project T.E.A.C.H. - Alberta evaluation.
Donna J. Miller University of Windsor
Follow this and additional works at: https://scholar.uwindsor.ca/etd
Recommended Citation Recommended Citation
Miller, Donna J., "Project T.E.A.C.H. - Alberta evaluation." (1986). Electronic Theses and Dissertations. 6798.
https://scholar.uwindsor.ca/etd/6798
by
Donna J. Miller
A Thesis
submitted to the Faculty of Graduate Studies and Research through the Faculty of Education
at the University of Windsor
INFORMATION TO USERS
The quality of this reproduction is dependent upon the quality of the copy
submitted. Broken or indistinct print, colored or poor quality illustrations
and photographs, print bleed-through, substandard margins, and improper
alignment can adversely affect reproduction.
In the unlikely event that the author did not send a complete manuscript
and there are missing pages, these will be noted. Also, if unauthorized
copyright material had to be removed, a note will indicate the deletion.
UMI Microform E C 54787 Copyright 2010 by ProQuest LLC
All rights reserved. This microform edition is protected against unauthorized copying under Title 17, United States Code.
ProQuest LLC
789 East Eisenhower Parkway P.O. Box 1346
note: Project TEACH
The purpose of this study was to assess the value of Project TEACH for the teachers of Alberta.
Past studies of Project TEACH were examined. Data was examined from Ontario, Ohio, Connecticut, Iowa, and British Columbia.
The Alberta study involved analyzing data collected on 521 Project TEACH questionnaires from 80.2 7
„
of the 650 original registrants in a total of 40 classes taught by 23 instructors in that province.Findings indicated that, though less enthusiastic than Ontario respondents on the same evaluation f o r m s , and despite a p ositively biased form, Alberta respondents were highly appreciative of certain aspects of the course:
the verbal skills, the strategies and skills to reduce and handle confrontation and d iscipline d e c i s i o n making.
It was found that course participants wit h only practice teaching experience were significantly more enthusiastic about the use of humour In the classroom component (z=76.079 @ £^.001), and in comparing TEACH
2
to other professional training (oo =.0004 @ £^.001).
Administrators were found to be significantly more
positive about certain aspects of the course than were regular or special teachers (namely: verbal skills, deal i n g w i t h and reducing confrontation, counselling and POWER judgement).
Further research into the needs of teacher-in-training in regard to the value of Project TEACH was recommended. In order to do this it was recommended that more college or
university education faculty should actually take the course. It was also recommended that further research be done to
assess the appropriateness of giving university credit for Project TEACH at either undergraduate or graduate level.
Further study to account for state or provincial differences in rating certain aspects of the course was recommended, especially in regard to teacher training p r a c t i c e s .
It was recommended that the present PLS Project TEACH evaluation questionnaire be revised to make it more objective toward the course.
Further research, including replication of existing follow-up studies was deemed necessary.
constantly challenged to improve their teaching
practices, and who are responding enthusiastically to helpful professional development activities.
The author would like to express thanks to:
Dr. Julius Buski of the Alberta Teachers' Association Joe Hasenstab, Ellen Dougherty and Steve Barkley of
Performance Learning Systems Inc.
Claude Bell of the Ontario Public School Teachers' Federation
Bridget Roberts of the British Columbia Teachers' Federation
Dr. Rey Carr of the University of Victoria
Colleen Beaton, Robyn Nease and Brian Donovan of the Computer Centre, University of Windsor
Dr. Nephew, Professor Ball, Dr. Powell, and Dr. Moriarty of the University of Windsor faculty
Beatrice Moore, Connie Francis, and Sharmaine Welling - typists
Amy, Mandy, Polly, and Geordie Miller Don and Dorothy Garen
Elsie and Lloyd Whiting my family
Wayne Young
Fellow graduate students and other special friends
TABLE OF CONTENTS
Page
ABSTRACT ... i
DEDICATION ... ii
ACKNOWLEDGEMENTS ... iii
INDEX TO TABLES & GRAPHS ... !... v
INDEX TO APPENDICES ... vil I INTRODUCTION AND OVERVIEW ... 1
The Problem 2 Related Literature 3 II IDENTIFICATION ... 20
Need for the Alberta Study 20 Special Definitions 21 Research Questions 22 Purpose of the Study 24 III PROCEDURE ... 25
Data Collecting(Device and Process) 26 Ethics 27 Treatment 27 IV ANALYSIS OF DATA ... 29
V SUMMARY ... 60
VI CONCLUSIONS ... 78
VII RECOMMENDATIONS ... 90
REFERENCE LIST ... 95
APPENDIX ... 98
INDEX TO TABLES AND GRAPHS
Tables Description Page
1 Connecticut Study Project TEACH Classes 5
2 Connecticut Q u e s t i o n #3 5
3 Connecticut Q u e stion #4 6
4 Connecticut Q u e stion #5 6
5 Connecticut Q u e stion #6 7
6 Connecticut Q u e s t i o n #7 7
7 Iowa Project T EACH Questions 9
8 Ohio Questions Comparable to Alberta Study 12 9 Project TEACH Study Questions Comparable 21
to Alberta's
10 Project TEACH Alberta Sample 25
11 Alberta Responses to Q u e s t i o n One 32 12 C o mparison of Alberta, Iowa and Ohio 32
Data on Q u e s t i o n One
13 Overall Rating of Project TEACH in Alberta 33 14 Overall Ratings of Project TEACH Compared 33
to O ther Studies
15 Alberta Ratings of Instructor Competency 34 16 Comp a r i s o n of Instructor Ratings in 35
Different Studies
17 Classification of Instructor Descriptors 36 18 Analysis of Instructor Descriptors in 36
Alberta
19 Comparison of Instructors in Three Studies 37 20 Project TEACH Compared to O ther P r o f e s s i o n a l 37
Training
21 O ther Professional Courses in Three Studies 38 22 Professional Courses to W h i c h Project TEACH 39
Compared in Alberta
23 Perceived Impact of Project TEACH on 41 Teaching
24 Comments on the Impact of Project TEACH 42 25 Ontario and Alberta Perceived Increase 43
in Effectiveness
26 Willingness to Complete Follow-up 44 Questionnaire (Alberta)
27 C o mparison of Follow-up Q u e s t i o n Responses 45 in Three Studies
28 Responses, by Sex, for Q u e s t i o n One 46 29 Responses, by Sex, for Q u e s t i o n Two 47 30 Responses, by Sex, re: Instructor 47
Competency
INDEX TO TABLES & G R A P H S (co n t i n u e d ) 32 Answers to Q. 1.1
Groupings
by "Years of Experience" 49 33 Answers to Q. 1.2
Groupings
by "Years of Experience" 50 34 Answers to Q. 1.3
Groupings
by "Years of Experience" 50 35 Answers to Q. 1.4
Groupings
by "Years of Experience" 51 36 Answers to Q. 1.5
Groupings
by "Years of Experience" 51 37 Responses to Q. 1
Groups
.6 by Teacher Experience 53 38 Responses to Q. 1
Groups
.7 by Teacher Experience 53 39 Responses to Q. 1
Groups
.8 by Teacher Experience 54 40 Responses to Q. 2
Groups
by Teacher Experience 54 41 Responses to Q. 3
Groups
by Teacher Experience 54 42 Responses to Q. 5
Groups
by Teacher Experience 54 43 Profiles of "Experience Groups" Rating
Q. 5
56 44 Alberta Responses to Q. 1 by Status Groups 57 45 Alberta Responses
Groups
to Q. 2 & Q. 3 by Status 58 46 Alberta Responses to Q. 5 by Status Groups 59 47 Summary of Demographic Data in Alberta
Study (Appendix A . 5)
105 48 Summary of Alberta Statistics (Appendix A . 6) 106
GRAPHS Figure 1 2 3
4
Graph Showing Ontario and Alberta Answer 43 Distribution to Q. 8
Appreciation of Humour Use by Teacher 52 Experience Groups
INDEX TO APPENDICES
A. Miscellaneous Page
.1 Sample Project TEACH Evaluation 100
Questionnaire
.2 Where Project TEACH is Offered 101
.3 The POWER Judgement 102
.4 Project TEACH Skills & Strategies 103 .5 Summary of Demographic Data from Alberta 105
Sample
.6 Summary Sheet of Alberta Responses 106 .7 Composition of Sample n=52 for Q u e stion 7 107
Analysis
.8 Alberta Project TEACH Pamphlet 108
.9 Alberta Response to Questions According to Grade levels t a u g h t ( T a b l e s )
B . References
.1 Alfonso, Firth & Neville references 114 .2 Bowling Green State U niversity Study (Ohio) 115 .3 Buttel, Theodore L.-Abstract of his Study 124 .4 College of Mount Saint Jo s e p h Survey 127
.5 Howarth, Les-Ontario Study 130
.6 Iowa Evaluation Summary 160
.7 National Education Association(NEA) 166 D escription
-.8 Ohio Education A s s o c iation & Bowling 174 Green University
.9 0PSTF(0ntario)Statistics & Evaluation 185 Summary
.10 Proposed Correlation Matrix (Alberta Study) 188 .11 Somers B.C. Study: Conclusions & 189
Recommendations
I
INTRODUCTION
"The professional growth of teachers has two aspects. The first is that aspect in w hich the individual teacher assumes responsibility for his own knowledge and competence. The second aspect is that in which the professional needs of teachers are met.
The A ssociation should develop means to motivate teachers to improve themselves and should see that opportunities are provided."
(The A.T.A. Members' Handbook, 1985, 164) In keeping with its policy of professional development, the Alberta Teachers' A ssociation (ATA) is involved in a number of activities. Part of its professional development
focus is on improving the classroom effectiveness of teachers. Relative to this focus, the AT A has contracted with Performance Learning Systems Inc. (PLS) to provide the following courses: Project TEACH (Teacher Effectiveness and Classroom
H a n d l i n g ) [ C ] , PRIDE (Professional Refinements in
Developing E f f e c t i v n e s s )[ C ] , Teaching Through Learning Channels [ C ] , and Coaching Teachers to Higher Levels of Effectiveness [ C ] .
PLS courses are offered in seventeen U.S. states, seven Canadian provinces, and the Y ukon Territory. Sixty-six
colleges and/or universities in North America grant academic credit for PLS courses, including Project TEACH. Five
Project TEACH was the first course in the education field developed by PLS. It began In Alberta in 1982
whe n the first group of instructors was trained. The A TA and PLS jointly train, and contract for the services of Alberta teachers as instructors to offer these
courses in the province.
Project TEACH was developed by synthesizing and systematizing skills and strategies modeled by master teachers. All skills are supported by research. It is a 36 hour course designed to train educators in the use of highly honed fundamental skills to improve their
teaching. The course is taught using standardized materials, format, and method. It involves the use of programmed learning workbooks, instructor and taped
m odelling skills, practice sessions involving role play, and assignments designed to be applied in schools.
Participants are positively coached in their use of skills. Project TEACH class participants share and
discuss examples and stories which illustrate the values of the specific skills and strategies covered in the c o u r s e .
The Problem
the professional development in-service courses offered. The problem presented in this study is to assess, as perceived by participants, the value and usefulness of the Project TEACH course in Alberta.
More specifically, the problem is to evaluate the degree to which the specific skills and strategies taught in Project TEACH are appreciated and deemed, by Alberta t e a c h e r s ,helpful enough to utilize in their
teaching practice.
The ATA and PLS collect evaluation questionnaires completed by all Project TEACH participants, but the data on these forms had not been summarized or formally evaluated up to the time of this study.
The purposes of this study were to summarize and evaluate the data collected on the Project TEACH
evaluation questionnaires and to make recommendations based on analysis of the data.
Related Literature
The author did an ERIC search for evaluative
literature related to Project TEACH (Teacher Effectiveness and Classroom Handling) and discovered two references.
One was a study done by Les Howarth at Brock University in 1981. It is of questionable value due to sample
course published by the National Education Association (NEA) in 1981. (See Appendices B.5 and B.7 on p. 130 and 166)
A letter written to PLS concerning evaluation of Project TEACH yielded data from: the Connecticut
Education Association, the Iowa Education Association, Buttel's Ph.D. study involving TEACH, the Ontario Public School Teachers' Federation, and the College of Mount Saint Joseph in Ohio.
Connecticut Project TEACH Data
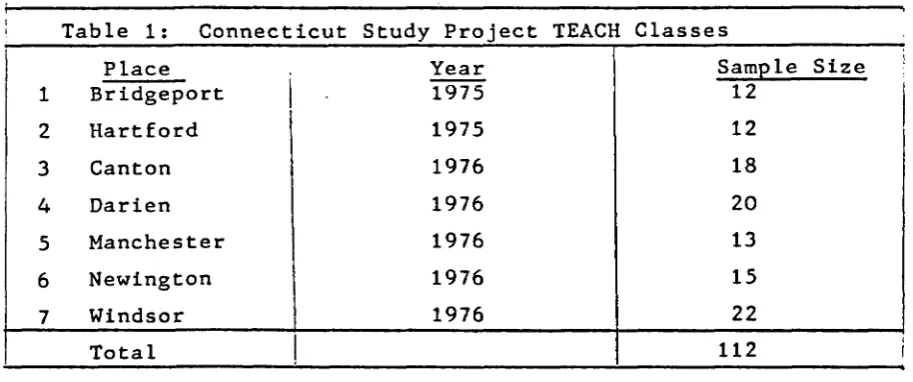
The Connecticut Education Association data dated from 1975 and 1976. It consisted of summative sheets
containing recorded answers of Project TEACH participants, from seven classes held in that state, to eight questions:
"1. What was your reason for taking the course? 2. Did the course meet your expectations? Please
specify.
3. Would you recommend the course to a colleague? Why/Why not?
4. How would you rate the seminar as a whole? 5. I feel the effectiveness/lack of effectiveness
of the course was due to ....
6. Was the format/number of sessions sufficient to meet the objectives of the course?
7. Would you be willing to re-evaluate this course six months from now, having had further time to seek to put into practice in your classroom, the techniques presented?
8. Other comments."
T a b l e 1: C o n n e c t i c u t S t u d y P r o j e c t T E A C H C l a s s e s
P l a c e Y e a r S a m p l e S i z e
1 B r i d g e p o r t 1 9 7 5 12
2 H a r t f o r d 1 9 7 5 12
3 C a n t o n 1 9 7 6 18
4 D a r i e n 1 9 7 6 20
5 M a n c h e s t e r 1 9 7 6 13
6 N e w i n g t o n 1 9 7 6 15
7 W i n d s o r 1 9 7 6 22
T o t a l 1 12
S u m m a r i e s o f t h e C o n n e c t i c u t d a t a a r e p r o v i d e d f o r
f i v e o f t h e q u e s t i o n s . ( S e e T a b l e ' s 2 , 3 , 4 , 5 & 6 )
T a b l e2 2: C o n n e c t i c u t Q u e s t i o n # 3
W o u l d v o u r e c o m m e n d t h e c o u r s e t o a c o l '
.
e a g u e ? i1
C l a s s
i
Y e s N o M a y b e
N o
R e s p o n s e T o t a l !
1 (12) 1007.
—
— —i
12
i
2 (12) 1007. - -
-I* 1
3 (18) 1007. - - - 18 i
4 (20) 1007. - - - 2 0
5
(
9) 697. (2) 157. (2) 157. - 136 (13) 877. - (2) 1 3 % - 15
7 (19) 867. (1) 57. (2) 97. — 22
T o t a l ( 1 0 3 ) 927. (3) 37. (6) 5 % — 112
C o n n e c t i c u t d a t a s u m m a r i e s w e r e p r e p a r e d b y t h e a u t h o r of
T a b l e 3: C o n n e c t i c u t Q u e s t i o n # 4
H o w w o u l d y o u r a t e t h e s e m i n a r as a w h o l e ?
C l a s s E x c e l l e n t V e r v G o o d G o o d F a i r P o o r
N o C o m m e n t
1 ( 5) 4 2 % ( 2) 1 7 % ( 4) 3 3 % (1) 8 %
2 (11) 9 2 % ( 1) 8 % - - -
-3 (13) 7 2 % ( 2) 1 1 % ( 3) 1 7 % - -
-4 ( 9) 4 5 % ( 6) 3 0 % ( 3) 1 5 % (2) 1 0 % -
-5 ( 5) 3 8 % ( 1) 8 % ( 4) 3 1 % (2) 1 5 % (1) 7%
-6 ( 5) 3 3 % ( 6) 4 0 % ( 3) 2 0 % (1) 7% -
-7 ( 5) 2 3 % ( 3) 1 4 % (11) 5 0 % (3) 1 4 % . ( 1 1 2 )
T o t a 1 (53) 4 7 % (21) 1 9 % (28) 2 5 % (8) 7% ( 1 ) . 8 % ( 1 ) . 8 %
Valid?. 4 7 . 7 % 1 8 . 9 % 2 5 . 2 % 7 . 2 % 0 . 9 % N A
T a b l e 4: C o n n e c t i c u t Q u e s t i o n # 5
E f f e c t i v e n e s s d e s c r i p t o r s
o f P r o j e c t T E A C H as r e l a t e d to i n s t r u c t o r
P o s i t i v e D e s c r i p t o r s
C l a s s S a m p l e i
C o m p e t e n t S u p p o r t i v e P o s i t i v e
S e n s e ot H u m o u r
1 12 ( 6) 5 0 % (2) 1 7 % (2) 1 7 % 0
2 12 (12) 1 0 0 % 0 0 0
3 18 (10) 5 5 . 6 % 0 0 0
4 20 ( 7) 3 5 % (2) 1 0 % (1) 5 % 0
5 13 ( 4) 3 0 . 8 % 0 0 0
6 15 ( 7) 4 6 . 7 % (4) 2 6 . 7 % (1) 6 . 7 % 0
7 22 ( 7) 3 1 . 8 % (1) 4 . 5 % (1) 4 . 5 % 0
T o t a l 1 1 2 (53) 4 7 . 3 % (9) 8 . 0 % (5) 4 . 5 % 0
N e g a t i v e D e s c r i p t o r s : ( o n l y 1 / 7 ) 0 . 9 % : n o n - d y n a m i c in c l a s s # 6
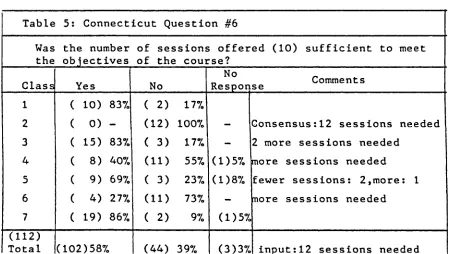
T a b l e 5: C o n n e c t i c u t Q u e s t i o n # 6
W a s the
t h e n u m b e r o b j e c t i v e s
o f s e s s i o n s o f f e r e d (10) s u f f i c i e n t to m e e t o f t he c o u r s e ?
C l a s s Y e s N o _ R e s p o n s e C o m m e n t s
1 ( 10) 837. ( 2) 177.
2 ( 0) - (12) 1007. - C o n s e n s u s : 1 2 s e s s i o n s n e e d e d
3 ( 15) 837. ( 3) 177. - 2 m o r e s e s s i o n s n e e d e d
4 ( 8) 407. ( U ) 557. (1)57. m o r e s e s s i o n s n e e d e d
5 ( 9) 697. ( 3) 237. (1)87. f e w e r s e s s i o n s : 2 , m o r e : 1
6 ( 4) 277. ( U ) 737. - mo r e s e s s i o n s n e e d e d
7 ( 19) 867. ( 2) 97. (1)57.
(112)
T o t a l (102)587. (44) 397. (3)37. i n p u t : 1 2 s e s s i o n s n e e d e d
A f t e r t h e C o n n e c t i c u t r e v i e w , P r o j e c t T E A C H w a s e x t e n d e d f r o m
a t e n - w e e k t o a t w e l v e - w e e k c o u r s e , w i t h o n e t h r e e - h o u r s e s s i o n
p e r w e e k .
T a b l e 6: C o n n e c t i c u t Q u e s t i o n # 7
W o u l d y o u b e w i l l i n g t o re-f r o m n o w ?
e v a l u a t e thi s c o u r s e s i x m o n t h s
C l a s s Y e s N o N o R e s p o n s e
1 ( 10) 837. - (2) 177.
2 ( 12) 1007. -
-3 ( 18) 1007. -
-4 ( 19) 957. (1) 57.
-5 ( 12) 927. - (1) 8 %
6 ( 12) 807. (2) 137. (1) 77.
7 ( 19) 867. (3) 147.
T o t a l (102) 917. (6) 57. (4) 4 %
H o s t C o n n e c t i c u t r e s p o n d e n t s w e r e w i l l i n g to t a k e p a r t in a
Some of the comments made to other questions asked in the Connecticut study indicated that: (i) the format was generally considered good, but some participants had difficulty relating to the tapes; (ii) many respondents took the course for academic credit; (iii) many found Project TEACH to be a superior education course which had a positive effect on their classroom interactions with students; (iv) many found the instructor competency high; (v) some would have liked more focus on primary s t u d e n t s .
Iowa Project TEACH Data
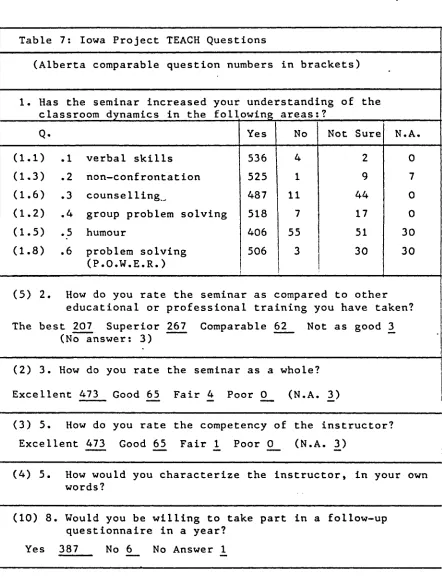
The Iowa State Education Association printed an evaluation summary in September, 1976. Their sample was comprised of 542 completed Project TEACH questionnaires.
(See the appendix'copy of the Iowa summative questionnaire)
The Iowa questionnaire contained a number of
questi-ons which were comparable to those on the official Project TEACH questionnaire used in Alberta. (See Table 7 on the following page). Some Iowa data follows.
1. H a s t he s e m i n a r i n c r e a s e d y o u r u n d e r s t a n d i n g of t h e c l a s s r o o m d y n a m i c s in the f o l l o w i n g a r e a s : ?
Q. Y e s N o N o t S u r e N.A.
(1.1) .1 v e r b a l s k i l l s 536 4 2 0
(1.3) .2 n o n - c o n f r o n t a t i o n 5 25 1 9 7
(1.6) .3 c o u n s e l l i n g ^ 487 11 4 4 0
(1.2) .4 g r o u p p r o b l e m s o l v i n g 5 18 7 17 0
(1.5) .5 h u m o u r 406 55 51 3 0
(1.8) .6 p r o b l e m s o l v i n g ( P . O . W . E . R . )
506 3 30 3 0
(5) 2. H o w do y o u r a t e t h e s e m i n a r as c o m p a r e d to o t h e r e d u c a t i o n a l or p r o f e s s i o n a l t r a i n i n g y o u h a v e t a k e n ?
T h e b e s t 207 S u p e r i o r 267 C o m p a r a b l e 62 N o t as g o o d ( No a n s w e r : 3)
3
(2) 3. H o w do y o u r a t e t he s e m i n a r as a w h o l e ?
E x c e l l e n t 4 73 G o o d 65 F a i r 4 P o o r 0 (N.A. 3)
(3) 5. H o w do y o u r a t e the c o m p e t e n c y of t h e i n s t r u c t o r ?
E x c e l l e n t 473 G o o d 65^ F a i r 1_ P o o r 0 _ (N.A. 3^)
(4) 5. H o w w o u l d y o u c h a r a c t e r i z e t he i n s t r u c t o r , in y o u r o w n w o r d s ?
(10) 8. W o u l d y o u be w i l l i n g to t a k e p a r t in a f o l l o w - u p q u e s t i o n n a i r e in a y e a r ?
Question number six on the Iowa questionnaire yielded some data on the ways in which the respondents found Project TEACH helpful. They indicated that the course had helped them to:
1. think more clearly before making decisions 2. make fewer impulsive decisions
3. find a reduction in confrontational situations 4. deal more constructively with confrontational
situations
5. communicate better with students
6. make better decisions in use of time and energy 7. understand group dynamics better
8. read their own and students' body language better 9. feel more relaxed and smile more
10. feel better or less tired at the end of the day 11. think their students liked them and school more.
The Iowa summary also included a record of comments made. These were compared to Alberta comments about Project TEACH (See page 9 ) and were very similar.
The Iowa data was comparable to Alberta data in sample size and on a number of questions. (See page 12) Ohio Project TEACH Data
study data summary sheets are included in Appendix B.8. The Ohio study compared the responses of teachers according to whether they were elementary or secondary teachers and according to three categories of teaching experience: 0 - 5 years, 6 - 1 0 years, and 10-plus years.
Based on numerical tabulation and arithmetical mean scores the Ohio study found Project TEACH to be successful for both elementary and secondary teachers at all
experience levels at increasing the following behaviors: 1. Changing knowledge, attitudes and skills in the
classroom.
2. Discerning student resistance from body language, tonality and words, and using the Project TEACH supportive skills to overcome these resistances. 3. Thinking carefully before deciding to keep the
power, share the power or give the power and then to use the skills congruent with that decision.
4. Using "momentum strategies" in order to maintain the class concentration.
5. Using "non-confrontation strategies" in appropriate situations.
6. Using "approval statements", "student
satisfactions", and "positive phrasing" to produce positive student classroom behavior. 7. Using the principles of the "P.O.W.E.R.
i
f T a b l e 8 : 0 h i o P r o j e c t T E A C H Q u e s t i o n s A p p l i c a b l e to A l b e r t a S t u d y
O h i o Q u e s t i o n No. C o r r e s p o n d i n g A l b e r t a Q u e s t i o n N o
A. 1 1.1
A . 6 1.1
A . 2 1.3
A . 5 1 . 4
A . 3 • CO
A . 11 T—I • CO
B . 2 , B.3, B.4, B . 5 , B.6 , B . 1 0 7
The Ohio study Project TEACH participants found that the "Research Booklet" helped them understand proven practices in teaching.
The Ohio study found that elementary teachers, and teachers with over five years of experience, used
"motivational strategies" more than did secondary
teachers or teachers with under five years of experience. Other findings from the Ohio study were that
Project TEACH:
1. increased confidence in teaching skills
2. changed attitudes positively toward teaching and students
3. gave teachers a psychic lift
4. clarified practice of teaching as a precisely defined art.
5. led to a moderate overall improvement in teaching effectiveness.
1978 which examined the effect of Project TEACH in
modifying teacher behavior. His study involved a sample of 72, with 36 each in the experimental and control
groups. He concluded that Project TEACH did significantly change teacher behavior in the following ways: (Appendix A . 4 explains asterisked (*) terms below)(Appendix A . 4, p p . 103, 104)
1. Project TEACH increased the number of verbal skills options used by teachers.
2. Project TEACH increased the supporting verbal skills used by teachers.
3. Project TEACH increased the "Problem Solving Inquiries" and "Contingent Action Proposals" used by teachers.*
4. Project TEACH decreased the "Authority Statements", Disapproval Statements" and the "Negative Statements" used by teachers.*
Since the Buttel study does not directly relate to the present one, its abstract only will be Included in the appendix. (Seen Appendix B.3 , p . 124)
Ontario Data re: Project TEACH
the same questionnaire as is used in Alberta. They provide cumulative data each summer to questionnaire numbers two, three, five, and eight. (See Appen d i x B.9, p . 185)
In 1981 the Ontario total sample p opulation was 3,036. In 1982 their total sample p o pulation had risen to 3,795. By the summer of 1985 the cumulative
p o pulation was 5,277. Ontario data was impressive
because of the large sample involved over several years. (Ontario Project TEACH cumulative summary sheets are in A p p endix B.9, p. 185)
In 1982, 71.07o of the Ontario respondents rated Project TEACH as excellent, while in 1985 the cumulative data showed 72.57® rating it excellent. This relates to
question two on the Alberta questionnaire.
Re garding instructor competency, (question number three) in 1982, 82.77> of the respondents rated their instructors as excellent, compared to 84.47® on the 1985 cumulative record.
In rating Project TEACH as compared to other professional training, the 1982 figure was 55.7% as "among the best" while the 1985 figure was 57.27® "among the best".
in effectiveness of working w ith students as a result of taking Project TEACH, the 1982 group had 46.470 estimating a 407o increase, while in. 1985 figures showed 45.87. averaging an estimate of 407» change.
The Ontario summaries included some demographic information but it was not related statistically to other questions. (See Appendix B.9,p.l85)
British Columbia
In The B.C. T e a c h e r , March, 1985 w hich looked at teacher and school effectiveness, two articles referred to Project TEACH.
In MA n Open Letter on British Columbia's Educational Effectiveness Programs" Linda Kaser
stressed that there is no one recipe for effectiveness in the classroom. She made the point that "No recipe suits everyone's tastes, every time, every where"
( op cit, 9). She continues:
I think all of the approaches have something to offer unless they are handled in an
autocratic no-way-but-this-way fashion and some I quite like: Young Writers, naturally, Teacher Effectiveness and Classroom Handling
(TEACH), Teacher Expectations, and Student Achievement (T E S A ) , and Effective Teaching Practices (a broadened version of
Instructional Theory into Practice).
effectiveness researchers: Stallings, Rosenshine,
Evertson, et al. Kaser, who at that time was working for the B.C. M i n i s t r y of E d u c a t i o n ’s Program Effectiveness
Branch, reported experience w ith many packaged in-service programs, as well as observation in schools where teachers had been involved in high quality effective teaching
p r o g r a m s . Kaser reported vete r a n teacher enthusiasm with sources which reminded them "of things they already kne w about good teaching" and w h i c h gave them "a shared
professional vocabulary w ith which to discuss their work". K aser also mentioned ho w whole school staffs were involved w i t h TEACH, TESA, or Madeline Hunter programs and in
observing each other teach.
In "Canadian Perspective on Effectiveness Programs" Geraldine Gilliss reports that "widespread use is made of commercial materials such as Project TEACH and PRIDE, which are effectiveness oriented and have some basis in research"
(op cit, 16). She concludes:
it is reassuring that informal links among practitioners are forming and that genuine attempts are being made to explore the total li terature In the area, rather than rely on packaged presentations.
These B.C. references are of interest in this study because they provide a vie w of the context of teacher
Somers B.C. Study
An enquiry to the British Columbia Teacher's Federation led to the location of an evaluation of Project TEACH done by Pat Somers. Somers, did a follow-up study of Project TEACH in British Columbia in 1982 with course participants a year or more after their completion of the course. She met with TEACH instructors to determine concerns for the follow-up questionnaire which she constructed. Choosing from
a total population of 1,000, Somers sent her questionnaire to 350, randomly selected, B.C. Project TEACH graduates. Her final report was based on 75 returns (a 217. return rate). The Somers questionnaire had 50 questions.
Her questions did not directly relate to those asked on the Project TEACH evaluation questionnaire, but the summary and conclusion of her study were relevant to the Alberta study, and have been included in the
Appendix B.ll along with a copy of her questionnaire. This study will also comment on the Somers conclusions
in its concluding section. Because the Somers sample only represented 7.57» (not a random sample)of the B.C. Project TEACH graduates, her findings should be
College of Mount Saint Joseph Study
In 1983, the College of Mount Saint Joseph in Ohio released the results of a survey of 423 graduate
education teachers who had taken Project TEACH and
PRIDE two to seven years earlier. Most of the questions used in this survey were not directly applicable to
the Alberta study. Data was not comparable to Alberta data because it involved a mix of PRIDE and Project TEACH data together.
A summary of the Mount Saint Joseph study data
may be found in the Appendix B.4. (See Appendix B.4,p . 127) The Mount Saint Joseph survey had respondents
compare the Project TEACH course and instructors to other graduate level courses and instructors. Their findings were very positive. However on some questions the questionnaire almost guaranteed positive results because of the categories from which respondents were asked to choose. The rating scales offered more
positive response choices than negative response choices: Excellent, Very Good, Good, Fair, Poor;
(It should be noted that the Alberta study was based on a questionnaire which also had a positive bias.) Other
These authors mentioned the popularity of the course. They suggested that higher education
institution "traditional offerings have been missing the mark". (Alfonso, Firth, and Neville, op cit, p. 406)
They underlined the need for such courses to be part of a comprehensive staff development plan so that they would be relevant to school staff and
appropriately followed up and built u p o n by instructional s u p e r v i s o r s .
In 1985, PLS published a book called Teaching — wit h T . E . A . C . H . . In the introduction Church and
Has e n s t a b stated: "Project TEACH builds the successful effective verbal structures independent of grade
level or teaching styles".
II
IDENTIFICATION
This chapter will deal with the need for the Alberta study, definitions of special terms used in Project TEACH,delineation of the research questions investigated, and the purpose of this study.
Need for the Alberta Study
The review of the literature regarding Project TEACH revealed that only three of the seventeen U.S. states involved with Project TEACH have had studies done on it: Connecticut, Iowa, and Ohio.
In C a n a d a , of the seven provinces and one
territory which have been teaching the course only two have had studies done Project TEACH: B.C. and Ontario.
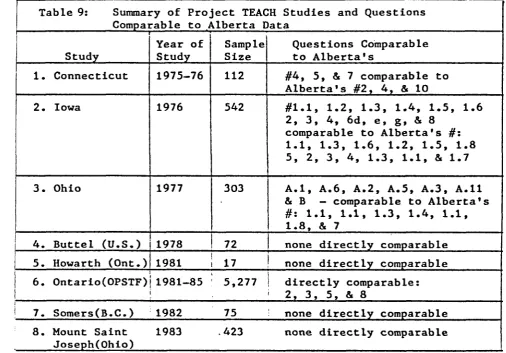
Only four of the eight Project TEACH studies completed have had questions directly comparable to those on the official Project TEACH evaluation
questionnaire now in use. (See Table 9, p. 21) A comprehensive study of Alberta participant teacher responses to the official Project TEACH
Table 9: Summary of Project TEACH Studies and Questions Comparable to Alberta Data
Study
Year of Study
Sample Size
Questions Comparable to Alberta's
1. Connecticut 1975-76 112 #4, 5, & 7 comparable to Alberta's #2, 4, & 10
2. Iowa 1976 542 #1.1, 1.2, 1.3, 1.4, 1.5, 1.6
2, 3, 4, 6d, e, g, & 8 comparable to Alberta's #: 1.1, 1.3, 1.6, 1.2, 1.5, 1.8 5, 2, 3, 4, 1.3, 1.1, & 1.7
3. Ohio 1977 303 A . 1, A.6, A.2, A.5, A.3, A.11
& B — comparable to Alberta's #: 1.1, 1.1, 1.3, 1.4, 1.1,
1.8, & 7
4. Buttel (U.S.) 1978 72 none directly comparable
5. Howarth (Ont.) 1981 i! 17 i! none directly comparable
6. Ontario(OPSTF) 1981-85 ' 5,277 | directly comparable: ( 2, 3, 5, & 8
! 7. Somers (B.C. ) 1982______ 75____ ! none directly comparable________
8. Mount Saint 1983 .423 none directly comparable _____ Joseph(Ohio)
Special Definitions
All terms used on the Project TEACH evaluation questionnaire were understood by course participants, (see top of next page) The course teaches 12 specifically labelled verbal
skills and 19 defined teaching strategies for the purposes of: communicating effectively w ith students, resolving problems, dealing with confrontational
winnability. (Summaries of the skills, strategies, and terms taught in Project TEACH may be found in the Appendix A . 3, p. 102 and A.4, pp. 103- and 104)
POWER refers to: Problem Identification, Ownership of the problem (whether it be teacher, student, or a shared responsibility to solve the p r o b l e m ) , Winnability
(which refers to the specific goal most likely to be
met to successfully solve the problem at hand), Evaluation of which skills or strategies could effectively be used to meet the specific goal, and Reinforcement(which refers to the specific behaviors or methods the teacher will use to maintain the desired student behavior which was
the desired goal of the problem solving exercise). (The POWER Judgement worksheet from Project TEACH may be found in the Appendix A . 3, p. 103)
The term "seminar" on the evaluation questionnaire is understood to refer to Project TEACH, PLS copyrighted course, as defined in the Introduction section of this t h e s i s .
Research Questions
The research questions followed the numbering format of the Project TEACH questionnaire (which may be found In Appendix A.l, p.114 )
The study investigated the following:
1. Did Project TEACH help participants to
.1 using the (12) verbal skills to communicate with students
.2 using the verbal skills to resolve problems
.3 dealing with confrontational situations .4 reducing t h e .possibility or
confrontation
.5 using humour in the classroom .6 counselling with parents/students .7 group dynamics
.8 discipline decision-making (POWER J u d g e m e n t )
2. How did participants rate the course overall?
(excellent, good, fair or poor?) (Note positive bias) 3. How did participants rate instructor competency?
(excellent, good, fair or poor?) (Note positive bias) 4. How did participants describe instructors?
5. How did participants rate Project TEACH as
compared to other professional training they had received?
(The best, among the best, comparable to most or not as good.) (Note positively biased wording) 6. To what "excellent" professional training was
Project TEACH being compared? (Note bias) 7. What practical impact did Project TEACH have
on p a r t i cipants1 teaching, in their opinion? 8. Conservatively, what percentage increase in
effectiveness with students did respondents foresee as a result of taking Project TEACH? 9. How many respondents gave permission for their
comments to be quoted?
10. How many respondents were willing to complete a follow-up questionnaire a year later?
(Two additional research questions were posed in this study: In regard to Question 3. namely
11. Would the overall rating of instructor competency increase for successive c l a s s e s •taught by the same instructor?
(In regard to Questions 1, 2, 3, & 5.:)
12. Would ratings of the course and instructor vary significantly according to:?
a) sex of the respondents b) grade levels taught
c) total years of teaching experience
d) whether the respondents were in specialist positions such as special educators,
librarians, or counsellors
e) whether the respondents were administrators. Purpose of the Study
The purpose of this study was to analyze,
comprehensively, the data generated on the Project TEACH evaluation forms in Alberta, comparing, where possible, to studies done elsewhere, in order to
PROCEDURE
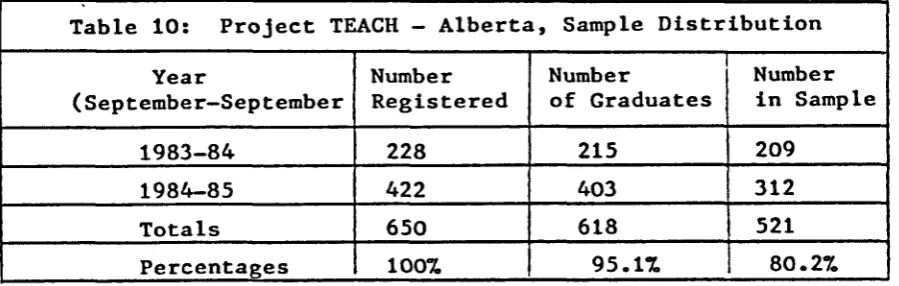
The sample for this study consisted of completed Project TEACH evaluation questionnaires from 521 Alberta Project TEACH participants. Evaluation questionnaires were collected by the Alberta Teachers' Association (ATA) which sponsors the course in that province. The
following table (Table 10) shows sample distribution.
Table 10: Project TEACH - Alberta, Sample Distribution
Year
(September-September
Number Registered
Number
of Graduates
Number in Sample
1983-84 228 215 209
1984-85 422 403 312
Totals 650 618 521
Percentages 100% 95.1% 80.2%
The sample represents 80.27* of the total population of 650 who registered in Alberta Project TEACH classes, and 84.37* of the 618 graduates of Alberta Project TEACH courses in Alberta between September 1, 1983 and
September 1, 1985.
The 1983-84 sample represented 91.77* of the original registrants and 97.27* of the graduates for that year.
Data Collecting
Data was collected on the official PLS-developed Project TEACH E v aluation Questionnaire, w hich is included in the back of each programmed w o r k b o o k supplied to
each registrant. Each person who completed the course was given time during the final class session to complete the questionnaire. The form states: "Evaluation: To aid us in maintaining quality control, would y o u please
complete this questionnaire." (A sample of the questionnaire is included in A p p e d i x A.l, p. 100)
The questionnaires completed by respondents were returned to the Project TEACH instructors. These
questionnaires produce three (3) copies. Each instructor keeps the bottom pink copies, then sends the white
original and attached yel l o w copy to A T A headquarters at Barnett House in Edmonton. The ATA sends the yellow copies of all completed evaluation forms to PLS head office in Ne w Jersey. The ATA retains all original completed questionnaires.
The author received 521 completed Project TEACH q uestionnaires from Dr. J u l i u s Buski of the A T A at Barnett House, E d m onton in D e c e m b e r of 1985.
Ethics
The ATA and the author did not wish to identify respondents or instructors by name, nor to compare instructors.
The instructors were coded randomly by number so that the numbers did not correspond with their order on the ATA-PLS instructors list.
Project TEACH questionnaires were grouped together according to classes, and individual forms were
identified by consecutive numbers. Forms dated after September 1, 1985 were excluded.
Individual privacy was protected by using numbers instead of names to identify specific forms, classes, and instructors. Locations of the courses were not c o d e d .
When a smaller sample was needed to examine comments made on an open ended question, (number seven) every
tenth form was chosen. When the tenth form did not have a signature giving permission for answers to be quoted, or did not have an answer, the next form in consecutive order, which met those criteria, was selected.
Treatment
This was a descriptive-comparative study.
All participants were members of Project TEACH classes taught in Alberta between September 1, 1983 and September 1, 1985. t
some extent for course costs. R e g i stration fees for the course began at one hundred dollars ($100.00) each rising to one hundred and twenty dollars ($120.00) in the Summer of 1985.
The fact that many Alberta Project TEACH registrants were subsidized financially for taking the course may have had an effect on the composition of the sample. Attendance was a matter of choice in pursuing
professional development.
IV
ANALYSIS OF DATA
This chapter will present an analysis of each of the research questions previously listed. The reader must bear in mind that the research questions'and
collected data are collected from the official PLS Project TEACH Evaluation Questionnaire, w hich
is biased in favor of the course. Another factor to be kept in mind is that one of the skills
purposely taught in the course is that of positive
thinking. This also undoubtedly influenced participant r e s p o n s e s .
A summary of findings involving comparison with other studies and internal comparisons of the Alberta study based on the PLS questionnaire will complete this c h a p t e r .
Analysis of Data According to Research Questions Re: Q u e stion 1
"1. Has the seminar increased your understanding of and proficiency in the following areas?
1.1 Communicating with students (verbal skills) 1.2 Resolving problems (verbal skills)
1.3 Dealing wit h confrontational situations 1.4 Reducing the possibility of confrontation 1.5 Using humour in the classroom
1.6 Counselling with parents/students 1.7 Group dynamics
occasionally refrained from answering certain questions). Valid percentages indicate percentage response from
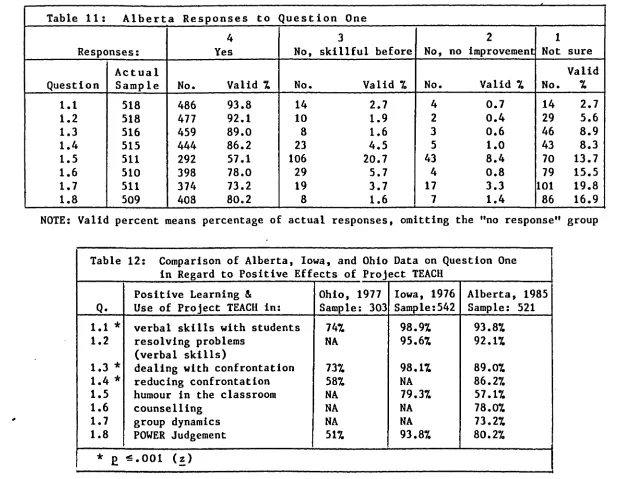
those who actually answered each question. Table 11, page 32, shows the statistical analysis of Alberta teachers to
the first question section.
Analysis of statistical data on all parts of Question one revealed that a majority of Alberta
respondents believed that Project TEACH had increased their understanding and proficiency in all areas.
(See Table 11, p . 32)
The verbal skills were best learned ( 1.1 & 1.2), both scoring above 907. "yes" response rates.
Dealing with confrontation (1.3 & 1.4) and
discipline decisions (POWER J u d g e m e n t )(1.8) were next best learned. All scored above 807. "yes" response rate.
Counselling and group dynamic skills and strategies (1.6 & 1.7) both scored above 707. "yes" response rate.
Using humour in the classroom ranked lowest at 57.17. "yes" response rate.
The Alberta data results from Question one were compared to some figures for the Iowa and Ohio studies
Q.l Results of Test of Difference Between Proportions 1.1 use of verbal skills (z=15.57; p^.001)
(Alberta and Iowa responses higher than Ohio) 1.2 verbal skills in problem solving
(Alberta and Iowa both valued highly, Ohio NA) 1.3 dealing wit h confrontation (z=4.88; p^.001)
(Alberta and Iowa responses Higher than Ohio) 1.4 reducing confrontation (£=6.56; p^.001)
(Alberta higher than Ohio, Iowa HA)
1.5 use of humour (£=1.7888651; no sig. dif.) (Alberta and Iowa similar, Ohio NA)
1.6 no data to compare to Alberta sample 1.7 no data to compare to Alberta sample
w ith pe rm is s io n of th e co py ri gh t o w ne r. Fu rthe r re production p ro h ib ite d wi th ou t p e rm is s io n .
Table 11: Alberta Responses to Question One
Responses:
4
Yes No,
3
skillful before No,
2 no improvement 1 Not sure Question Actual
Sample No. Valid % No. Valid % No. Valid % No.
Valid %
1.1 518 486 93.8 14 2.7 4 0.7 14 2.7
1.2 518 477 92.1 10 1.9 2 0.4 29 5.6
1.3 516 459 89.0 8 1.6 3 0.6 46 8.9
1.4 515 444 86.2 23 4.5 5 1.0 43 8.3
1.5 511 292 57.1 106 20.7 43 8.4 70 13.7
1.6 510 398 78.0 29 5.7 4 0.8 79 15.5
1.7 511 374 73.2 19 3.7 17 3.3 101 19.8
1.8 509 408 80.2 8 1.6 7 1.4 86 16.9
NOTE: Valid percent means percentage of actual responses, omitting the "no response" group
Table 12: Comparison of Alberta, Iowa, and Ohio Data on Question One in Regard to Positive Effects of Project TEACH
Positive Learning & Ohio, 1977 Iowa, 1976 Alberta, 1985 Q. Use of Project TEACH in: Sample: 303 Sample:542 Sample: 521
1.1 * verbal skills with students 74% 98.9% 93.8%
1.2 resolving problems NA 95.6% 92.1%
(verbal skills)
1.3 * dealing with confrontation 73% 98.1% 89.0%
1.4 * reducing confrontation 58% NA 86.2 %
1.5 humour in the classroom NA 79.3% 57.1%
1.6 counselling NA NA 78.0%
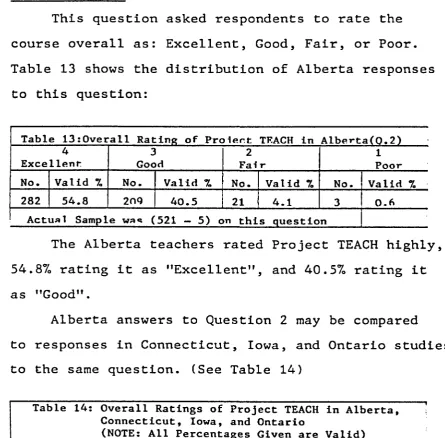
Re: Question 2
This question asked respondents to rate the course overall as: Excellent, Good, Fair, or Poor. Table 13 shows the distribution of Alberta responses
to this question:
Table 13:0verall Rating of Project TF.ACH in AlbertaC0.2)
4 3 2 1
Excellent Good Fair Poor
No. Valid 7. No. Valid % No. Valid 7. No. Valid 7.
282 54.8 2ng 40.5 21 4.1 3 0.4
Actual Sample waq (521 — 5) on this question
The Alberta teachers rated Project TEACH highly, 54.87, rating it as "Excellent", and 40.57, rating it as "Good".
Alberta answers to Question 2 may be compared to responses in Connecticut, Iowa, and Ontario studies to the same question. (See Table 14)
Table 14: Overall Ratings of Project TEACH in Alberta, Connecticut, Iowa, and Ontario
(NOTE: All Percentages Given are Valid)
Place Year
Actual
Sample Excellent
Very
Good Good Fair Poor
Connecticut 1975 111 47.7% 18.9% 25.2% 7.2% 0.9%
Iowa 1976 539 82.0% NA 17.3% 0.7%
Ontario 1981-85 5,214 73.4% NA 26.1% 0.5%
Alberta 1984-85 516 54.8% NA 40.5% 4.1% 0.6%
Alberta and Connecticut teachers were significantly less favorably disposed to Project TEACH than the combination
Because the Connecticut study offered respondents an extra rating choice of Very Good, the distribution of its responses varied.
Clearly, a majority of Project TEACH participants in Alberta, Connecticut, Iowa, and Ontario considered the course to be "better than good".
It should be noted that a more balanced scale would give a better reading on this question,
eg. Excellent, Above Average, Average, Below Average, Poor. Re: Question 3
This question asked r e s p o n d e n t s :"How do you rate the competency of the instructor?" Table 15 shows
the distribution of Alberta responses to this question:
Table 15:Alberta Ratings of Project TEACH Instructor Competency
Q.3 4 3 2 1
Rating: Excellent Good ' Fair Poor
number 366 146 2 2
Valid 7. 70.9% 28.3% 0.4% 0.4%
j No answer: 5______ Actual Sample; 516
A significant percentage of Alberta respondents rated Project TEACH instructors as Excellent in
c o m p e t e n c y .
Iowa and Ontario statistics regarding instructor competency were compared to Alberta statistics.
Table 16: Comparison of Project TEACH Instructor Competency Ratings in Alberta, Iowa and Ontario (Q.3)
Place Year
Actual
Sample Excellent Good Fair Poor
Alberta Iowa Ontario
1984-85 1976 1981-85
521 539 5,233
70.9% 87.8% 85.2%
28.3% 12.0% 14.6%
0.4% 0.2% 0.3%
0.4% nil nil
A majority of respondents rated Project TEACH instructor competency as "Excellent" in Alberta, Iowa, and Ontario.
The Alberta respondents were significantly less
favorable in rating instructors "Excellent" than those in Iowa and Ontario. (z = 1 2 .06;£^.05)
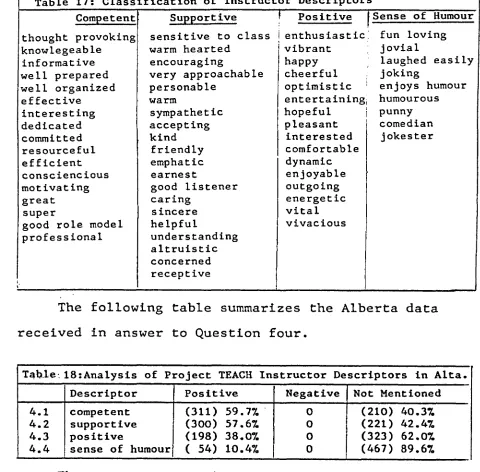
Re: Question 4
The fourth question on the Project TEACH evaluation questionnaire asked respondents: "How would you
characterize the instructor?" The author classified descriptions into four categories for coding responses to this question: Competent, Supportive, Positive, and Sense of Humour.
Competent Supportive f Positive |Sense of Humour
thought provoking sensitive to class i enthusiastic
!
fun loving
knowlegeable warm hearted j vibrant jovial
informative encouraging i happy laughed easily
well prepared very approachable cheerful joking
well organized personable optimistic enjoys humour
effective warm entertaining humourous
interesting sympathetic hopeful punny
dedicated accepting pleasant comedian
committed kind interested jokester
resourceful friendly comfortable
efficient emphatic dynamic
consciencious earnest enjoyable
motivating good listener outgoing
great caring energetic
super sincere vital
good role model professional
i'
helpful
understanding altruistic concerned receptive
vivacious
The following table summarizes the Alberta data received in answer to Question four.
Table 18:Analysis of Project TEACH Instructor Descriptors in Alta.
Descriptor Positive Negative Not Mentioned
4.1 competent (311) 59.7% 0 (210) 40.3%
4.2 supportive (300) 57.6% 0 (221) 42.4%
4.3 positive (198) 38.0% 0 (323) 62.0%
4.4 sense of humour ( 54) 10.4% 0 (467) 89.6%
There were no negative statements made about Alberta instructors in regard to the four categories chosen.
A majority of respondents described Alberta instructors as competent and supportive.
Alberta descriptors were compared to descriptors given by Connecticut and Iowa respondents.
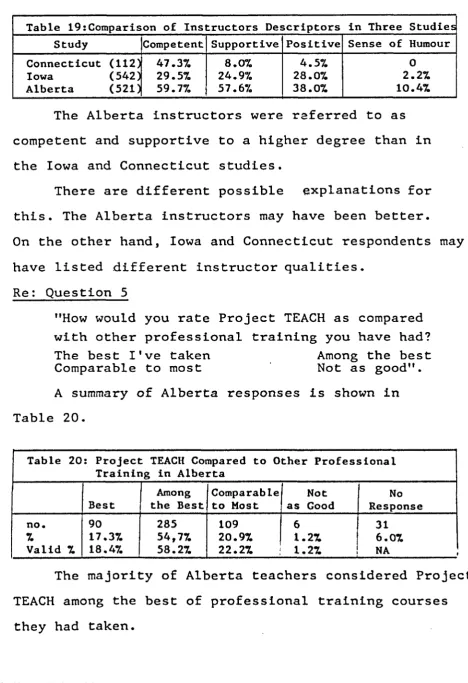
Table 19:Comparison of Instructors Descriptors in Three Studies
Study Competent Supportive Positive Sense of Humour
Connecticut (112) 47.3% 8.0% 4.5 % 0
Iowa (542) 29.5% 24.9% 28.0% 2.2%
Alberta (521) 59.7% 57.6% 38.0% 10.4%
The Alberta instructors were referred to as competent and supportive to a hi g h e r degree than in the Iowa and Connecticut s t u d i e s .
There are different possible explanations for this. The Alberta instructors may have been better.
O n the other hand, Iowa and Connecticut respondents may have listed different instructor qualities.
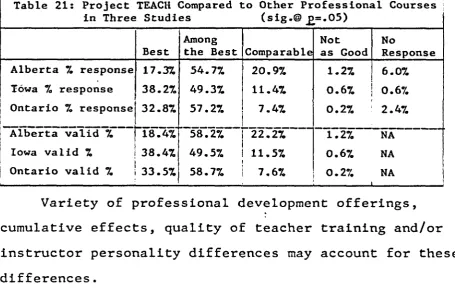
Re: Q u e stion 5
"How would you rate Project TEACH as compared w i t h other professional training you have had? The best I've taken Among the best Comparable to most Not as good". A summary of Alberta responses is shown in Table 20.
Table 20 : Project TEACH Compared to Other Professional Training in Alberta
Among Comparable Not No
Best the Best to Most as Good Response
no. 90 285 109 6 31
% 17.3% 54,7% 20.9% 1.2% 6.0%
Valid % 18.4% 58.2% 22.2% 1.2% NA