COMPARATIVE ANALYSIS OF LEVEL OF SERVICE (LOS) UNDER
VARYING LIGHTENING CONDITIONS
SEYED HOSSEIN HOSSEINI
A project report submitted in the partial fulfilment
of the requirements for the award of the degree of Master of Engineering (Civil-Transportation and Highway)
Faculty of Civil Engineering Universiti Teknologi Malaysia
ACKNOWLEDGMENT
First and foremost, I would like to thank the many people who have made my master project possible. In particular I wish to express my sincere appreciation to my supervisors Dr. Anil Minhans, for their encouragement, guidance, critics and friendship.
I would never have been able to make accomplishment without the loving support of my family.
I would like to thank my colleagues especially Iman Abbasszadeh fallah, Payam Paydar and Nima Zalfi, for all their help and support.
ABSTRACT
Delay estimation at a traffic signal is required in assessing signal performance and operating conditions of an intersection. Delay indicates the amount of time spent at a traffic signal in waiting until the discharge of traffic. Previous studies have accounted for delay estimation (of a minor arm) under the day light conditions only. However, this study attempts to study the delay and subsequently level of service (LOS) in both natural light (day light) and artificial light (road light) condition. This study was carried out to perform comparative analysis of level-of-service (LOS) under varying lightening conditions at a signalized intersection located at Lebuhraya Skudai-Pontian (principal road) and Jalan Seri Pulai (collector road). Traffic Volume, Cycle Time, Intersection Geometric Elements and Headway Data were collected during off-peak periods of day light and road light. The collected data were further analyzed and chi-square test was conducted to differentiate the results of survey under varying lightening conditions. The results showed lighting conditions do not have distinctive differences in the level-of-service (LOS) and the effect of road light on level-of-service (LOS) is insignificant.
Key words: Traffic signal, road lighting, delay, level of service (LOS)
ABSTRAK
TABLE OF CONTENT
CHAPTER TITLE PAGE
DECLARATION iv
DEDICATION v
ACKNOWLEDGEMENTS vi
ABSTRACT vii
ABSTRAK viii
TABLE OF CONTENTS ix
LIST OF TABLE xiii
LIST OF FIGURE xv
LIST OF ABBREVIATION xvi
LIST OF SYMBOLS xvii
LIST OF EQUATIONS xix
LIST OF DEFINITIONS xx
LIST OF APPENDICES xxii
1 INTRODUCTION 1
1.1 Introduction 1
1.2 Statement of problem 2
1.3 Hypotheses or research questions 2
1.4 Aims and objectives 3
1.5 Scope of the study 3
1.6 Important of the study 4
2 LITERATURE REVIEW 6
2.1 Introduction 6
2.2 Saturation headway 7
2.3 Saturation flow rate 9
2.4 Lost time 16
2.4.1 Start-up lost time 17
2.4.2 Clearance lost time 18
2.4.3 Total lost time and the concept of effective green time
18
2.5 Cycle time 19
2.6 Capacity 20
2.7 Delay 21
2.8 Level of service (LOS) 25
3 METHODOLOGY 27
3.1 Introduction 27
3.2 Project design 28
3.3 Traffic volume 29
3.4 Technique of data collection, and processing 29 3.5 Comparison between the delay based on observed data and
estimated delay 32
3.6 Methodology for delay calculation 33
4 DATA COLLECTION AND ANALYSIS 39
4.1 Introduction 39
4.2 Study area characteristics 40
4.3 Data collection 42
4.4 Data collection equipment 43
4.5 Observed data 44
4.5.1 Actual green and amber time for all stages in day and road light
4.5.2 Cycle time, actual green time and amber time for critical stage in day and road light
47
4.5.3 Saturation headway 48
4.6 Analysis of saturation headway, saturation flow rate and lost time
49 4.7 All-red time calculation for day light and road light 52 4.8 Standard deviation for saturation headway in day light and
road light
54 4.9 Standard deviation for lost time in day light and road light 56 4.10 Saturation deviation for amber time in day light and in road
light
58 4.11 Standard deviation for cycle time in day light and road
light
60 4.12 Standard deviations for all red in day light and road light 63 4.13 Timing diagram for observed cycle time in day light and
road light
65
4.14 Estimated cycle time 66
4.14.1 Estimated cycle time for day light 67 4.14.2 Timing diagram for estimated cycle time in day
light 68
4.14.3 Estimated cycle time for road light 69 4.14.4 Timing diagram for estimated cycle time in road
light 70
4.15 Delay based on observed data 71
4.15.1 Day light delay based on observed data 71 4.15.2 Road light delay based on observed data 73
4.16 Estimated delay 74
4.16.1 Estimated day light delay 74
4.16.2 Estimated road light delay 75
5.1 Evaluation of delay based on observed data and estimated
delay 76
5.2 Chi-square for degree of saturation (DOS) 78
5.3 Level of service (LOS) 78
6 CONCLUSION 85
REFRENCES 88
LIST OF TABLES
TABLE NO. TITLE PAGE
2.1 Estimated saturation flow in terms of lane width less than 5.5 m 13 2.2 Correction factors for saturation flow in terms of slope 14 2.3 Correction factors for saturation flow in terms of turning radius 14 2.4 Correction factor saturation flow in terms of turning movement 15
2.5 Conversion factors to PCU 16
2.6 Level of service (LOS) in terms of delay 26
3.1 Conversion factors to PCU 29
3.2 Methodology for delay calculation 33
3.3 Level of service (LOS) in terms of delay 38
4.1 Actual green time and amber time for all stages in day light 45 4.2 Actual green time and amber time for all stages in road light 46 4.3 Cycle, actual green and amber time for critical stage in day and
road light 47
4.4 Headway data in day light and road light 48
4.5 Analysis of saturation headway, saturation flow and lost time for
day light 49
4.6 Analysis of saturation headway, saturation flow and lost time for
road light 51
4.7 Calculated all-red during day light 52
4.9 Standard deviation for saturation headway in day light and road
light 54
4.10 Standard deviation for lost time at day light and road light 56 4.11 Saturation deviation for amber time in day light and in road light 58 4.12 Standard deviation for cycle time in day light and road light 61 4.13 Standard divisions for all red in day light and road light 63
4.14 Day light Y ratio per arm 67
4.15 Actual and effective green per arm 68
4.16 Road light Y ratio per arm 69
4.17 Actual and effective green per arm 70
4.18 Actual and effective green per arm at day light 72 4.19 Actual and effective green per arm at road light 73 4.20 Actual and effective green per arm in day light 74 4.21 Actual and effective green per arm in road light 75 5.1 Calculated control delay per vehicle for the lane at arm 1 at
signalized intersection and chi-square test and correlation for off peak hour
77
5.2 Calculated V/c, chi-square test and correlation for day light and
road light 78
5.3 Level of service (LOS) and delay at signalized intersection 79
5.4 Summary of delay based on observed data 79
5.5 Summary of estimated delay 80
5.6 Traffic volumes in day and night 82
LIST OF FIGURES
FIGURE NO. TITLE PAGE
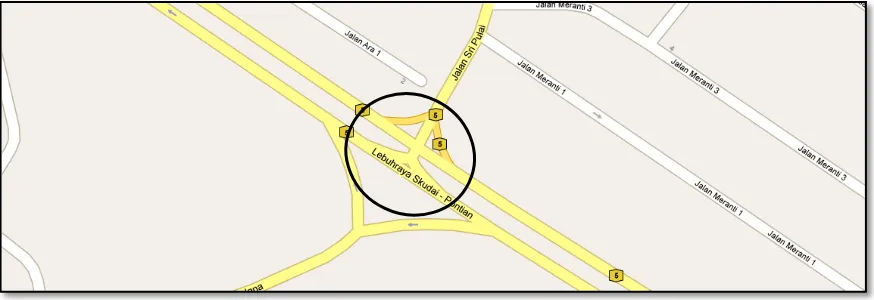
1.1 Study area 4
2.1 Measurement of saturation flow rate 8
2.2 The flow traffic during green period from a saturated approach 10
3.1 Methodology of the work 28
3.2 Measurement of saturation flow rate 30
3.3 Headway determination 31
4.1 Study area 40
4.2 Sketch of study area 41
4.3 Sketch of direction study area 41
LIST OF ABBREVIATIONS
LOS - Level of service
PCE - Passenger car equivalents PCU - Passenger car unit
HCM - Highway Capacity Manual DOS - Degree of saturation
LIST OF SYMBOLS
SYMBOLS UNIT ITEM
q pcu Flow
H sec Headway
S pcu/hr Saturation flow rate
L sec Loss time
Co sec Optimum cycle time
c pcu/hr Capacity
d sec/veh Delay
O sec/veh Observed delay
E sec/veh Estimated delay
W m Lane width
lsl s/phase Start-up lost time
Δi sec Incremental headway
Tn sec Green time required to move queue of “n” vehicles through a signalized intersection
T3 sec Time for first 3 cars to clear the stop bar, including headway for each
T13 sec Time for first 13 cars to clear the stop bar, including headway for each
n veh Number of vehicles in queue
tL sec Total lost time per phase
gn sec Effective green time of the nth signal phase Yn - Calculated Y-value of the same signal phase
g sec Average effective green time
d sec/veh Average stopped delay per vehicle for the lane or lane group of interest
LIST OF EQUATION
EQUATION NO. PAGE
[2.1] 8
[2.2] 9
[2.3] 12
[2.4] 13
[2.5] 15
[2.6] 17
[2.7] 17
[2.8] 18
[2.9] 19
[2.10] 19
[2.11] 20
[2.12] 21
[2.13] 22
[2.14] 22
[2.15] 22
[2.16] 22
[2.17] 25
[3.1] 32
[3.2] 35
[3.3] 36
LIST OF DEFINITIONS
TITLE PAGE
The green interval 96
The yellow or amber interval 96
Effective green time 96
The all-red interval 96
The intergreen interval 96
Level of service (LOS) 96
Actual flow rate 98
All-red interval 98
Approach 98
Capacity 98
Change interval 98
Clarence interval 98
Critical flow ratio 98
Critical movement or lane 98
Critical volume 99
Cycle 99
Cycle length 99
Delay 99
Design flow rate 99
Flow rate 99
Green interval 99
Green time 99
Hourly volume 100
Intergreen 100
Intersection flow rate 100
Lane group 100
Legs (intersection) 100
Passenger car units 100
Peak hour 100
Peak hour factor 100
Phase 100
Phase sequence 101
Queue 101
Roadway conditions 101
Signalization condition 101
Split 101
Traffic conditions 101
Signal timing 101
Speed limit 101
Geometric condition 101
Number of lanes 102
Traffic volume 102
Lost time 102
Clearance lost time 102
Start-up lost time 102
LIST OF APPENDICES
APPENDIX TITLE PAGE
(A) Peak traffic volume (pcu) 90
(B) Off peak traffic volume during day (pcu) 92
(C) Off peak traffic volume during night (pcu) 94
CHAPTER 1
INTERODUCTION
1.1 Introduction
The aim of this study is to compare the delay and level of service (LOS) of a signalized intersection located at Lebuhraya Skudai-Pontian (principal road) and Jalan Seri Pulai (collector road) under varying lightening conditions. The intersection has 3 stages that the vehicles move through it. For evaluating the quality of the intersection, the performance of it in day light and in road light conditions should be considered. Delay and level of service (LOS) which are some comparative indicators using to assess the performance of signalized intersection. Road lighting is one of the environmental conditions influencing on these indicators and respectively performance of signalized intersection. These comparative indicators are that so way conducted during the day light and road light conditions. Road lighting itself means whether in the night (artificial light), it has any impact on the delay and level of service (LOS).
signalized intersection, was not found. In our study, based on logical attitudes towards understanding these relationships, due to varying lightening condition it is expected that there must be a variation in headways and saturation flows. In terms of delay and level of service (LOS), which will be found subsequently in the bearer intersection, the relationships can be established.
1.2 Statement of the problem
The varying lightening conditions during day light (natural light) and road light (artificial light) affect on the delay and consequently, the level of service (LOS) at traffic signal. Therefore, the relationship between the lightening conditions at the different time in day and its effect on delay needs to be further investigated.
1.3 Hypotheses
1.4 Aims and objectives
The aim of study is to compare and analyze the level of service (LOS) under varying lightening conditions. In order to achieve the aim the following objectives are desired:
To determine delay under varying conditions of lightening- daylight and road lighting conditions.
To determine level of service (LOS) under daylight and road light conditions.
To compare the delay and level of service (LOS) for both road lightening conditions.
1.5 Scope and limitation of the project
In this study, the microscopic level of observations and analysis are conducted. This study is limited to:
The urban area
The study intersection
The prevailing road condition
The prevailing environmental condition
The day light (natural light) and road light (artificial light)
The off peak periods only
Figure 1.1: Study area
1.6 Importance of the study
There is no previous studies have been able to establish the relationship between day light and road light conditions, consider the delay and level of service (LOS). The outcome of this study shows that whether the performance of the intersection is similar the road light condition. The same effect on level of service (LOS) would depict that there is no variation due to varying lightening conditions. Furthermore, it would suggest several solutions to solve these problems. For example, improving the geometrics of the intersection, operating the signal based on new signal timings which signal timing is different during the day and finally changing power of the light that is related to the electric engineer and out of scope of traffic engineering.
1.7 General outline of research methodology
REFERENCES
Al-Kaisy, A. F., & Hall, F. L. (2000). Effect of darkness on the capacity of long-term freeway reconstruction zones. Transportation Research Circular E- C, 164–175. Retrieved June 22, 2011, from
http://gulliver.trb.org/publications/circulars/EC018/15_53.pdf. ArahanTeknic(Jalan)13/87. (2004). Jabatan kerja raya (pp. 1-107).
Ben-edigbe, J. (2010). Static signal settings compared. Traffic, 5(1), 42-48.
C.Cavette. (2007). Traffic signal. Retrieved from http://www.madehow.com/Volume-2/Traffic-Signal.html.
C.R.Hao, C. R. (2010). University of Technology Malaysia declaration of thesis / undergraduate project paper and copyright quality for the award of the degree of
Bachelor of Civil Engineering ” Signature. Notes.
Hadiuzzaman, D. (2008). Development of saturation flow and delay models for
signalised intersection in dhaka city. Department of Civil Engineering. Civil
Engineering.
HCM.Transportation Research Board. Washington D.C. (2000). Highway Capacity
Manual. Simulation.
Henke, B., & Gullikson, E. (1993). X-ray interactions: photoabsorption, scattering, transmission, and reflection at E= 50-30,000 eV, Z= 1-92. Atomic data and
nuclear data tables, (I). Retrieved June 29, 2011, from
http://linkinghub.elsevier.com/retrieve/pii/S0092640X83710132.
I.A.Fallah, I. A. (2010). Design consideration for motorists at urban four-arm signalize intersection.
J.Joseph. (2005). Saturation Flow Rates and Maximum Critical Lane Volumes for Planning Applications in Maryland. Journal of Transportation Engineering, 66(12), 26. doi: 10.1061/(ASCE)0733-947X(2005)131:12(946).
N.Nurikhwani, I. B. Z., with Nabidin. (2007). Evaluating signalized intersection capacity based on.
O. H. Chye. (2010). Delay at unsignalised junction. Notes. University of Technology Malaysia.
W.McShane, W., & R.Roess, R. (1998). Traffic engineering. Journal of the
Electrochemical Society (Vol. 129, p. 2865). Retrieved July 7, 2011, from
http://www.best-seller-books.com/traffic-engineering.pdf.
Yusria Darma. (2005). Control delay variability at signalized intersection based on