University of Windsor University of Windsor
Scholarship at UWindsor
Scholarship at UWindsor
Electronic Theses and Dissertations Theses, Dissertations, and Major Papers
2011
Compressed Air Energy Storage -- An Exergy-based Analysis of
Compressed Air Energy Storage -- An Exergy-based Analysis of
Turbomachinery Systems
Turbomachinery Systems
James Konrad University of Windsor
Follow this and additional works at: https://scholar.uwindsor.ca/etd
Recommended Citation Recommended Citation
Konrad, James, "Compressed Air Energy Storage -- An Exergy-based Analysis of Turbomachinery Systems" (2011). Electronic Theses and Dissertations. 194.
https://scholar.uwindsor.ca/etd/194
Compressed Air Energy Storage -- An Exergy-based Analysis of Turbomachinery Systems
by
James Konrad
A Thesis
Submitted to the Faculty of Graduate Studies
through the Department of Mechanical, Automotive and Materials Engineering in Partial Fulfillment of the Requirements for
the Degree of Master of Applied Science at the University of Windsor
Windsor, Ontario, Canada
2011
Compressed Air Energy Storage -- An Exergy-based Analysis of Turbomachinery Systems
by
James Konrad
APPROVED BY:
______________________________________________ Dr. Paul Henshaw
Department of Civil and Environmental Engineering
______________________________________________ Dr. Amir Fartaj
Department of Mechanical, Automotive and Materials Engineering
______________________________________________ Dr. Rupp Carriveau, Advisor
Department of Civil and Environmental Engineering
______________________________________________ Dr. David S-K Ting, Co-Advisor
Department of Mechanical, Automotive and Materials Engineering
______________________________________________ Dr. Gary Rankin, Chair of Defense
iii
DECLARATION OF PREVIOUS PUBLICATION
This thesis includes 3 original papers that have been previously
published/submitted for publication in peer reviewed journals, as follows:
Thesis Chapter Publication title/full citation Publication status
Chapter 2 Konrad, J., Carriveau, R., Davison, M.,
Simpson, F., Ting, D. S-K, 2011. Compressed Air Energy Storage as an Enabling Technology for Renewable Energy Development in Southwestern Ontario. International Journal of Environmental Studies
Under Review
Chapter 3 Konrad, J., Carriveau, R., Ting, D. S-K, 2011.
Exergy analysis of the McIntosh, Alabama compressed air energy storage facility. International Journal of Renewable and Sustainable Energy
To be Submitted
I certify that I have obtained a written permission from the copyright owner(s) to
include the above published material(s) in my thesis. I certify that the above material
describes work completed during my registration as graduate student at the University of
Windsor.
I declare that, to the best of my knowledge, my thesis does not infringe upon
anyone’s copyright nor violate any proprietary rights and that any ideas, techniques,
quotations, or any other material from the work of other people included in my thesis,
published or otherwise, are fully acknowledged in accordance with the standard
referencing practices. Furthermore, to the extent that I have included copyrighted
Copyright Act, I certify that I have obtained a written permission from the copyright
owner(s) to include such material(s) in my thesis.
I declare that this is a true copy of my thesis, including any final revisions, as
approved by my thesis committee and the Graduate Studies office, and that this thesis has
v ABSTRACT
Compressed Air Energy Storage (CAES) is a semi-mature technology which has
been used since the 1970s for power smoothing and “spinning reserve” for the electricity
grid. With the recent increase in development of intermittent energy sources such as
wind, tidal and solar power, energy storage will become more important to grid stability
and energy efficiency. The potential for use of CAES as an enabling technology for
renewable energy in the province of Ontario is examined. An exergy-based analysis of
an existing CAES facility in Alabama is presented in order to explain the potential for
DEDICATION
To my family, especially my grandparents Irene and Bill, for their love and
support throughout my undergraduate and graduate studies. To my friends, for the
midday and weekend “brainstorming sessions” where they shared their sage advice.
vii
ACKNOWLEDGEMENTS
I am grateful to my advisors, Dr. Carriveau and Dr. Ting for their guidance and
assistance throughout my research. Without their assistance, encouragement, and insight,
TABLE OF CONTENTS
DECLARATION OF PREVIOUS PUBLICATION ... iii
ABSTRACT ...v
DEDICATION ... vi
ACKNOWLEDGEMENTS ... vii
LIST OF TABLES ...x
LIST OF FIGURES ... xi
CHAPTER I. INTRODUCTION...1
1.0 Introduction ...1
II. COMPRESSED AIR ENERGY STORAGE AS AN ENABLING TECHNOLOGY FOR RENEWABLE ENERGY IN ONTARIO, CANADA...5
2.0 An Introduction to Compressed Air Energy Storage ...5
2.1 Context and Objectives ...5
2.1.1 What is CAES? ...6
2.1.2 CAES and Renewable Energy ...9
2.1.2.1 Intermittency of Wind in Southwestern Ontario ...9
2.1.2.2 CAES as a Buffer for Renewable Energy ...11
2.1.3 Existing CAES Facilities ...12
2.1.3.1 CAES at Huntorf, Germany ...12
2.1.3.2 CAES at McIntosh, Alabama ...13
2.1.3.3 Proposed and Planned CAES Facilities ...13
2.1.4 The Ontario Electricity Market and Development of Renewable Energy Resources ...13
2.2.0 Geologic and Geographic Considerations for CAES in Southwestern Ontario ...14
2.2.1 Bedded Salt Deposits ...15
2.2.2 Reservoir Storage ...16
2.2.3 Guelph Reefs ...17
ix
2.2.6 Economic Considerations ...19
2.3.0 Conclusions and Recommendations ...20
III. EXERGY ANALYSIS OF THE MCINTOSH, ALABAMA COMPRESSED AIR ENERGY STORAGE FACILITY...24
3.0 Introduction ...24
3.1 Analysis Method ...25
3.2 Exergy Analysis ...28
3.3 Results...31
3.4 Analysis and Conclusions ...34
3.5 Data Tables ...36
IV. FUTURE WORK...39
4.0 Future Work ...39
APPENDIX A: ALABAMA CAES FACILITY OPERATING DATA ...42
APPENDIX B: EXERGY ANALYSIS OF THE SR-30 TURBOJET ENGINE ...43
LIST OF TABLES
Table 3.1 – Compressor Train Exergy Analysis ...36
Table 3.2 – Expander Train Exergy Analysis ...37
Table A.1 – Compressor Train (Air) Operating Data ...42
Table A.2 – Intercooler Water-side Operating Data ...42
Table A.3 – Expander Train Air Data ...42
Table B.1 – SR-30 Flow Area...44
Table B.2 – Chemical Exergies of Substances ...45
Table B.3 – Pressure Measurements ...47
xi
LIST OF FIGURES
Figure 1.1 – CAES Facility Layout ...1
Figure 2.1 – Traditional CAES Facility ...7
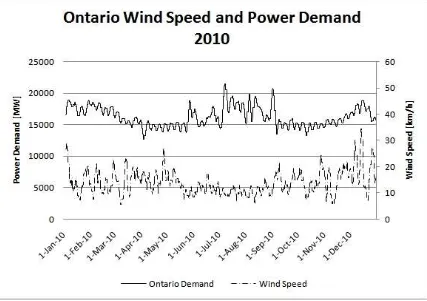
Figure 2.2 – 2010 Yearly Wind Speed and Power Demand ...10
Figure 2.3 – Average Daily Power Demand and Wind Speed August 2010 ...11
Figure 2.4 – Wind Speed at 80m AGL and Renewable Energy Resources ...19
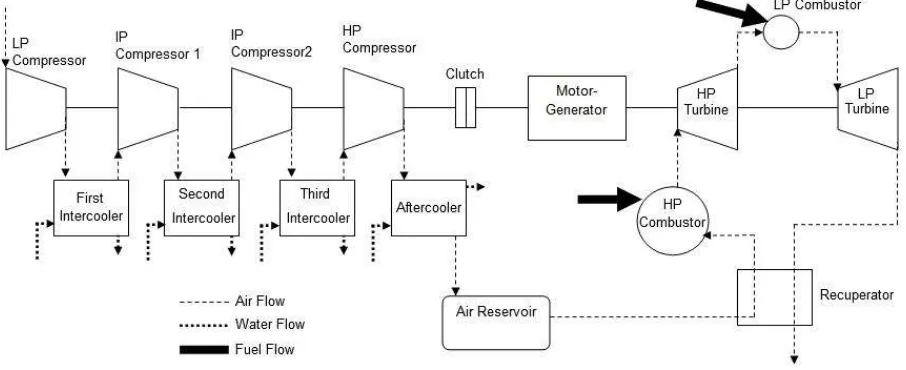
Figure 3.1 – Alabama CAES Facility Diagram ...26
Figure 3.2 – Compressor Train System ...27
Figure 3.3 – Expander Train System ...28
Figure 3.4 – Compressor Train Exergy Destruction Rates ...32
Figure 3.5 – Compressor Train Second Law Efficiency ...32
Figure 3.6 – Expander Train Exergy Destruction Rate...34
Figure 3.7 – Expander Train Second Law Efficiency ...34
Figure 4.1 – A “Black-Box” Model for CAES in Ontario ...39
CHAPTER I
INTRODUCTION
1.0 Introduction
Compressed Air Energy Storage (CAES) has been in use since the 1970’s as a
short-term spinning power reserve and for power smoothing applications. The first
facility was built in Huntorf, Germany and was followed in 1991 by a facility in
McIntosh, Alabama.
The facility in Germany has a total generation capacity of 290MW for 2 hours,
while the facility in Alabama has a generation capacity of 110MW for 26 hours [1].
Chapter two covers both facilities in more detail. Figure 1.1 presents the generic layout
of a CAES facility for reference.
Figure 1.1 – CAES Facility Layout
It can be seen that a CAES facility is conceptually very similar to a simple-cycle
2
increases in power demand. The major difference between the two types of facilities is
that while a gas turbine is a steady-flow device, the CAES facility includes a compressed
air reservoir in which mass accumulates during the storage mode of operation, and from
which mass is withdrawn during generation. Greenblatt et. al. [2] noted that these
technologies are in direct competition for use as “spinning reserve”.
While very few grid-scale energy storage facilities currently exist in the world,
the intermittency of renewable energy sources will soon necessitate the development of
energy storage as an integral part of the world’s electricity generation infrastructure. A
number of energy storage methods have been proposed for this task [3]; however CAES
has been proposed and studied specifically for wind power applications [4,5]. Chapter 2
shows how renewable energy and CAES can work together to facilitate further
sustainable development of renewable energy sources by looking at the specific case of
the province of Ontario.
From the analysis to follow, it can be seen that Ontario has what could be termed
the “perfect storm” of geology, geography, and renewable energy development [6] to
necessitate and facilitate the development of energy storage such as CAES. This analysis
is presented as a first step towards a feasibility study for the construction of a CAES
facility in Ontario.
The design and construction of new CAES facilities should not, however, be
limited to the technology utilized for the two existing facilities. Further development of
CAES into second-generation or Advanced Adiabatic CAES (AACAES) should be the
ultimate goal. AACAES holds the promise to reduce fuel consumption and increase
pre-heat air during the expansion process. To this end, an exergy-based analysis of the CAES
facility in McIntosh, Alabama is presented in Chapter 3.
By characterizing the exergy efficiency of existing CAES facilities and
determining the major contributors to decreased efficiency, an understanding of the
energy dynamics of the system can be developed [7]. From this analysis, an optimization
method for AACAES facilities can be developed and utilized in the design and
development of future energy storage projects.
Because the exergy analysis can identify losses more acutely than a traditional
first-law analysis of a system its utility should be emphasized [8]. Utilization of exergy
methods during the system design process has the potential to create more efficient
systems which is of the utmost importance when discussing fossil-fuel usage and
renewable energy resources.
The aim of this work is to identify opportunities for the development of CAES in
electricity markets such as Ontario’s, and utilize exergy-based methods to analyse
existing CAES facilities. The exergy methods outlined in this thesis are expected to be of
use in the future analysis and design of CAES and AACAES facilities used in
conjunction with both renewable and non-renewable energy sources.
References
[1] Nakhamkin, M., Anderson, L., Turpin, D., Howard, J., Meyer, R., Schainker, R., Pollak, R., Mehta, B. (1992) First U.S. CAES Plant Initial Startup and Operation, Proceedings of the American Power Conference, Vol. 1, pp. 154-161
[2] Greenblatt, J., Succar, S., Denkenberger, D., Williams, R., Socolow, R. (2007) Baseload wind energy: modeling the competition between gas turbines and compressed air energy storage for supplemental generation, Environmental Policy Vol. 35, No. 3, P. 1474-1492. [3] Butler, P., Taylor, P., DiPietro, J., (1998) Performance & Economic Analysis of
4
Systems Applications and Technologies. International Conference. Proceedings, p 305-10, 1998
[4] Pickard, W.F., Hansing, N.J., Shen, A.Q. (2009) Can large-scale advanced-adiabatic
compressed air energy storage be justified economically in an age of sustainable energy?, Journal of Renewable and Sustainable Energy, Vol. 1 No. 3, p 033102 (10 pp)
[5] Swider, D. (2007) Compressed Air Energy Storage in an Electricity System with Significant Wind Power Generation, IEEE Transactions on Energy Conversion Vol. 22. No. 1, P. 95-102.
[6] Mehta, B., (1990) Siting Compressed-Air Energy Storage Plants, Proceedings of the American Power Conference, v 52, p 73-78, 1990
[7] Xydis, G., Koroneos, C., Loizidou, M., (2009) Exergy analysis in a wind speed prognostic model as a wind farm sitting selection tool: A case study in Southern Greece, Applied Energy, Vol. 86, Pp. 2411-2420
CHAPTER II
COMPRESSED AIR ENERGY STORAGE AS AN ENABLING TECHNOLOGY FOR RENEWABLE ENERGY IN ONTARIO, CANADA
2.0 An Overview of Compressed Air Energy Storage
2.1 Context and Objectives
In 2008, the United States generated 4.119 billion kWh of electricity, 3.1% of
which was produced by renewable sources such as wind and solar [1]. Europe has been
an early adopter of renewable energy resources such as wind, solar, and tidal, and now
North America is becoming more focused on sustainable plans for energy management.
Clearly, conservation of energy resources and reduction of carbon emissions are both key
in planning future generation assets and engaging other electricity infrastructure issues.
Compressed air energy storage (CAES) is a technology that can be used to fulfill two
niches in the electricity market. The first is an arbitrage mode where energy is stored in
order to leverage low off-peak energy prices against higher peak prices. The second
proposed mode of operation is in conjunction with renewable energy sources like wind
farms. It is this mode that we will discuss more thoroughly. CAES facilities combined
with renewable energy sources can solve some issues associated with maximizing these
environmentally-friendly forms of electricity generation. For example, wind turbines
often produce power at off-peak times, which sometimes requires that their operation be
“curtailed” because although the electricity is available, there is not enough demand on
the grid. This mode of operation is not desirable for wind farm owners who then lose
potential revenue. A CAES facility co-located with a wind farm could alleviate this by
6
way CAES can serve to increase wind power penetration into the North American
electricity market by making it “dispatchable”.
The aim of this study is to identify which factors will affect the siting and
planning of CAES facilities as well as to enumerate the risk factors associated with these
facilities. This is considered a stepping stone to a feasibility study where the selected
factors will be studied in-depth and additional influences will be identified and
characterized. The authors recognize that some of the geologic and geographic
information contained herein represents an Ontario-centric slant to the work and hope
readers will appreciate the content as a “case study” in the assessment of the viability of
CAES which may be applied in other analogous North American locations and scenarios.
2.1.1 What is CAES?
Compressed Air Energy Storage (CAES) is a process by which atmospheric air is
compressed and utilized as an energy storage medium for power generation. A
traditional CAES facility as depicted in Figure 2.1 consists of five major components: a
compressor train, a motor/generator, a storage cavern/reservoir, a combustion chamber
Figure 2.1 – Traditional CAES Facility.
A CAES facility which is not co-located with another power generation source
can be connected to the grid and operated in arbitrage mode. In this instance, when
energy is inexpensive, such as during off-peak overnight hours, the facility can consume
energy to store compressed air underground. The energy is used to run the
motor/generator as an electric motor to drive the compressor train. During peak daytime
hours, when electricity prices have increased and the facility can be operated in
generation mode, expanding the stored air through the combustor, mixing the air with a
fuel such as natural gas (number 2 fuel oil has also been used) and burning the mixture in
the combustor to add heat energy to the stream. The hot gas stream then flows through
the turbine which drives the motor/generator as a generator and the facility sells
electricity back to the grid at the higher peak rate. In more advanced designs, the waste
8
combustor, therefore reducing the natural gas usage and increasing overall efficiency. By
reducing fuel usage during the electricity generation process, CAES also helps to reduce
emission levels.
The storage of compressed air underground as part of a CAES facility is
principally justified on the basis of minimizing use of the land surface, avoiding the
maintenance of easily corroded, limited size surface tanks, and reducing storage costs.
The main options for a CAES reservoir in places such as Southwestern Ontario are
depleted oil and gas reservoirs, reservoir configurations of strata without hydrocarbons,
and artificial caverns, formed through the controlled solution mining of salt deposits.
Operating in this mode, the CAES facility can be used as a “peak shaver” to allow
other generating facilities such as nuclear, natural gas, coal, and oil to reduce the number
of output changes they make as well as providing an emergency “spinning reserve” to the
grid which requires a minimal amount of time to move from idle or non-generating to full
power. This would allow these types of facilities to be operated at their peak
performance point more often, reducing emissions and maximizing efficiency. As
depicted above, by taking advantage of the method of energy arbitrage the facility could
conceivably be operated for a profit. What is perhaps more interesting is the promise of
using this technology as a buffer for renewable energy sources such as wind, tidal, and
solar. In Ontario, the initial considerations of wind resources, planned and existing wind
capacity, and geology suggests that the Southwestern region of the province could be
2.1.2 CAES and Renewable Energy
In international markets such as Denmark [3]; which have high levels of
renewable energy generation, CAES has been identified as a possible solution to the
intermittency of renewable energy sources. By enabling these higher levels of wind
penetration, CAES can enable electricity producers to lower their fuel consumption and
emissions profiles. Because of the rapidly increasing amount of wind energy generation
in Ontario, it is used as a case study in this section.
2.1.2.1 Intermittency of Wind in Southwestern Ontario
Power demand and wind speeds (and therefore available power from wind
energy) vary not only hourly, but seasonally as well. Figure 2.2 shows a 72 hour moving
average of both wind speed and Ontario power demand for the period from 1 January
2010 to 31 December 2010. Utilization of a moving average, where each data point is
averaged over the previous 72 hours of data, smooths the data to more clearly show the
10
Figure 2.2 – 2010 Yearly Wind Speed and Power Demand
Inspection of Figure 2.2 shows increases in Ontario’s power demand during the
winter and summer months. The graph also shows a revealing trend for wind power
penetration in Ontario. During the summer, when power demand tends to be higher,
average wind speeds are lower. The daily trend shown in Figure 3 depicts a situation
where CAES could be utilized to store otherwise wasted power and supply it to the grid
during peak demand. Figure 2.3 presents the average hourly wind speeds and power
demand in Southwestern Ontario for August of 2010. Weather data was chosen from the
Sarnia, Ontario station and Ontario power demand data was collected from the IESO
[4,5]. Figure 2.3 shows that while wind speeds do increase on average during the day,
operators relying on wind power for peak generation. In this case, a CAES facility could
allow power which had been generated by renewable sources overnight to be used in
place of so-called “peaker” plants such as simple cycle and combined cycle gas turbines
during peak demand.
Figure 2.3 – Average Daily Power Demand and Wind Speed August 2010.
2.1.2.2 CAES as a Buffer for Renewable Energy
As can be seen in Figures 2.2 and 2.3, the potential for an energy storage facility
to act as a buffer between renewable energy sources and the power grid in Ontario exists.
By utilizing a CAES facility in this way, renewable sources such as wind and solar could
be left “always-on” as opposed to curtailing them when their supply is too intermittent to
match demand on the grid. Having a facility in place to store this power when it is
12
It is also possible to envision a configuration in which the CAES facility could be
bypassed when conditions allowed for the renewable energy source to provide power to
the grid directly. Further study of methods and configurations is required, and is ongoing
to better quantify this relationship. This has been partially addressed in the literature
[6,7,8]. By increasing renewable generation penetration, CAES can reduce reliance on
fossil fuels and increase overall efficiency of our electricity generation system.
2.1.3 Existing CAES Facilities
Two CAES facilities are currently in operation worldwide, both utilize similar
design and operating principles, as well as storage media. Several other proposed CAES
projects are in various stages of completion. The operation of existing CAES facilities
provides prior work from which a 2nd generation CAES facility could be developed in
Ontario.
2.1.3.1 CAES at Huntorf, Germany
This 290 MW CAES facility was built in 1978 and is used to provide spinning
reserve power to the German grid [9]. It is co-located with the Unterweser nuclear power
plant and provides power to the grid during peak demand. It is designed to provide full
rated power for 2 hours. This time limitation is a function of storage capacity. The
Huntorf facility utilizes two solution-mined salt domes with a total volume of
approximately 300 150 m3 (10.6 million ft3). This facility is designed to go to idle power
in 2.5 minutes, followed by a 90MW/minute increase to full rated capacity. Information
about the geologic stability and site selection of this facility can be found in [10], further
2.1.3.2 CAES at McIntosh, Alabama
Like the Huntorf facility, the McIntosh facility utilizes a solution-mined salt
cavern for energy storage. Unlike Huntorf, it is rated to provide 110MW and has a total
capacity of 2600MWh before requiring the cavern to be recharged. During testing in
August 1992, the plant ran in generation mode continuously for 26 hours. The total
volume of the storage cavern at this facility is approximately 538 000 m3 (19 million ft3)
[9].
This facility is capable of being brought from start to full load in less than 15
minutes. More information on the geology of this facility can be found in [12] further
information on the history of this facility can be found in [13].
2.1.3.3 Proposed and Planned CAES Facilities
There are currently five CAES facilities planned in North America. The first is
being sited in Norton, Ohio. This is planned to be a large capacity facility
(approximately 600MW). The second facility, the Iowa Stored Energy Park (ISEP) is
planned for construction in Dallas Center, Iowa. Discussions are underway about a third,
fourth, and fifth facilities in Texas, New York, and California respectively although
planns for these facilities are in their early stages [9].
2.1.4 The Ontario Electricity Market and Development of Renewable Energy
Resources
Between 2006 and 2009, over 1080 MW of wind generation capacity were
installed in Ontario. With another 50 MW scheduled to come online in Quarter 4 of 2010
and 860 MW scheduled between Quarter 1 of 2011 and Quarter 2 of 2012 [5] Over 2009
14
installed wind power capacity is relatively high, solar photovoltaic installations are only
slowly being introduced.
The Ontario Power Authority (OPA) is planning for an increase in Ontario’s
renewable energy generation capacity (wind, solar and biomass) to 13% by 2018, from
3% today. While the OPA’s plan requires a large increase in renewable energy
generation, OPA’s plan also includes a reduction in total demand by 28 TWh by 2030
[14].
With the large increase in renewable energy’s contribution to electricity
generation in Ontario’s electricity market, the intermittency of these energy sources needs
to be addressed. While the contribution from solar photovoltaics is relatively predictable
based on prevailing weather conditions, the output of wind farms is highly variable and
hardly disptachable. Some element of energy storage will be required by the electricity
system operators in order to act as a buffer [15], allowing this power to be dispatched and
reducing Ontario’s reliance on simple-cycle and combined-cycle gas turbines for peak
power generation.
2.2.0 Geologic and Geographic Considerations for CAES in Southwestern
Ontario1
The abbreviated account of general geology is taken from the work of Shidahara,
Hutt, Langer, Sanford, Smith, and Dryer [12,16,18,19,23-30]; the synthesis of relevant
economic geology is sourced from Langer, and Sanford [25,27,28].
Sedimentary strata with CAES potential attain a maximum thickness on the order of
1,400 m in the Sarnia area and under central Lake Erie. The strata rest on a basement of
crystalline Precambrian rocks and thin northeastwards to pinch out along the southern
perimeter of the Precambrian Shield. The sedimentary rocks of the area range in age
from Upper Cambrian to Upper Devonian. In general, they thicken from the central part
of Southwestern Ontario west and northwestward toward the Michigan basin and also
east- and southeastward in the direction of the Appalachian (Allegheny) basin. Strata
with reservoir potential – and closely related CAES potential – occur throughout the
sedimentary sequence. The Silurian part of the succession contains the carbonate reefs of
the Guelph Formation and the overlying salt-bearing strata of the Salina Formation, both
of which have CAES potential [24,25,27-29].
2.2.1 Bedded Salt Deposits
Solution-mined caverns in salt have proven successful for storage in existing
CAES facilities like Huntorf and McIntosh [9,31,32]. This indicates particular promise
for parts of Southwestern Ontario, where solution-mining operations already exist.
Bedded salt deposits, referable to the Salina Formation, occur over large areas of
Southwestern Ontario. The main salt-bearing strata occur in the Salina A-1, A-2, B, D, E
and F units, in which rock salt is interbedded with dolomite, anhydrite and shale. These
salt units are found along the western margin of the Michigan basin, from Amherstburg
northward to Kincardine.
At both existing CAES facilities, the salt caverns were mined for the purpose of
storing air for CAES. Although this is feasible in Ontario as well, the existence of
16
mining of new caverns has the potential to add cost and time to construction of CAES
facilities in Ontario. There are also salt-mining operations in the Windsor area and at
several locations between Courtright and Kincardine. These include both producing and
abandoned brining operations, as well as the producing mines at Windsor and Goderich.
2.2.2 Reservoir Storage
Commercial quantities of hydrocarbons have been discovered throughout the
sedimentary sequence of Southwestern Ontario. The Cambrian strata, the Gull River,
Coboconk, Kirkfield, Cobourg and Sherman Fall strata (Ordovician), the Whirlpool,
Grimsby, Thorold, Irondequoit, Guelph, Salina A-1 and Salina A-2 strata (Silurian) and
the Dundee Formation (Devonian) yield natural gas. The Cambrian, Sherman Fall,
Whirlpool, Grimsby, Guelph, Salina A1, Lucas and Dundee strata contain commercial
accumulations of crude oil. All of these reservoir units offer potential storage media for
CAES facilities.
Configurations of strata, prospective for hydrocarbons and also potentially
suitable for CAES applications, occur (1) along the western margin of the Appalachian
basin, (2) on the eastern edge of the Michigan basin, and (3) on the Findlay arch. The
pinnacle and patch reefs of the Silurian Guelph Formation hold particular promise for
CAES, both as depleted hydrocarbon reservoirs and as trapping mechanisms, devoid of
oil and gas. The Salina A-1 and A-2 carbonate traps are located directly above Guelph
reefs, which in many cases occur along the crests of tilted, fault-bounded blocks.
Secondary recovery is widely employed in oil and gas exploitation in Southwestern
Ontario. This process uses water flooding with a line drive or five-spot and nine-spot
for many pools. However the penetration of producing reservoirs by recovery and
injection wells may limit their potential for adaptation to CAES use. It is worth noting
some of the Devonian reservoirs were damaged by poor production practices [25,28,29].
The planned Iowa Stored Energy Park (ISEP) is slated to utilize an aquifer for
storage of compressed air. However there are many unknowns with the utilization of this
geology. It is possible that residual water in an aquifer could prevent airflow and restrict
the number of paths that air can take when entering and exiting the reservoir. As the air
is cycled through the cavern, the available paths could change as water migrates
throughout the porous structure. The effects of air cycling on aquifer structure require
further study before usage of specific aquifers is determined to be suitable for CAES in a
particular location [19].
2.2.3 Guelph Reefs
The carbonate mounds of the Guelph Formation occur as pinnacle reefs, with
relief of up to 165 m, in a band 16-32 kilometers wide, to the south of Lake Huron, and as
patch (incipient) reefs, with relief generally in the range of 10-30 m and located to the
south and east of the others. The pinnacle reefs are elongate in plan, with average lateral
dimensions of 1500m long by 650m wide. The enveloping rocks are the
evaporite-bearing strata of the lower part of the Salina Formation. The Guelph patch and pinnacle
reefs and overlying Salina A-1 and A-2 carbonate traps are the most productive in the
area. Depleted hydrocarbon reservoirs in reef carbonates of the Guelph Formation have
been converted for the underground storage of natural gas in Lambton County. Because
Guelph reefs are potential hydrocarbon reservoirs, the hydrocarbon content must be
18 2.2.4 Mechanics of Porous Rock
While Guelph reefs comprise the majority of viable porous-rock type formations
available in Southwestern Ontario, additional work has been done to characterize the air
flow in these and other types of porous-rock. Azin et al [17], Allen et al [18], and
Kushnier et al [19] recognized the importance of these reservoir types. Their
characterizations provide a basis for further work on the types of reservoirs which may be
available in Ontario. These types of reservoirs, while more abundant, may provide
challenges to designers of next-generation CAES facilities which were not seen by those
developing facilities utilizing open-cavern storage media.
2.2.5 Locations of Viable Wind Resources in Southwestern Ontario
Data regarding average wind speeds was acquired from the Ontario Ministry of
Natural Resources, an example of the data is shown in Figure 2.4. This data shows
average wind speeds at a height of 80 m above ground level (AGL), and data is available
at 20 m intervals. Additionally, the location of existing wind and solar resources is also
shown. When co-location of CAES and wind farms is discussed, the location of viable
winds in relation to appropriate geology for CAES could be a critical factor for selecting
a location for the CAES facility. Therefore it is necessary that this data is readily
available for a first approximation of a CAES/wind site. In areas with already high levels
of wind energy penetration, CAES could facilitate further development of wind resources
Figure 2.4 – Wind Speed at 80m AGL and Renewable Energy Resources [33]
2.2.6 Economic Considerations
In petroleum exploration the term “geologic success, economic failure” describes
geology that would normally be expected to contain trapped hydrocarbons, but for some
reason does not. Often these formations consist of porous rock which has a history of gas
storage. In terms of CAES, this geology may be an economic success if it were found
20
In addition to aforementioned geological considerations, the cost of excavating
caverns or solution-mining salt needs to be considered in any economic model. This cost
is non-trivial especially for the very large reservoirs required to support base load sized
plants.
As discussed in the previous sections regarding the geology and geography of
Southwestern Ontario, viable wind resources that are already being exploited coincide
with appropriate geology for CAES across this area of the province. The Sarnia area is
considered particularly viable for development of a CAES facility due to the existing
power generation and petroleum recovery infrastructure. The existence of porous
rock-type geology which may have the required wellhead infrastructure already in place could
significantly decrease the cost of developing underground volume for a CAES facility.
Further, work already completed on the economics of similar storage systems for
natural gas [20] can provide an economic basis with which electricity system operators
can make correct decisions when it comes to operating a CAES facility. The work of
Thompson et al [21] and Zhao and Davison [22] on economic control of power plants in
market economies could strongly influence the actions of a potential operator of a CAES
facility.
2.3.0 Conclusions and Recommendations
This brief overview of the state of CAES technology and development of CAES
facilities shows the potential for further development in the Ontario electricity generation
market. As an enabling technology for higher penetration of renewable resources, CAES
can provide the necessary storage medium to supplant the intermittency and lack of
CAES facility could operate for profit and assist with grid balancing by conducting
energy arbitrage.
In either case, CAES technology has the potential to reduce overall fuel usage and
assist electricity generators in better utilizing existing resources while reducing emissions
at the same time. Higher levels of renewable energy generation enabled by CAES will
also assist in achieving these goals.
Through careful analysis of existing CAES facilities, an optimized solution for the
Ontario electricity market could be conceived. The results of this research create a basis
for a feasibility study of CAES in Ontario. By understanding the underlying geological
and geographical constraints, a site selection study could proceed as the first phase,
followed by engineering and economic evaluation and a subsequent optimization of the
facility. The completion of this prefeasibility examination provides the impetus to further
consider the potential of CAES to serve as an enabling technology to assist the province
of Ontario and other interested parties in meeting their renewable energy generation goals
in the near term.
References
[1] Electric Power Annual 2008, U.S. Energy Information Administration, Office of Coal, Nuclear, Electric and Alternate Fuels, U.S. Department of Energy, August 2010. [2] Gardner, J., Haynes, T. (2007) Overview of Compressed Air Energy Storage, Boise State
University.
[3] Salgi, G., Lund, H. (2007) System behavior of compressed-air energy-storage in Denmark with a high penetration of renewable energy sources, Applied Energy Vol. 85, P. 182-189.
[4] Najjar, Y.S.H., Jubeh, N.M. (2006) Comparison of performance of compressed-air energy-storage plant with compressed-air energy-storage with humidification. Proceedings of the Institute of Mechanical Engineers Part A: Power and Energy Vol. 220, P. 581-586. [5] Independent Electricity System Operator (2009) Ontario Power Demand in MW, Retrieved: 6
22
[6] Arsie, I., Marano, V., Rizzo, G., Moran, M. (2006) Energy and economic evaluation of a hybrid power plant with wind turbines and compressed air energy storage, Proceedings of PWR2006, ASME Power Division.
[7] Greenblatt, J., Succar, S., Denkenberger, D., Williams, R., Socolow, R. (2007) Baseload wind energy: modeling the competition between gas turbines and compressed air energy storage for supplemental generation, Environmental Policy Vol. 35, No. 3, P. 1474-1492. [8] Swider, D. (2007) Compressed Air Energy Storage in an Electricity System with Significant
Wind Power Generation, IEEE Transactions on Energy Conversion Vol. 22. No. 1, P. 95-102.
[9] Succar, S., Williams, R. (2008) Compressed Air Energy Storage: Theory, Resources and Applications for Wind Power, Princeton University Energy Systems Analysis Group [10] Allen, R.D., Doherty, T.J., Thoms, R.L. (1982) Geotechnical Factors and Guidelines for
Storage of Compressed Air in Solution Mined Salt Cavities, US Department of Energy. [11] Crotogino, F., Mohmeyer, K-U, Scharf, R. (2001) Huntorf CAES: More than 20 Years of
Successful Operation. Paper presented at the Solution Mining Research Institute 2001 conference. Available from http://www.solutionmining.org.
[12] Shidahara, T., Oyama, T., Nakagawa, K., Kaneko, K., Nozaki, A. (2000) Geotechnical evaluation of a conglomerate for compressed air energy storage: the influence of the sedimentary cycle and filling minerals in the rock matrix, Engineering Geology Vol. 56, P. 125-135.
[13] Pollak, H. (1994) History of First U.S. Compressed Air Energy Storage (CAES) Plant (110MW 26h) Volume 2: Construction, Electric Power Research Institute, EPRI TR-101751.
[14] Ontario Power Authority (2011) The Long-Term Energy Plan process. Accessed: 6 February 2011, http://www.powerauthority.on.ca/the-plan
[15] Drost, M. Kevin, Reilly, Raymond W. (1981) Preliminary evaluation of a power plant with direct coupled compressed air energy storage. Proceedings of the 16th Intersociety Energy Conversion Engineering Conference, P. 1000-1004.
[16] Allen, K. (1985) CAES: The Underground Portion, IEEE Transactions on Power Apparatus and Systems, Vol. PAS-104, No. 4, P. 809-812.
[17] Azin, R., Nasiri, A., Jodeyri Entezari, A. (2008) Underground Gas Storage in a Partially Depleted Gas Reservoir, Oil & Gas Science and Technology, Vol. 63, No. 6, P. 691-703. [18] Allen, R.D., Doherty, T.J., Erikson, R.L., Wiles, L.E. (1983) Factors Affecting Storage of
Compressed Air in Porous Rock Reservoirs, Report, Prepared for the U.S. Department of Energy under Contract DE-AC06-76RLO 1830.
[19] Kushnier, R., Ullmann, A., Dayan, A. (2010) Compressed Air Flow within Aquifer Reservoirs of CAES Plants, Transportation in Porous Media, Vol. 81, P. 219-240. [20] Thompson, M. , Davison, M. and Rasmussen, H. (2009) Natural Gas Storage Valuation and
Optimization: A Real Options Application, Naval Research Logistics, Vol. 56, No. 3, P. 226-238.
[21] Thompson, M. , Davison, M. and Rasmussen, H. (2004) Valuation and Optimal Control of Electrical Power Plants in Deregulated Markets, Operations Research Vol. 52, No. 4, P. 546-562.
[22] Zhao, G., Davison, M. (2009) When does variable power pricing alter the behavior of hydroelectric facility operators?, Renewable Energy, Vol. 34, P. 1064-1077. [23] Brigham, R.J. (1971) Structural Geology of Southwestern Ontario and Southeastern
Michigan. Ontario Department of Mines and Northern Affairs, Paper 71-72.
Potential. Canadian Society of Petroleum Geologists, Memoir 1. Calgary, Canadian Society of Petroleum Geologists, 720 p.
[25] Langer, M. (1995) Engineering Geology and Waste Disposal, Bulletin of the International Association of Engineering Geology, No. 51, April 1995.
[26] Sanford, B.V. 1993a. St. Lawrence Platform-Geology, Chapter 11, pp. 723-786, in Stott, D.F, and Aitken, J.D. (Editors), Sedimentary Cover of the Craton in Canada. Geological Survey of Canada, Geology of Canada, No. 5, 826 p.
[27] Sanford, B.V. 1993b. St. Lawrence Platform-Economic Geology, Chapter 12, pp. 789-798, in Stott, D.F, and Aitken, J.D. (Editors), Sedimentary Cover of the Craton in Canada. Geological Survey of Canada, Geology of Canada, No. 5, 826 p.
[28] Sanford, B.V., Thompson, F.J., McFall, G.H. (1985) Plate Tectonics – A Possible Controlling Mechanism in the Development of Hydrocarbon Traps in Southwestern Ontario, Bulletin of Canadian Petroleum Geology, Vol. 33, No. 1, P. 52-71.
[29] Smith, L, Charbonneau, S.L., Grimes, D.J. (1993) Karst episodes and permeability development, Silurian reef reservoirs, Southwestern Ontario, Ontario Geoscience Research Grant Program, Grant No. 295; Ontario Geological Survey, Open File Report 5850, 240 p.
[30] Dreyer, W., Haase, G. (1982) Underground Storage of Oil and Gas in Salt Deposits and Other Non-Hard Rocks. New York, Halsted Press, and Chichester, Wiley Ltd., 213 p. [31] Katz, D., Lady, E. (1990) Compressed Air Storage for Electric Power Generation, EPRI
GS-6784, Project 2488-10, Electric Power Research Institute, Palo Alto, CA. [32] Morrison, A., Lyons, J.W., Mehta, R., Gnaedig, G. (1994) Technical and Economic
Evaluation of Nominal 280MW Compressed Air Energy Storage Plant in Salt Dome, Presented at the lnternational Gas Turbine and Aeroengine Congress and Exposition, The Hague, Netherlands - June 13-16, 1994
24 CHAPTER III
EXERGY ANALYSIS OF THE MCINTOSH, ALABAMA COMPRESSED AIR ENERGY
STORAGE FACILITY
3.0 Introduction
Compressed air energy storage (CAES) technology has been identified as an enabling
technology for high levels of renewable energy generation. While the technology has been
employed since the late 1970s for emergency “spinning reserve” and power smoothing [1], it has
yet to be employed as a buffer between renewable energy sources and the rest of the power grid.
With the increasing efforts to improve efficiency in the electricity generation industry, and the
potential looming change in power demand with the advent of various types of plug-in electric
vehicles, it will become increasingly important to maximize efficiency in all stages of power
generation and distribution. While second-generation advanced adiabatic CAES has been
proposed and studied [1-3] , a thorough analysis of the feasibility of this technology is still
required. To this end, an exergy-based analysis of one existing first-generation CAES facility in
McIntosh Alabama is considered here, with particular emphasis placed on the recoverable exergy
from intercooling processes within the compressor train, the ultimate goal of this research being
the development of an optimization scheme for second-generation Advanced Adiabatic CAES
(AACAES).
The development of second-generation CAES is of specific interest when discussing the
use of CAES as a buffer between renewable energy resources and the grid; because
first-generation CAES still requires significant amounts of natural gas to run efficiently. For this
reason, underground pumped-hydroelectric energy storage (UPH) has been suggested by Pickard
presented by Pickard et. al. provides a wide range of possible reasons that CAES and UPH have
not yet been utilized, mainly focusing on economic shortfalls. AACAES does provide certain
engineering challenges with regard to thermal energy storage, and the first step to understanding
these design challenges is to determine the exergy destruction characteristics of existing CAES
facilities. Considering the sub-surface space requirements for both technologies, as well as the
location of existing and planned renewable energy infrastructure development, it is postulated
that CAES will have a role to play in the future of renewable energy development. While
general analyses of theoretical CAES facilities have been attempted [2,4], to the author’s
knowledge, no comprehensive analysis of the two existing facilities has been completed. To this
end, an analysis of the exergy destruction characteristics of the McIntosh, Alabama CAES
facility is presented here.
3.1 Analysis Method
The motive air flow diagram for the Alabama CAES facility is shown in Figure 3.1.
Notation for all system diagrams is as follows: LP – low pressure, IP – intermediate pressure, HP
– high pressure. The system was analyzed in two segments. First, the compression cycle was
considered, in which the compressor train is driven and air is compressed into the cavern.
Second, the cooling process in the cavern between compression and generation stages was
analyzed. Finally, the generation process was considered with the facility running at full rated
power (110 MWe) including recuperator operation. During all phases of analysis, air and the
combustion products were considered to behave as ideal gases, and liquid water was considered
incompressible. Both inlet and stored air are considered dry gases because the inlet gas stream
contains a water separator. Although work has been done to consider the effects of humidifying
26
Figure 3.1 – Alabama CAES Facility Diagram
The dead (reference) state was set at T0 = 295K, p0 = 99 kPa, which are the atmospheric
conditions at which cycle data was available [6,7]. All processes are assumed to be at
steady-state with no mass accumulation in turbomachinery, however mass does accumulate in the
cavern during the fill process.
The compression process is analyzed at full power during a complete 41.7 hour
compression cycle. Figure 3.2 depicts the system as it functions during the compression cycle.
While compressing air, the compressor train shaft is driven with 47.4 kW, with 15.6 kW driving
the first-stage axial compressor, and the remaining power driving the three centrifugal
compressors as a unit. During storage, the air in the cavern is assumed to cool to ambient
Figure 3.2 – Compressor Train System
Throughout the generation process, the electrical output of the generator is considered to
be 110 MWe, while the shaft output of the expander train is 113.9 MW. The system during
generation is depicted in Figure 3.3. For analysis of the generation process, the fuel was
28
Figure 3.3 – Expander Train System
For ease of comparison, the exergy analysis has been completed in rates [kW] rather than
absolute exergy [kJ]. The exergy rate (availability) in the cavern has been based on a 26-hour
generation cycle to arrive at cavern availability.
3.2 Exergy Analysis
The flow (stream) exergy of an ideal gas as shown by Bejan et al [8] is:
(1)
Where ψ is the flow exergy, Cp is the constant pressure specific heat capacity of the working
fluid, T is the absolute temperature, T0 is the reference temperature (295K), P is the absolute
pressure, P0 is the reference absolute pressure (99 kPa) and k is the ratio of specific heats for the
Similarly, the non-flow (closed system) exergy, φ, of an ideal gas from Bejan et al [8] is
given as:
(2)
Equation 2 is utilized only to calculate the exergy of the cavern when the inlet and outlet
valves are closed and air is being stored over a period of time. In this scenario, the closed system
exergy is the only component of exergy considered.
Exergy transfer due to heat is given by Cengel and Boyles [9] in Equation 3 and is used to
quantify exergy loss in the cavern during the storage process.
(3)
Where is the total exergy rate (in kW) due to heat transfer and is the heat transfer rate in
kW.
The combustion process in the high pressure combustor is assumed to be complete with
excess air as shown:
(4)
The combustion process in the low pressure combustor is assumed to be complete with
excess air as shown:
(5)
Chemical exergy of the combustion process can be calculated from standard chemical
30
Where is the standard chemical exergy of the substance, is the mass flow rate of that
substance and is the total chemical exergy rate.
For a chemical reaction, the exergy destruction can be calculated as:
(7)
Total exergy for a flow stream is the sum of all discussed exergy components:
(8)
The units for xtotal are kJ/kg. By multiplying by the mass flow rate, we can arrive at the
physical exergy rate in kW which allows us to compare the facility’s input and output.
(9)
For analysis of the water side (incompressible) of the air/water intercoolers, the standard
definition for flow exergy shown by Cengel and Boles [9] and Bejan et al [8] is used:
(10)
Where h is enthalpy, h0 is enthalpy at the reference state, s is entropy and s0 is entropy at the
reference state. The units of ψ are kJ/kg.
The entropy term (s-s0) is defined in this case by Cengel and Boles [9] as:
(11)
Where Cavg is the average specific heat capacity of the substance.
Second-law efficiency is defined as:
3.3 Results
The system was analyzed as two processes: a storage (filling) process and a generation
process. During the fill process, mass accumulates in the cavern as it is brought from its initial
pressure of 5205 kPa to a final pressure of 7791 kPa[10]. The mechanical power input to the
compressor train during the fill process is assumed to be measured at the output shaft of the
electric motor. The motor delivers a total shaft power of 47.3 MW over the 41.7-hour filling
process. The mechanical exergy input to the system is given as the shaft power measured at each
compressor.
Exergy destruction is the removal of the ability to do useful work from the system. This
is an important concept because it identifies which components of a complex system are
contributing most to lowering its efficiency. By reducing exergy destruction, overall efficiency
is increased.
The first stage compressor operates at a pressure ratio of approximately 4 to 1 and is an
axial-type compressor. It consumes 15.6 MW of shaft power and imparts 13.9 MW of exergy to
the air flow. It operates at a second law efficiency of 89 %. The isentropic efficiency of the first
stage compressor is 81%. The first stage intercooler causes 3.4 MW of this exergy to be
destroyed during the cooling of the gas stream, and operates at a second law efficiency of 75%.
The flow exergy of the water increases by 429.6 kW, the importance of this value will be
explained further in the analysis section. Table 3.1 details the results of the compressor train
analysis. Figure 3.4 shows exergy destruction rates of each component of the compressor train
system and Figure 3.5 shows the second-law efficiencies of each component of the compressor
32
Figure 3.4 – Compressor Train Exergy Destruction Rates
Figure 3.5 – Compressor Train Second Law Efficiency
0 500 1000 1500 2000 2500 3000 3500 4000 Fir st St age Co mp ress o r Firs t Sta ge In tercoo le r Se con d Sta ge Com p re ss o r Se con d Sta ge In tercoo le r Th ird St age Co mp ress o r Th ird Sta ge In tercoo le r Fou rth Sta ge Com p re ss o r Af tercoo le r Exer gy Dest ru ction R ate [ kW]
Compressor Train Exergy Destruction
Rate
65% 70% 75% 80% 85% 90% 95% 100% Firs t Sta ge Com p re ss o r Firs t Sta ge In tercoo le r Se con d Stage Com p re ss o r Se con d Sta ge In tercoo le r Th ird Sta ge C om p re ss or Th ird Sta ge In tercoo le r Fou rth Sta ge Com p re ss o r Af tercoo le r Se co n d Law Eff ic ie n cy [% ]The compressor system operates at an overall second-law efficiency of 66.52%. This
accounts for all exergy destroyed in the compression and intercooling processes. The absolute
exergy losses are most prevalent in the first and second stage intercoolers as seen in Figure 3.4.
The remaining system components all have non-trivial but similar exergy losses. The
significantly lower second-law efficiency found in the first stage intercooler can be attributed to
the higher compression ratio of the first stage compressor and the increased water flow through
the intercooler.
The expander train includes a recuperator which is an air to air heat exchanger. The
recuperator pre-heats the air coming from the cavern with combustion products from the exhaust
of the low-pressure turbine. It operates at a second law efficiency of 88%. The combustors,
however both operate at approximately 53% second law efficiency. This is the major source of
inefficiency in the generation process.
The high pressure turbine operates at 90% efficiency and the low pressure turbine operates at
85% efficiency. The overall second-law efficiency of the generation process is 45% when
operating at steady-state and full rated power. Figure 3.6 shows the exergy destruction rates of
the expander train. It clearly shows the significant amounts of exergy destroyed in the
combustion process, which is consistent with the results showing in analyses of similar systems
[11]. This analysis accounts for the amount of chemical exergy converted to physical exergy and
used to drive the turbines to generate power. Figure 3.7 shows the second-law efficiencies of the
34
Figure 3.6 – Expander Train Exergy Destruction
Figure 3.7 – Expander Train Second Law Efficiency
3.4 Analysis and Conclusions
The exergy analysis of the compressor train reveals a potentially recoverable exergy of
1.2MW in the form of increased exergy in the cooling water. In the presented analysis these
values are contained within the exergy destruction values shown in Table 3.1. They are obtained
0 20000 40000 60000 80000 100000 120000 140000 160000 Exer gy Dest ru ction R ate [ kW]
Expander Train Exergy Destruction
Rate
0% 10% 20% 30% 40% 50% 60% 70% 80% 90% 100% Recouperator HP CombustorHP Expander LP Combustor LP Expander
2n d Law Eff ic ie n cy
by calculating the exergy increase in the water side of the intercoolers. It must be noted that this
is in a system which is not optimized for exergy recovery in the compression stage. The analysis
shows that the potential does exist, with a properly designed system, for second-generation
CAES to provide an efficiency increase over traditional first-generation CAES.
While the compressor and expander trains were analyzed as separate systems, they are
interconnected. Were a compression train designed specifically to maximize heat recovery from
the intercoolers, the potential does exist for reduction of fuel usage in the expander train.
Analysis of the expander train reveals an important fact: the highest exergy destruction occurs in
the combustors. As the goal of second generation CAES is to reduce the amount of fuel used by
a CAES facility, the efficiency increase that is possible comes from reduction of fuel usage.
While complete elimination of the combustors is considered impractical, a reduction in fuel
usage would allow for a reduction in exergy destruction, and therefore result in an increase in
overall system efficiency. This may be achieved by modifying the compressor designs to
increase recoverable exergy in the intercoolers. Careful analysis is required, however, in order to
maximize the potential for heat recovery in the compressor train.
The next step is to optimize a theoretical second-generation CAES facility based on the
exergy methods outlined in this paper. While some of this work has been done in a very general
sense [2] a second-law based optimization algorithm for second-generation CAES is the ultimate
36 3.5 Data Tables
Table 1 – Compressor Train Exergy Analysis
Component Low Pressure Compressor Low Pressure Intercooler Intermediate Pressure Compressor 1 Intermediate Pressure Intercooler 1 Intermediate Pressure Compressor 2 Intermediate Pressure Intercooler 2 High Pressure Compressor Aftercooler Flow Exergy Input [kW]
0 13,984 10,564 20,168 17,900 25,994 24,213 33,651
Mechanical Exergy Input [kW]
15,608 0 11,125 0 9,470 0 11,030 0
Total Exergy Input [kW]
15,608 13,984 21,689 20,168 27,371 25,994 35,243 33,651
Exergy
Output [kW] 13,874 10,564 20,168 17,900 25,994 24,213 33,651 31,499
Exergy Destruction
[kW]
1,623 3,420 1,521 2,268 1,376 1,781 1,592 2,151
2nd Law Efficiency
[%]
Table 2 – Expander Train Exergy Analysis
Component Recuperator High Pressure
Combustor High Pressure Turbine Low Pressure Combustor Low Pressure Turbine Flow Exergy Input
[kW]
103848 78949 105620 84817 151302
Chemical Exergy Input [kW]
0 137807 10878 224025 12875
Total Exergy Input [kW]
103848 216757 116498 308843 164177
Mechanical Exergy Output [kW]
0 0 26473 0 87403
Chemical Exergy Output [kW]
0 10878 10878 12875 12875
Flow Exergy Output [kW]
92192 105620 68838 151302 41641
Total Exergy Output [kW]
92192 116498 106189 164177 141919
Exergy Destruction [kW]
11655 100258 10309 144665 22258
2nd Law Efficiency [%]
38 References
[1] Succar, S., Williams, R. (2008) Compressed Air Energy Storage: Theory, Resources and Applications for Wind Power, Princeton University Energy Systems Analysis Group. [2] Grazzini, G., Milazzo, A., (2007) Thermodynamic analysis of CAES/TES systems for
renewable energy plants, Renewable Energy, Vol. 33, pp. 1998-2006
[3] Pickard, W.F., Hansing, N.J., Shen, A.Q. (2009) Can large-scale advanced-adiabatic
compressed air energy storage be justified economically in an age of sustainable energy?, Journal of Renewable and Sustainable Energy, Vol. 1 No. 3, p 033102 (10 pp)
[4] Osterie, J.F. (1991) The Thermodynamics of Compressed Air Exergy Storage, Journal of Energy Resources Technology, Vol. 113, pp. 7-11
[5] Najjar, Y.S.H., Jubeh, N.M. (2006) Comparison of performance of compressed-air energy-storage plant with compressed-air energy-storage with humidification. Proceedings of the Institute of Mechanical Engineers Part A: Power and Energy Vol. 220, P. 581-586. [6] History of First U.S. Compressed-Air Energy Storage (CAES) Plant (110 MW 26h) Volume
2: Constructon, EPRI, Palo Alto, CA, 1994. TR-101751-V2
[7] Nakhamkin, M., Anderson, L., Turpin, D., Howard, J., Meyer, R., Schainker, R., Pollak, R., Mehta, B. (1992) First U.S. CAES Plant Initial Startup and Operation, Proceedings of the American Power Conference, Vol. 1, pp. 154-161
[8] Bejan, A., Tsatsaronis, G., Moran, M. (1996). Thermal Design and Optimization. Toronto, ON. John Wiley & Sons.
[9] Cengel, Y.A., Boles, M.A. (2006). Thermodynamics an Engineering Approach (5th Edition). Toronto, ON. McGraw Hill.
[10] Nakhamkin, M., Swensen, E., Schainker, R., Mehta, B. (1989) CAES Plant Performance and Economics as a Function of Underground Salt Dome Storage Transient Processes, American Society of Mechanical Engineers (Paper), GT143, 5p
CHAPTER IV
FUTURE WORK
At the current stage of CAES development a “black box model”, shown in Figure 4.1, has
been established to demonstrate relationships between the principal components of CAES facility
optimization and design. A complete determination of the discrete inputs to each section of the
model is still required.
Figure 4.1 – A “Black-Box” Model for CAES in Ontario
Completion of the work contained in this thesis is a necessary enabling step
towards a fully comprehensive feasibility study for CAES in Ontario. In this vein, the
feasibility study will be broken down into three major sections as follows:
1. Geology and Geography
2. Facility Design and Configuration
40
The output of the geology and geography portion of the CAES facility model
should include such features as: an interactive Geographic Information System (GIS)
mapping model which contains information which would affect the optimization and
design of a CAES facility. The output of this model will aid any potential user in
selecting a site for a CAES facility by providing relative site-selection scores based on all
of the factors listed. The GIS model will then provide the inputs for a CAES facility
design optimization model which is the second portion of the feasibility study.
The facility design and configuration section of the feasibility study should
consist of optimizing the configuration of a CAES facility in Southwestern Ontario based
on the chosen geology/geography (from the GIS model outputs). Outputs from this
model will then feed the economics analysis or re-feed the geology/geography model for
further refinement of the site selection. Based on the information presented in this thesis,
an exergy-based optimization model is preferred, especially when considering
construction of an Advanced Adiabatic CAES facility.
The economic analysis of presented would then use inputs generated from the
facility optimization model. The outputs of the economic model would then be used to
further refine the facility configuration and then finally to produce an
economically-viable operating plan in order to support renewable energy electricity generation.
Development of an exergy-based optimization method of CAES facilities should
be the focus of the design optimization phase. The ultimate goal of this research being a
dynamic model which would enable CAES facility designers to specify the prevailing
conditions relevant to plant configuration such as ambient air conditions, power available
conditions and a variation of the exergy methods presented in Chapter 3 and Appendix A,
the iterative tool would then be used to specify the number and approximate power of
compressor and turbine stages as well as any heat recovery or recuperation devices.
Utilizing the geologic and economic models to further increase the fidelity of this
approach will allow designers of future CAES systems the ability to produce the most
42 APPENDIX A
ALABAMA CAES FACILITY OPERATING DATA2
State Pressure [kpa abs] Temperature [K] Mass Flow [kg/s]
First Compressor Inlet 100 295 89
First Intercooler Inlet 410 460 89
Second Compressor Inlet 402 305 89
Second Intercooler Inlet 1073 424 89
Third Compressor Inlet 1058 305 89
Third Intercooler Inlet 2454 407 89
Fourth Compressor Inlet 2433 305 89
Aftercooler Inlet 6267 423 89
Aftercooler Outlet 6236 322 89
Table A.1 – Compressor Train (Air) Operating Data
Intercooler
Inlet Water Temperature [°C]
Outlet Water
Temperature [°C] Mass Flow [kg/s]
First Stage 26.1 42.8 230
Second Stage 26.1 41.7 185
Third Stage 26.1 42.8 138
Aftercooler 26.1 42.8 132
Table A.2 – Intercooler Water-side Operating Data
Location Temperature [K] Pressure [kPa abs] Mass Flow [kg/s]
Recuperator Inlet (Cavern Side) 308 4482 143
High Pressure Combustor Inlet 559 4351 146
High Pressure Turbine Inlet 811 4309 146
Low Pressure Combustor Inlet 654 1627 147
Low Pressure Turbine Inlet 1144 1517 147
Recuperator Inlet (Exhaust Side) 641 105 147
Recuperator Outlet 407 102 147
Table A.4 – Expander Train Air Data


![Figure 2.4 – Wind Speed at 80m AGL and Renewable Energy Resources [33]](https://thumb-us.123doks.com/thumbv2/123dok_us/1445542.1177111/31.612.113.542.84.455/figure-wind-speed-m-agl-renewable-energy-resources.webp)