ABSTRACT
WRIGHT, TIMOTHY PETER. Experimental Studies in Ice Nucleation. (Under the direction of Markus D. Petters).
Ice nuclei play a critical role in the formation of precipitation in mixed phase clouds. Modification of IN concentrations can lead to changes in cloud lifetimes and precipitation size. Presented in this study are experimental investigations into ice nuclei in an ongoing effort to reduce the uncertainties that ice nuclei have on cloud processes and climate. This research presents a new version of the cold stage drop freezing assay to investigate the time-dependence of heterogeneous nucleation. The temperature range for the instrument spans from the melting point of water to the homogeneous freezing limit of ~-38 deg C.
Temperature stability for the instrument allowed for experimental operation for up to four days while interrogating the same sample. Up to a one hundred fold increase in the number of analyzed drops was accomplished through an in-house written automated drop freezing detection software package. Combined instrument design improvements allow for the analysis of IN concentrations down to ~10-8 ice nuclei per picoliter of sample water.
A new variant of the multiple-component stochastic model for heterogeneous ice nucleation was used to investigate the time dependence of heterogeneous freezing processes. This was accomplished by analyzing how the changes in the cooling rate can impact the observed nucleation rate. The model employed four material-dependent parameters to accurately capture the observed freezing of water drops containing Arizona Test Dust. The parameters were then used to accurately predict the freezing behavior of the drops in time dependent experiments. The time dependence freezing of a wide range of materials was then investigated. These materials included the minerals montmorillonite and kaolinite, the biological proxy ice nuclei contained within the product Icemax, and flame soot generated from the incomplete combustion of ethylene gas. The time dependence for ice nuclei collected from rainwater samples was also investigated. The data show that the time dependence for all investigated materials was weak.
impinger and the solutions were transferred to the drop freezing assay to be analyzed for ice nuclei activity. The IN concentration in collected rainwater was analyzed and compared to IN concentrations near the ground to determine if potential IN enhancement due to pollen
bursting at the surface was also found within clouds. No general trend was observed between ambient pollen counts and observed IN concentrations, suggesting that ice nuclei
multiplication via pollen sac rupturing and the subsequent release of macromolecules was not prevalent for the pollen types and meteorological conditions typically encountered in the Southeastern US.
Experimental Studies in Ice Nucleation
by
Timothy Peter Wright
A dissertation submitted to the Graduate Faculty of North Carolina State University
in partial fulfillment of the requirements for the degree of
Doctor of Philosophy
Marine, Earth, and Atmospheric Sciences
Raleigh, North Carolina 2014
APPROVED BY:
_______________________________ ______________________________
Dr. Markus Petters Dr. Nicholas Meskhidze
Committee Chair
________________________________ ________________________________
DEDICATION
BIOGRAPHY
Tim grew up in western North Carolina. He received B.S. in both Electrical
ACKNOWLEDGMENTS
TABLE OF CONTENTS
LIST OF TABLES ... ix
LIST OF FIGURES ... xi
1. INTRODUCTION ... 1
1.1 Classical Nucleation Theory ... 1
1.2 Heterogeneous Nucleation ... 3
1.3 Ice Nucleation Modes ... 5
1.4 Ice Nuclei and Clouds ... 7
1.5 Known Ice Nuclei ... 9
1.6 Current Ice Nuclei Instruments ... 11
1.7 Dissertation Objectives and Outline ... 13
1.8 References ... 15
2. ROLE OF TIME IN HETEROGENEOUS ICE NUCLEATION ... 23
2.1 Introduction ... 24
2.2 Methods ... 26
2.2.1 Experimental Approach ... 26
2.2.2 Modeling Approach ... 30
2.3 Results ... 33
2.4 Discussion and Conclusions ... 39
2.5 Summary ... 43
3. MINIMAL COOLING-RATE DEPENDENCE OF ICE NUCLEI ACTIVTY IN
THE IMMERSION MODE ... 62
3.1 Introduction ... 63
3.2 Motivation ... 65
3.3 Methods ... 67
3.4 Results ... 71
3.5 Discussions and Conclusions ... 73
3.6 References ... 77
4. CONTRIBUTION OF POLLEN TO ATMOSPHERIC ICE NUCLEI ... 87
4.1 Introduction ... 89
4.2 Methods ... 90
4.2.1 Experimental Procedures ... 90
4.2.2 Ice Nuclei Analysis Methods ... 95
4.2.3 Example Analysis ... 98
4.3 Results ... 101
4.4 Discussion ... 104
4.5 Conclusions ... 110
4.6 References ... 111
4A Appendix - Particle collection and sampling efficiencies ... 117
5. HIGH RELATIVE HUMIDITY AS TRIGGER FOR WIDESPREAD RELEASE OF ICE NUCLEI ... 131
5.1 Introduction ... 132
5.3 Results and Discussion ... 134
5.4 Conclusions ... 136
5.5 References for Letter ... 138
S5. Supplementary information ... 142
S5.1 Ice nuclei concentration measurements ... 142
S5.1.1 Sample collection details ... 142
S5.1.2 Drop freezing assay and IN concentration measurements ... 143
S5.2 Fluorescent measurements ... 144
S5.3 Measurement site and meteorological conditions ... 147
S5.3.1 Site details ... 147
S5.3.2 Case study 1, Aug 1-2, 2013 ... 147
S5.3.3 Case Study 2, Aug 7-8, 2013 ... 148
S5.4 Additional results ... 149
S5.5 Model predictions ... 150
S5.6 Supplementary information references ... 151
6. CONCLUSIONS ... 171
APPENDICES ... 173
Appendix A: Temperature Calibration Algorithm ... 174
Appendix B: Drop Freezing Detection ... 178
Appendix C: Generating a Random Number from an Arbitrary Probability Density Function ... 181
LIST OF TABLES
Table 2.1 Function A1 – Active site generation ... 51
Table 2.2 Function A2 – Discrete freezing simulator ... 52
Table 4.1 Summary of swirling aerosol collector sampling times ... 119
Table 4.2 Summary of rain water collection times ... 120
Table S5.1 Fluorescence excitation-emission profile (EEP) values. Values are given in arbitrary units. FP particles must fluoresce > 0 in at least one of the three channels. ... 154
Table S5.2 Number statistics. Rows 1-5, denote the percentage of fluorescing particles identified in each group. Row 6 is the total number of particles detected by the WIBS-4A and row 7 is the total number of particles that fluoresced. ... 155
Table A.1 Fit coefficients for temperature calibration equation. ... 176
Table B.1 Pseudo-code for drop freezing detection algorithm. ... 180
Table C.1 Pseduo-code to generate a random particle diameter based on an arbitrary CDF. ... 182
Table E.1 Event 031 – Rain, snow, sleet ... 194
Table E.2 Event 032 – Rain, sleet ... 200
Table E.3 Group 1 – 2 week run ... 203
Table E.4 Group 2 – 24 hour run ... 215
Table E.5 Group 3 – 24 hour run ... 218
Table E.6 Group 4 – WIBS Comparison ... 221
Table E.7 Group 5 – 24 hour run ... 222
Table E.9 Group 7 – Event 046 ... 227
Table E.10 Group 8 – 9 hour ... 229
Table E.11 ATD ... 231
Table E.12 Kaolinite ... 237
Table E.13 Montmorillonite ... 238
Table E.14 Pollen ... 239
Table E.15 Pure ... 246
Table E.16 Unsorted Rain ... 251
Table E.17 Multi Cooling Rate ... 264
LIST OF FIGURES
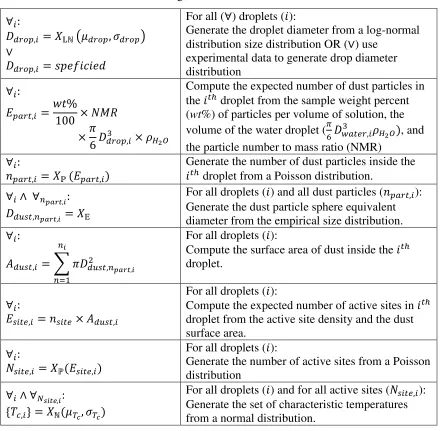
Figure 2.1 Schematic of experimental setup. ... 53 Figure 2.2 Modeled dependence on the variation in the refreeze temperature
( ) versus the slope of the nucleation rate with respect to temperature (u parameter). Each point is the average of 100 modeled refreeze experiments. Vertical bars correspond to
± one standard deviation. The solid line is a power law fit to the
average values. ... 54 Figure 2.3: Observed freezing temperatures of four individual drops containing
0.1 wt% ATD over 40 refreeze experiments. Horizontal lines
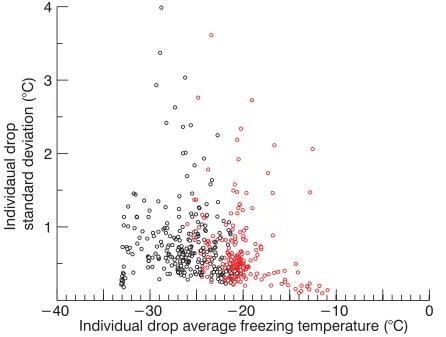
correspond to the mean (blue) and ± one stand deviation around the mean (red) of the average freezing temperature. The top two panels are drops that pass the autocorrelation test and the bottom two panels fail the autocorrelation test for randomness. ... 55 Figure 2.4 Mean drop freezing temperature vs. the standard deviation of the
freezing temperature. Open circles represent drops that failed the
auto correlation test. ... 56 Figure 2.5 Drop freezing temperature vs. percent of drops frozen. Overlaid are
model results using the model presented in Section 2.2 and
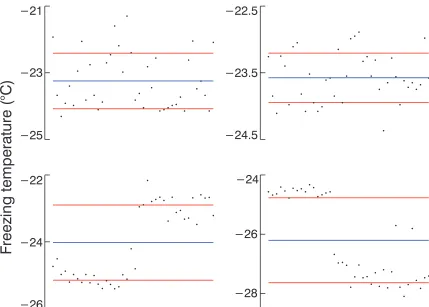
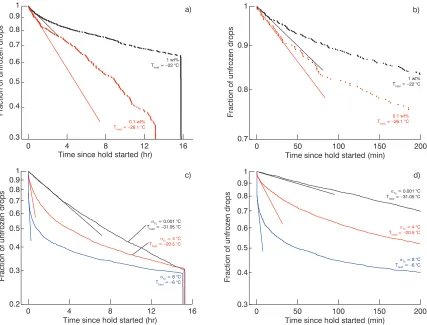
Appendix A. ... 57 Figure 2.6 Temperature at which 50% of drops containing 0.1 wt% ATD froze
as a function of cooling rate (red filled circles). Open circles correspond to the average prediction from 20 simulations. Vertical bars correspond to ± one standard deviation. Numbers indicate the order in which the cooling rates were performed. Solid lines are
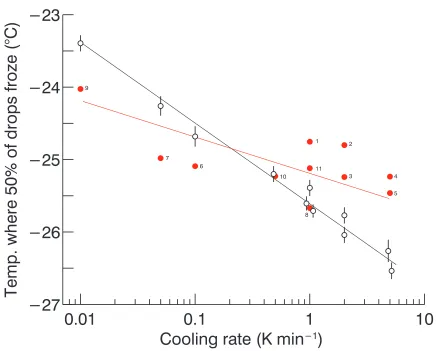
Figure 2.7 Fraction of unfrozen drops over the time while the temperature is held constant. Panel a shows two separate hold experiments. Panel b is the same as panel a with data restricted to the drops that froze in first 200 minutes. Panel c demonstrates modeled drop freezing when
is varied and Thold is adjusted so that ~30% of the drops remain unfrozen at the end of the hold. Panel d is the same as panel c with data restricted to the drops that froze in the first 200 minutes. In all four panels, straight lines provided to help gauge the linearity of the
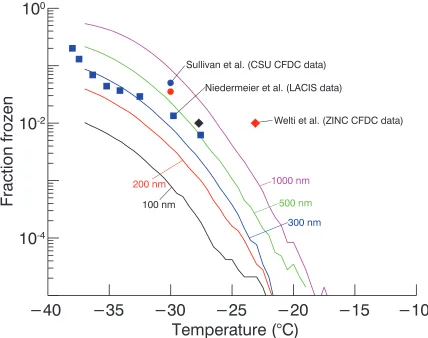
curves. ... 59 Figure 2.8 Comparison of model extrapolation to data from literature. Data are
taken from Niedermeier et al. [2010] (blue squares), Sullivan et al. [2010a] (red circle), Sullivan et al. [2010b] (blue circle), and Welti et al. [2009] (diamonds). Colors indicate the particle diameter used
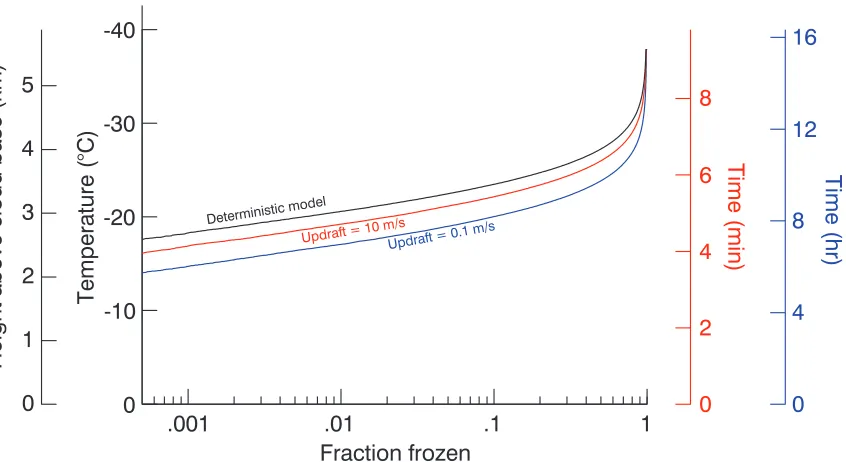
in the respective study. Lines show model predictions based on the same parameter set used to model Figure 2.5. ... 60 Figure 2.9 Modeled fraction of droplets freezing vs. height above cloud base,
temperature, and time. Model calculations are based on the
parameters used in Figure 2.5 and include time-dependent treatment for updrafts of 0.1 m/s (blue line) and 10 m/s (red line) as well as the deterministic time-independent treatment (black line). ... 61 Figure 3.1 Summary of ice nucleation data for five proxy IN substances. Plots
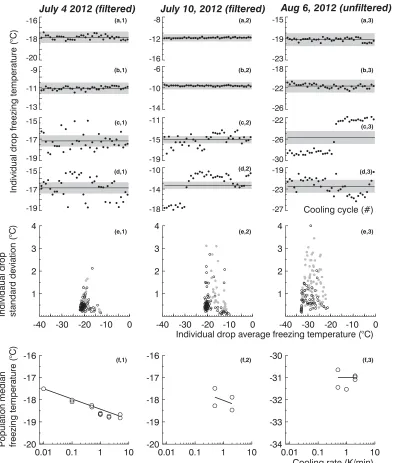
(a,1)-(d,5): variation in freezing temperature for selected individual droplets. The x-axes are defined in the bottom-right of the rows. Shaded area indicates the mean standard deviation for all drops in the sample and is centered about the mean freeze temperature for the individual drop. Plots (e,1)-(e,5): standard deviation of freezing
temperature vs. average freezing temperature for all observed droplets; gray circles are drops that failed the autocorrelation test. Plots
(f,1)-(f,5): variation of the population median freezing temperature with cooling rate. Data for Arizona Test Dust are taken from Wright and Petters [2013]. See text for details. ... 83 Figure 3.2 Same as Figure 3.1, but for three separate rainwater samples collected
Figure 3.3 Summary of the average standard deviation of the freezing
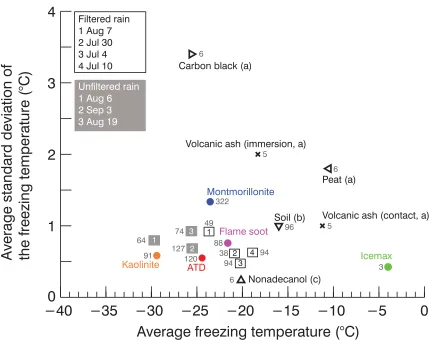
temperature for a wide range of substances. Colored filled circles: population averages for proxy ice nuclei data from Figure (e,1)-(e,5) that passed the autocorrelation test. Squares: population averages for ambient ice nuclei extracted from filtered and unfiltered rainwater from Figure 2 (e,1)-(e,3) and four additional samples not shown in Figure 2 that passed the autocorrelation test. Remaining symbols: proxy ice nuclei data from prior studies; (a) Fornea et al. [2009], (b) Vali [2008], (c) Zobrist et al. [2008]. Numbers beside marks
indicate the number of drops included in that particular measurement. Except where noted, all experiments are assumed to be in the
immersion mode. ... 85 Figure 3.4 Standard deviation of freezing temperature vs. average freezing
temperature for rain water droplets that passed the autocorrelation test. Combined results of three unfiltered (black circles) and four filtered (red circles) rain measurements. ... 86 Figure 4.1 Panel (a): a section of the field of view for a picodrop experiment. The
small images to the right depict enlarged examples of individual picodrops prior to freezing (left column) and after freezing (right column). Panel (b): field of view recorded for a nanodrop experiment, the columns to the right are similar to those in panel (a). Panels (c) and (d): fraction of droplets frozen versus temperature for picodrop and nanodrop experiments, respectively, of both pure water and a 0.01 wt% suspension of ATD. ... 121 Figure 4.2 Dashed line: synthetic IN concentration used to generate a randomized
instance mimicking the number and size distribution of picodrop and nanodrop experiments shown in Fig. 1c and 1d. Blue and red lines: inverted IN concentrations for a simulated single experiment using Eq. (4) for picodrop and nanodrop experiments, respectively. ... 122 Figure 4.3 Summary of ice nucleation experiments with ultrapure water. Ice
nuclei are expressed as the number of apparent ice nuclei per picolitre of water. Triangles represent picodrop experiments and circles represent nanodrop experiments. Filled symbols indicate filtered/resuspended data. Red circles demonstrate transient noise in the nanodrop experiments in the -20 to -30 °C range. Indicated in the top right corner is the average median drop volume for each class of droplets. The grey shaded area indicates an estimate of the
Figure 4.4 Cumulative ice nuclei spectrum for a suspension of 0.01 wt% of ATD in ultra pure water. Open and filled symbols correspond to unfiltered and filtered/resuspended experiments, and the numbers in the top right are similar to those in Fig. 3. The filtered/resupspended experiments correspond to a pre-concentration of ATD of 50:1. The second axis expresses the data as number fraction of dust serving as IN based on the dust number to mass ratio. The third axis expresses the data as IN active site (INAS) density based on the specific surface area and
density of dust provided by the manufacturer. ... 124 Figure 4.5 Example cumulative ice nuclei spectra from the SAC on April 8.
Left: analysed in the same manner as shown in Fig. 4. The grey shaded area corresponds to the background concentration in the water samples shown in Fig. 3. Due to the addition of pure water to the SAC to maintain operation, the noise level was either multiplied by two (dashed line) or three (thick solid line) depending on the SAC run time. Right: same data as in the left plot but with background
concentration (thick solid line in this case) of IN in the ultra-pure water subtracted and expressed as IN L-1 of air. The red line is the one degree average of the IN concentration. Overlaid in blue is the Fletcher parameterization using Eq. 7. ... 125 Figure 4.6 Number of nucleation sites per pollen grain as a function of
temperature for various pollen types. Data from this study is shaded in blue. All other data were obtained from Fig. 15 of Murray et al.
(2012). References to the original source are provided in the legend. ... 126 Figure 4.7 Hourly precipitation (black line), 24 hour pollen grain concentrations
(open red circles), and derived IN concentrations at T = -20 ºC (filled blue circles) for the month of April 2013. ... 127 Figure 4.8 Summary of ambient air ice nuclei data during the April pollen season.
Number of IN per litre of air is obtained from the SAC. The label in the bottom left of each plot indicates the date and time the sample was collected. The “N” value in the top right corner denotes the average number of pollen grains per litre of air during the closest 24 h period that N.C. Department of Air Quality pollen counts coincided with sample collection. The symbols corresponding to picodrops and nanodrops are identical to those in Fig. 3. The red lines are the one degree averages of the IN concentrations. The horizontal dashed line corresponds to IN concentrations of 1 L−1 and is added to guide the
Figure 4.9 The primary y-axis gives the number of ice nuclei per pL of water measured in precipitation samples. The secondary y-axis roughly approximates IN concentrations per litre of air, assuming that 1 pL ~1 cloud droplet and a cloud droplet number concentration of 100 cm−3. The label on the bottom left of the plot indicates the date and
time during which the sample was collected. The horizontal dashed line corresponds to IN concentrations of 1 L−1 and is added to guide
the eye. ... 129 Figure 4.A1 Particle transport efficiency as a function of particle size through the
inlet of the SKC swirling aerosol collector. The black line is the calculated transport efficiency using Eq. 8-67 from Baron and
Willeke (2001). The red line is the transport efficiency found using the Particle Loss Calculator (von der Weiden et al., 2009). The shaded grey area is range of particle diameters for burst pollen grains (Suphiopglu et al., 1992; Taylor et al., 2002). ... 130 Figure 5.1 Schematic of how an increase in relative humidity, due to a cold-
frontal passage, can trigger biological ice nuclei release followed by
seeding of the frontal cloud band with the lofted ice nuclei. ... 156 Figure 5.2 Particle number concentrations over 24 hours, starting at August 1,
13:00 local time. Measured three hour ambient IN concentration at T = -15 ºC (circles), -20 ºC (squares), -25 ºC (triangles), and FP3 fluorescent particle concentration (black). Red and black colors correspond to the red and black ordinal axes respectively. Grey
shading indicates times of rainfall. ... 157 Figure 5.3 Correlation of RH and FP3 particle concentration (a) and RH and IN
concentration (b) for the Aug. 1-2 frontal passage. In the left panel each color corresponds to a continuous time period indicated by the
inset RH plot. For expanded temporal RH data see SI S5.3. ... 158 Figure S5.1 Each panel represents a three hour ambient IN spectra for August 1-2.
Triangles and circles indicate picodrops and nanodrops, respectively. The red line corresponds to running average concentration. Crosses and numbers indicate the concentration at T = -15, -20, and -25°C,
Figure S5.2 Each panel represents a three hour ambient IN spectra for August 7-8. The red line corresponds to running average concentration. Crosses and numbers indicate the concentration at T = -15, -20, and -25°C, which are reported in the figures of the main manuscript. No
nanodrop experiments are reported due to instrument malfunction. ... 160 Figure S5.3 IN concentration in collected rainwater. Triangles and circles indicate
picodrops and nanodrops, respectively. The red line corresponds to running average concentration. No nanodrop experiment is reported in Figure S5.3a due to instrument malfunction. ... 161 Figure S5.4 Frequency distribution of the three WIBS-4A fluorescence channels.
The value on each axis corresponds to the intensity reported by the WIBS-4A divided by 1,000 and is in arbitrary units. Colors denote the fraction of particles that fall within a cube that is 0.05 a.u. on an edge. No symbol is drawn for empty cubes. Red lines demark excitation-emission profile regions FP1 to FP5. Panels (a) and (b) are for total particles sampled during the August 1-2 and August 7-8 measurement periods, respectively. ... 162 Figure S5.5 (a) Conditions on August 1-2, 2013 as reported by the National
Weather Service across the continental US. The red marker along the east coast shows the location of the measurement site. Meteorological conditions at the site: (b) Measured temperature (black) and relative humidity (red). (c) Calculated mixing ratio (black) and equivalent potential temperature (red). (d) Measured pressure (black) and wind
speed (red). Grey shaded area indicates precipitation times. ... 163 Figure S5.6 Same as Figure S5.5 for August 7-8, 2013. ... 164 Figure S5.7 FP3 fluorescent particle number concentrations (black line) over 24
hours starting at August 7, 12:00 LT. Ambient IN concentration at T = -15, -20, and -25 °C are represented by circles, squares, and triangles, respectively. Red and black colors map to the red and black ordinal axes respectively. ... 165 Figure S5.8 Correlation plots for the August 1-2 case study. Scatterplot
comparison between three hour average of RH and IN concentration active at (a) T = -15 °C, (b) T = -20 °C, and (c) T = -25 °C. Correlation
plots between RH and (d) FPAP particle concentration, (e) total fluorescing particle (FP) concentration, and (f) FP3 particle
Figure S5.9 Correlation plots for the August 7-8 case study. Panels are the same as those in Figure S5.8. ... 167 Figure S5.10 Scatterplots showing the correlation of IN concentration at T = -15,
-20, and -25 °C with FP (a,d), FBAP (b,e), and FP3 (c,f) particle concentration. The correlation coefficient for each temperature
compared to the specific fluorescence particle category is shown in the upper left of each panel. Top row is for the August 1-2 case study and bottom row is for the August 7-8 case study. ... 168 Figure S5.11 Top panels: Size distribution for all particles measured during the
(a) August 1-2 measurement period and (b) August 7-8 measurement period. The total particle concentration (black), total fluorescing particle (FP) concentration (red), and FP3 fluorescing particle concentration (blue). Bottom panels: Fraction of total particles that fluoresced in any channel (red) and fraction of total particles that fluoresced in FP3 (blue) for (c) August 1-2 measurement period
and (d) August 7-8 measurement period. ... 169 Figure S5.12 Particle number concentrations over 24 hours starting at (a) August 1,
13:00 and (b) August 7, 12:00 local time. Total measured particle concentration (red solid), total measured fluorescent particle concentration (black solid), and measured IN concentration at T = -20 °C (black squares). Predicted IN concentration active at T = -20 °C using the DeMott et al. (2010) Eq. (1) (blue dashed) and Tobo et al. (2013) (solid blue) are superimposed. Black and blue lines are mapped to the left ordinal axis and red lines are mapped to the
right ordinal axis. . ... 170 Figure A.1 Examples of calibration measurements. The vertical axis is the
difference between the temperature in the squalene and the recorded temperature as a function of recorded temperature for the instrument operating at 1 K/min (red) and 2 K/min (blue). Lines of best fit are
overlaid on measured data. ... 177 Figure D.1 Bottom plate. This plate rests on the TECA cooling unit and acts a
mounting point for the thermoelectric module and cell. ... 184 Figure D.2 Aluminum bridge piece. This piece thermally bridges the
thermoelectric with the aluminum dish and also houses the
Figure D.3 Drop freezing assay cell. Chamber to place aluminum sample dishes in. NPT fittings on side are meant to allow the connection of a dry nitrogen line. The 1 mm holes in the side are to allow for the
insertion of thermistors. Aluminum plate from Figure A2 screws into the bottom of cell. ... 186 Figure D.4 Cell lid. The lid fits into the cell and seals it. An O-ring needs to be
fitted into the groove to ensure the cell is sealed. ... 187 Figure D.5 Aluminum sample dish. These two pieces for the aluminum sample
1. INTRODUCTION
Ice nuclei (IN), from natural and anthropogenic sources, are an important part of the cloud lifecycle. They are particles, that when present, induce cloud droplet freezing at temperatures warmer than the homogenous freezing limit of ~-38 °C [Pruppacher and Klett, 1996]. Ice nuclei are rare in the atmosphere [Rogers et al., 1998] and the particles have a diverse makeup leading to large differences in the temperature and mechanism by which they nucleate ice [Murray et al., 2012]. This scarcity of particles and the heterogeneity in their properties leads to uncertainty in how they impact cloud microphysics. Perturbations in IN concentrations can alter the cloud albedo, lifetime, and precipitation volume and thus such changes can have a global impact on the climate [DeMott et al., 2010]. This chapter provides a brief review of current topics in ice nucleation research and how they relate to the presented research. These topics include an overview of classical nucleation theory, the various
recognized ways in which heterogeneous ice nucleation occurs, the relationship of IN with clouds and climate, a survey of known IN, and an introduction to previous and current IN instruments.
1.1 Classical Nucleation Theory
Classical nucleation theory is a framework for describing the formation of a more ordered phase from the parent meta-stable phase [Kashchiev, 2000]. This theory can be applied to the formation of liquid water drops from water vapor or the nucleation of ice from supercooled water. Homogeneous freezing of pure water droplets occurs when the statistical fluctuations in the arrangements of water molecules produces an ice-like structure (often called a germ). As the germs grow through random fluctuations, there is an increase in the free energy (G) that is proportional to the change in surface area of the new phase
increases the surface area, but decreases the free energy as the germ adopts the volume energy of the emerging phase. The critical surface area occurs at
0 (1)
Assuming a hexagonal prism of height equal D, the critical diameter (D*) of the ice germ can be determined from the critical surface area and is:
∗ ∝
⁄ (2)
where c1 is approximately constant and Tm is the melting point of water (in Kelvin). This equation shows that as the temperature decreases, the necessary critical diameter for freezing also decreases.
At any given time there is a distribution of ice germs within a volume of water. This distribution is described by the Boltzmann’s distribution [Pruppacher and Klett, 1996]. A germ that has reached the critical size has free energy of G* and therefore the number of critical size germs (ngerms) is:
∝ exp ∗ (3)
where k is the Boltzmann’s constant.
For a water molecule to move from the parent phase of liquid to the new ice phase, it must move from its minimum potential energy in water to the new equilibrium potential energy in ice [Turnbull and Fisher, 1949]. This change in energy is defined g’ which is the molar Gibbs free energy of activation for diffusion of water molecules across the water–ice boundary. The diffusive flux density (wdiff) across the interface can be described with this energy as:
∝ exp ∗ (4)
The rate at which germs progress past the critical size is known as the nucleation rate (J, units cm-3 s-1) and is a function of the diffusive flux density, the number of critical clusters that form, a freezing coefficient (0 < < 1) which denotes the probability of a liquid
(5) Substitution leads to the following equation
exp ∗ ∗ (6)
where c is approximately constant over typical experimental temperature ranges. Two key points to draw from the above equation are that as the temperature decreases, the nucleation rate will increase. In addition to the temperature dependent terms in the exponent, the cluster size is driven by the degree of super cooling which in turn increases G*. As the free energy increases, the nucleation rate will decrease. However, this term no longer dominates at sizes larger than the critical germ size.
The median temperature at which a population of identical pure water drops freezes was documented by Langham and Mason [1958]. For drops with diameters at 100 and 650
m the median freezing temperatures is approximately -35.2 and -33.5 °C, respectively. As droplets get smaller, the super-cooling temperature required to initiate homogeneous freezing gets colder. Droplets that are about 1 m in diameter (smaller than most cloud droplets) are expected to freeze at approximately -41 °C, which is colder than the atmospherically relevant freezing extreme of ~-38 °C for a cloud droplet that is 10 m in diameter. Thus a
comprehensive IN instrument that can analyze atmospherically relevant water droplet volumes is expected to be able to reach ~-40 °C. Additionally, the homogeneous freezing limit of pure water can be used to ascertain possible contamination and establish the noise floor of the instrument.
1.2 Heterogeneous Nucleation
The size that a germ must reach to nucleate the ice phase is dependent on
temperature. However, the presence of certain foreign particles makes the initial growth of the germ more probable by decreasing the number of chance molecular collisions needed to reach the critical diameter. Ice nucleation in this way is termed heterogeneous nucleation and the particles are called ice nuclei. Not all particles can act as ice nuclei and characterizing the surface of known IN is problematic. Several models have been formulated to explain
Singular/deterministic model
In the singular, or deterministic, model critical clusters form on nucleation sites that activate freezing at some critical temperature Tc [Pruppacher and Klett,1996; Vali, 1994; Vali, 2008]. If multiple types of nucleation sites exist within the drop, then nucleation proceeds on the site with the warmest Tc. If the IN is a non-homogeneous material (i.e., clay dusts), the characteristic freezing temperatures are part of a distribution of temperatures so that the model can describe observed drop to drop variability in freezing. Implicit in this model is that nucleation only occurs at the critical temperature and therefore if a drop containing an IN active site is cooled to some temperature warmer than the critical
temperature and held constant, nucleation will never occur. In other words there is no time dependence in this model. Additionally the model predicts that if the drop freezes and then is thawed multiple times, it will always freeze at the same temperature. To account for the small, but non-negligible, variability in freezing temperatures due to different cooling rates, an empirical cooling rate dependent correction factor was developed [Vali, 1994] and the addition of this factor is termed the modified singular model.
Single component stochastic model
Classical nucleation theory provides a theoretical framework to explain
heterogeneous nucleation. In this approach it is assumed that nucleation sites on the IN enhance nucleation efficiency, but the nucleation still depends on random fluctuations in the cluster size [Murray et al., 2011]. Assuming heterogeneous nucleation is primarily dependent on the free energy, G*, and that it is of the same form as homogenous nucleation, then heterogeneous nucleation rate (Jhet) can be written as:
exp ∗ (7)
(8) where is the contact angle between the ice nucleus and the surface [Broadley et al., 2012]. This definition has little physical meaning as the germ is unlikely to take on a spherical form, however it does provide a reference parameter to compare different substance’s ability to nucleate ice.
Multiple-component stochastic model
There are a number of models that can be classified as multiple-component
stochastic. These models describe nucleation with variations of the single component model, but use more than one parameter to capture the heterogeneity of the IN surface. Murray et al. [2011] suggested that the nucleation rate for individual atmospheric constituents should be determined and that the final nucleation rate would be a combination of these individual models that would then allow for the development of an ice activation spectrum. To model the observed freezing temperatures of Arizona Test Dust, Marcolli et al. [2007] found that a log-normal distribution of contact angles captured the particle to particle variability.
Niedermeier et al., [2011] proposed a model in which IN were described with a conceptual soccer ball, with each panel of the ball having its own distribution of contact angles. A variant of the multiple-component stochastic model was used in this research [Wright and Petters, 2013]. The model uses a uniform density of active sites, but each drop contains a random number of dust particles and therefore a random number of active sites. Each site is randomly assigned a characteristic freezing temperature from a prescribed distribution which yields a unique time dependent nucleation rate. Further details are given in Chapter 2. 1.3 Ice Nucleation Modes
material) and then freezes. Finally, contact freezing occurs when a supercooled water droplet comes into contact with a solid particle that nucleates ice.
Deposition freezing was studied on dust samples within a cloud chamber and the conditions for nucleation were super-saturation with respect to ice was less than 1.15 and temperatures between -64 and -50 °C [Möhler et al., 2006]. In many situations field data and modelling studies indicate that liquid water droplets are prerequisite for ice formation in this mode. This implies that in mixed-phase clouds existing at temperatures warmer than -30 °C, deposition freezing is thought to have little impact compared to the other modes of freezing [Ansmann et al., 2009; Westbrook and Illingworth, 2011; Murray et al., 2012]. For cirrus clouds in the upper atmosphere where the conditions are more favorable for this mode of nucleation, deposition nucleation may not occur due to the lack of dry IN since the conditions for the formation of dry solid particles are rare [DeMott et al., 1997; Colberg et al., 2003] and dry IN from the surface are unlikely to survive the transfer to high altitudes without acquiring a liquid coating along the way [Kärcher and Lohmann, 2003].
explain the phenomenon where there is enhanced cloud ice formation in regions where cloud droplets are evaporating [Rosinski and Morgan, 1991; Cotton and Field, 2002].
The research presented in this dissertation examines immersion mode freezing. All measurements occurred by distributing IN within pure water from which the sample to be analyzed was drawn. Individual drops were produced by emulsifying the sample in an immiscible liquid. On an experimental level, studying ice nuclei in the immersion mode has the benefit of high temporal stability (droplets were interrogated for up to several days), allowing for the examination of the time dependence of heterogeneous ice nucleation (see section 1.2). As discussed in the next section, the observed freezing temperatures that occur within mixed phase clouds precludes deposition freezing from being the likely source of primary ice crystal formation. Additionally, the major difference between condensation and immersion freezing is in how the IN arrives within the drop. Thus, experiments operating in the immersion mode are assumed to mimic many rainfall and cloud processes.
1.4 Ice Nuclei and Clouds
The number of ice crystals in the warmer regions of mixed phase clouds does not always agree with concentration of IN that is expected to be active at those conditions. The number of ice crystals can exceed the available IN by up to three or four orders of magnitude [Hobbs, 1969]. Several explanations have been put forward to explain the excess of expected ice crystals. These explanations include fracturing of ice crystals during collision [Vardiman, 1978] and fragmentation of the liquid drops during freezing [Mason and Maybank, 1960]. The most likely explanation is the rime-splinter process (often called the Hallet-Mossop process [Hallett and Mossop 1974; Goldsmith et al., 1976]) whereby graupel falls and during ice particle riming additional ice splinters are formed and ejected. A more recent hypothesis for the observed excess of crystals is that the number concentration of ice crystals is an instrument artifact [Korolev et al., 2013] where ice crystals that are being measured in a cloud strike the instrument probe and shatter. This error was estimated to increase the ice crystal count by one to two orders of magnitude.
Although only 1 in 100,000 particles may act as an IN within the free troposphere [Rogers et al., 1998], they can exert a strong influence on cold cloud processes and the climate. If there are more IN in midlevel clouds (those with temperatures between -5 and -30 °C), there will be more ice crystals at the expense of cloud liquid water. This leads to more precipitation and a shorter cloud lifetime [Lohmann, 2002]. Midlevel clouds generally act to cool the planet and therefore their shorter lifetime would lead to a decrease in this cooling effect. Conversely, cirrus clouds trap long wave radiation and an increase in IN concentration is expected to decrease cirrus cloud lifetime. This would lead to a decrease in the net
1.5 Known Ice Nuclei
The research presented in the following chapters analyzed ice nuclei in both the laboratory and ambient atmosphere. The purpose of the following survey of types of IN is to place the analyzed materials in context with each other and with materials not covered in the research. The following IN are divided into three categories (mineral dusts, biological particles, and black carbon) and are some of the most common IN studied.
Mineral dusts
Mineral dusts are primarily derived from eroded surface rock which has been carried into the atmosphere by wind. Most minerals fall into two broad categories, primary and secondary. Primary minerals are from igneous type rocks (e.g., quartz and feldspar) while secondary minerals are derived from primary minerals through metamorphic or sedimentary processes (e.g., clay minerals) [Deer, 1992]. The concentrations of these aerosols in the atmosphere vary greatly, both temporally and spatially. An analysis of the particle residues collected from cloud ice crystals found that the ~50% of the composition of the particles originated from mineral dust [Pratt et al., 2009].
Natural mineral dust from arid regions dominates the fraction of mineral dusts in the atmosphere [Prospero et al., 2002]. Dusts collected from Asia, Sahara, Canary Isles, and Isarael [Connolly, 2009; Niemand, 2012] have comparable freezing temperatures (<-15 °C) and have similar active site density [Murray et al., 2012]. Natural minerals are never pure because of the processes that make them and the incomplete conversion from primary to secondary minerals [Deer et al., 1992]. To attempt to understand what portion of natural minerals nucleates ice, laboratory studies on single minerals was performed. NX-illite is a commercially available clay mineral that has been suggested to be a good proxy for natural dusts [Broadley et al., 2012] with an onset freezing temperature of ~-25 °C. The clay mineral kaolinite is a more extensively studied mineral. Lüönd et al. [2010] and Murray et al. [2011] found that the freezing temperatures of kaolinite to be similar to those of NX-illite. In addition to NX-illite, Arizona Test Dust (ATD) has been suggested as a proxy for
et al., 2012]. Unlike kaolinite, ATD is made up of the primary minerals quartz and feldspar. ATD was chosen as the IN to verify our instrument operation due to the number of previous studies [Marcolli et al., 2007; Connolly et al., 2009; Niedermeier et al., 2011; Niemand et al., 2012; Broadley et al., 2012], the ease of acquiring the mineral in bulk, and the high degree of particle size characterization.
Biological particles
Atmospherically suspended biological particles are key elements in the life cycle of many organisms and ecosystems. These particles are derived from microorganisms such as bacteria and fragments of biological materials such as plant debris and animal dander [Després et al., 2012]. Bacterial IN were some of the earliest detected biological IN. Maki [1974] cultured suspensions of Pseudomonas syringae (a common plant pathogen) and found that these bacteria could nucleate ice at temperatures as warm as ~-2 °C. The research found that the ice nucleating ability of the cell was located in the cell wall, with later research suggesting that the cells ability to nucleate ice is in proteins localized in the cell membrane and these proteins provide an epitaxial fit to ice [Wolber et al., 1986; Lindow et al., 1989].
Augustin et al., 2013]. However select species contain rare pollen grains that can nucleate at temperatures as warm as -9 °C [Diehl et al., 2002].
In remote marine areas of the planet, plankton may serve as ice nuclei. Two micro-algae, Thalassiosira pseudonana and Nannochloris atomus, have been investigated for their possible ice nucleating ability [Knopf et al., 2010; Alpert et al., 2011a]. Even though these phytoplankton possess differing cell wall structure [Alpert et al., 2011b], they both nucleated ice at ~-30 °C. In contrast, the authors of the study found Emiliania huxleyi demonstrated no ice nucleating ability.
IN from combustion
Carbonaceous combustion aerosol makes up a significant portion of ambient aerosol. For example, >30% of particles sampled in the North American free troposphere were identified as coming from biomass burning [Hudson et al., 2004]. In one study, 21 biomass fuels were combusted and the resulting smoke was fed into a diffusion chamber at -30 °C [Petters et al., 2009]. Less than half these fuels produced sufficient IN concentrations that could be detected by the instrument. Soot from an oxygen-deficient acetylene burner did nucleate ice at temperatures below -24 °C [DeMott, 1990] and soot from kerosene catalyzed ice between -18 and -28 °C [Diehl and Mitra, 1998]. Finally, Gorbunov et al. [2001]
produced hydrophobic and hydrophilic soot and found that both could nucleate ice at -10 and -20 °C. However, the hydrophilic soot was orders of magnitude higher in efficiency.
Determining which combination of the above IN are important in cloud process is difficult. To be atmospherically relevant it is not sufficient to have a warm freezing onset temperature, but that there be enough warm IN from that class to have an impact on the cloud and there has to be a mechanism to carry the sufficiently warm IN to the cloud level. For example, as discussed above and in Chapter 4, pollen has been found to nucleate at warm enough temperatures to impact clouds; however, it is unlikely that there is sufficient pollen produced at the ground to allow for enough pollen to survive transport to cloud altitudes. 1.6 Current Ice Nuclei Instruments
aerosols was either compressed and then rapidly expanded or the air was refrigerated to simulate cloud like conditions. The formation of ice crystals was then observed visually by shining a bright light through a window [aufm Kampe and Weickmann, 1951]. Due to the need for in situ measurements, filters of aerosol were collected during aircraft flights. These filters were then placed in a chamber for processing where the temperature and relative humidity were independently controlled. Ice crystal formation was then observed directly on the filters allowing for the calculation of IN concentration during the flights [Stevenson 1968; Langer and Rodgers, 1975; Gagin, 1975]. Due to ease of collection and the large volumes of air that can be sampled, this method remains popular even though pitfalls such as water vapor competition between ice crystals and surface temperature controls have been documented [Bigg 1990; DeMott et al., 2011].
A more recent development in IN measurement is the use of the continuous-flow diffusion chamber (CFDC) [Rogers et al., 2001]. There are several variations of this instrument including horizontal parallel plate [Hussain and Saunders, 1984] and vertical cylindrical [Rogers, 1988] designs. Inside the chamber, the walls are covered in ice and are temperature controlled so that the super-saturation and temperature in the middle of the chamber is known. A laminar stream of particles is then directed through the chamber with a residence time of < 10 seconds. This time is long enough for many IN to initiate drop
can be prone to artifacts due to the substrate and capping liquids being possible sources of unintended nucleating surfaces.
1.7 Dissertation Objectives and Outline
The objectives for this dissertation were as follows:
(1) Design a new instrument to measure ice nuclei concentrations that has the following characteristics:
a. Cold stage design to investigate immersion mode ice nucleation b. Dynamic range of operation from 0 to -40 °C
c. Cooling rate control spanning at least two orders of magnitude d. Temperature stability for up to four days
e. Measure ice nuclei concentrations down to ~10-8 IN per pL of water
f. Automated software for drop freezing detection to allow for data volume to exceed previous instrument designs by a factor of 100
(2) Use the cold stage instrument to investigate both the experimental and theoretical cooling rate dependence of a wide range of ice nuclei types.
(3) Design a method to sample ambient ice nuclei to be measured with the cold stage instrument allowing for analysis of ambient IN concentrations to below 1 L-1. (4) Investigate the role bioaerosol plays in ice nuclei concentrations and precipitation The following chapters of this dissertation detail how these objectives were achieved.
In Chapter 2, the drop freezing assay instrument is introduced and is used to analyze the ice nucleating properties of pure water and Arizona Test Dust. These measurements established that the instrument can be operated at a wide range of cooling rates and hold the sample temperature stable for several days. Beyond establishing and verifying the instrument and experimental protocols, the paper investigated the time dependence of the nucleation rate in immersion mode heterogeneous nucleation and established a parameterization to describe the observed freezing events using a variant of the multiple-component stochastic model. The next chapter extends this research to additional materials such as the minerals kaolinite and montmorillonite, soot, a bacterial proxy, and rain samples collected from Raleigh, NC.
to collect ambient aerosol. This allowed for the investigation of aerosol that was present during the local pollen season and whether the aerosol contained efficient IN. Chapter 5 continues with ambient aerosol measurements by employing a Wideband Integrated
Bioaerosol Sensor to quantify the fraction of aerosol that fluoresce to ascertain the biological fraction of IN. Combined, the instruments were used to investigate the IN and biological particle concentrations during rain from the passage of a cold front.
The papers contained within this dissertation seek to answer the following research questions:
How can the observed shift in heterogeneous immersion mode freezing temperatures due to cooling rate changes be explained?
How can the shift in freezing temperatures due to cooling rate changes be captured in model parameterizations and still accurately predict other experimental designs?
How does the measured cooling rate/time dependence impact heterogeneous ice nucleation in clouds?
How do macro-molecules from pollen bursting impact ambient IN concentrations?
How can terrestrial ice nuclei move from the surface to the cloud?
1.8References
Alpert, P. A., J. Y. Aller, and D. A. Knopf (2011a), Ice nucleation from aqueous NaCl droplets with and without marine diatoms, Atmospheric Chemistry and Physics, 11(12), 5539–5555, doi:10.5194/acp-11-5539-2011.
Alpert, P. A., J. Y. Aller, and D. A. Knopf (2011b), Initiation of the ice phase by marine biogenic surfaces in supersaturated gas and supercooled aqueous phases, Physical chemistry chemical physics : PCCP, 13(44), 19882–94, doi:10.1039/c1cp21844a. Ansmann, A., M. Tesche, P. Seifert, D. Althausen, R. Engelmann, J. Fruntke, U. Wandinger,
I. Mattis, and D. Müller (2009), Evolution of the ice phase in tropical altocumulus: SAMUM lidar observations over Cape Verde, Journal of Geophysical Research, 114(D17), D17208, doi:10.1029/2008JD011659.
Atkinson, J. D., B. J. Murray, M. T. Woodhouse, T. F. Whale, K. J. Baustian, K. S. Carslaw, S. Dobbie, D. O’Sullivan, and T. L. Malkin (2013), The importance of feldspar for ice nucleation by mineral dust in mixed-phase clouds., Nature, 498(7454), 355–8,
doi:10.1038/nature12278.
aufm Kampe, H. J., and H. K. Weickmann (1951), The effectiveness of natural and artificial aerosols as freezing nuclei, Journal of Meteorology, 8(5), 283–288, doi:10.1175/1520-0469(1951)008<0283:TEONAA>2.0.CO;2.
Baumgardner, D. et al. (2012), In Situ, Airborne Instrumentation: Addressing and Solving Measurement Problems in Ice Clouds, Bulletin of the American Meteorological Society, 93(2), ES29–ES34, doi:10.1175/BAMS-D-11-00123.1.
Bigg, E. K. (1990), Measurement of concentrations of natural ice nuclei, Atmospheric Research, 25(5), 397–408, doi:10.1016/0169-8095(90)90024-7.
Broadley, S. L., B. J. Murray, R. J. Herbert, J. D. Atkinson, S. Dobbie, T. L. Malkin, E. Condliffe, and L. Neve (2012), Immersion mode heterogeneous ice nucleation by an illite rich powder representative of atmospheric mineral dust, Atmospheric Chemistry and Physics, 12(1), 287–307, doi:10.5194/acp-12-287-2012.
Campbell, I. D., K. Mcdonald, M. D. Flannigan, and J. Kringayark (1999), Long-distance transport of pollen into the Arctic, Nature, (399), 29–30.
Connolly, P. J., and P. R. Field (2009), Studies of heterogeneous freezing by three different desert dust samples, Atmos. Chem, 2805–2824.
Cotton, R., and P. R. Field (2002), Ice nucleation characteristics of an isolated wave cloud, Quarterly Journal of the Royal Meteorological Society, 128(585), 2417–2437,
doi:10.1256/qj.01.150.
DeMott, P. J. (1990), An Exploratory Study of Ice Nucleation by Soot Aerosols, Journal of Applied Meteorology, 29(10), 1072–1079,
doi:10.1175/1520-0450(1990)029<1072:AESOIN>2.0.CO;2.
DeMott, P. J. et al. (2011), Resurgence in Ice Nuclei Measurement Research, Bulletin of the American Meteorological Society, 92(12), 1623–1635, doi:10.1175/2011BAMS3119.1. DeMott, P. J., A. J. Prenni, X. Liu, S. M. Kreidenweis, M. D. Petters, C. H. Twohy, M. S.
Richardson, T. Eidhammer, and D. C. Rogers (2010), Predicting global atmospheric ice nuclei distributions and their impacts on climate, Proceedings of the National Academy of Sciences of the United States of America, 107(25), 11217–22,
doi:10.1073/pnas.0910818107.
DeMott, P. J., D. C. Rogers, and S. M. Kreidenweis (1997), The susceptibility of ice formation in upper tropospheric clouds to insoluble aerosol components, Journal of Geophysical Research, 102(D16), 19575, doi:10.1029/97JD01138.
Després, V. R. et al. (2012), Primary biological aerosol particles in the atmosphere: a review, Tellus B, 64, doi:10.3402/tellusb.v64i0.15598.
Diehl, K., S. Matthias-Maser, R. Jaenicke, and S. K. Mitra (2002), The ice nucleating ability of pollen:, Atmospheric Research, 61(2), 125–133, doi:10.1016/S0169-8095(01)00132-6.
Diehl, K., and S. K. Mitra (1998), A laboratory study of the effects of a kerosene-burner exhaust on ice nucleation and the evaporation rate of ice crystals, Atmospheric Environment, 32(18), 3145–3151, doi:10.1016/S1352-2310(97)00467-6.
Durant, A. J., and R. A. Shaw (2005), Evaporation freezing by contact nucleation inside-out, Geophysical Research Letters, 32(20), 2–5, doi:10.1029/2005GL024175.
Ervens, B., and G. Feingold (2012), On the representation of immersion and condensation freezing in cloud models using different nucleation schemes, Atmospheric Chemistry and Physics, 12(13), 5807–5826, doi:10.5194/acp-12-5807-2012.
Field, P. R., A. J. Heymsfield, B. J. Shipway, P. J. DeMott, K. A. Pratt, D. C. Rogers, J. Stith, and K. A. Prather (2012), Ice in Clouds Experiment–Layer Clouds. Part II:
Testing Characteristics of Heterogeneous Ice Formation in Lee Wave Clouds, Journal of the Atmospheric Sciences, 69(3), 1066–1079, doi:10.1175/JAS-D-11-026.1.
Fornea, A. P., S. D. Brooks, J. B. Dooley, and A. Saha (2009), Heterogeneous freezing of ice on atmospheric aerosols containing ash, soot, and soil, Journal of Geophysical
Research, 114(D13), 1–12, doi:10.1029/2009JD011958.
Gagin, A. (1975), The Ice Phase in Winter Continental Cumulus Clouds, Journal of the Atmospheric Sciences, 32(8), 1604–1614,
doi:10.1175/1520-0469(1975)032<1604:TIPIWC>2.0.CO;2.
Goldsmith, P., J. Goster, and C. Hume (1976), The ice phase in clouds, Preprints, International Conference on Cloud Physics, Boulder, CO, American Meterological Society, Boston.
Gorbunov, B., A. Baklanov, N. Kakutkina, H. L. Windsor, and R. Toumi (2001), Ice nucleation on soot particles, Journal of Aerosol Science, 32(2), 199–215, doi:10.1016/S0021-8502(00)00077-X.
Haga, D. I., S. M. Burrows, R. Iannone, M. J. Wheeler, R. H. Mason, J. Chen, E. a. Polishchuk, U. Pöschl, and A. K. Bertram (2014), Ice nucleation and its effect on the atmospheric transport of fungal spores from the classes Agaricomycetes,
Ustilaginomycetes, and Eurotiomycetes, Atmospheric Chemistry and Physics Discussions, 14(4), 5013–5059, doi:10.5194/acpd-14-5013-2014.
Hallett, J., and S. C. Mossop (1974), Production of secondary ice particles during the riming process, Nature, 249(5452), 26–28, doi:10.1038/249026a0.
Hartmann, S., S. Augustin, T. Clauss, H. Wex, T. Šantl-Temkiv, J. Voigtländer, D. Niedermeier, and F. Stratmann (2013), Immersion freezing of ice nucleation active protein complexes, Atmospheric Chemistry and Physics, 13(11), 5751–5766, doi:10.5194/acp-13-5751-2013.
Hudson, P. K., D. M. Murphy, D. J. Cziczo, D. S. Thomson, J. A. de Gouw, C. Warneke, J. Holloway, H.-J. Jost, and G. Hübler (2004), Biomass-burning particle measurements: Characteristic composition and chemical processing, Journal of Geophysical Research, 109(D23), D23S27, doi:10.1029/2003JD004398.
Huffman, J. A. et al. (2013), High concentrations of biological aerosol particles and ice nuclei during and after rain, Atmospheric Chemistry and Physics, 13(13), 6151–6164, doi:10.5194/acp-13-6151-2013.
Hussain, K., and C. Saunders (1984), Ice nucleus measurement with a continuous flow chamber, Quarterly Journal of the Royal Meteorological Society, 110(463), 75–84, doi:10.1002/qj.49711046307.
Iannone, R., D. I. Chernoff, A. Pringle, S. T. Martin, and A. K. Bertram (2011), The ice nucleation ability of one of the most abundant types of fungal spores found in the atmosphere, Atmospheric Chemistry and Physics, 11(3), 1191–1201, doi:10.5194/acp-11-1191-2011.
Kärcher, B., and U. Lohmann (2003), A parameterization of cirrus cloud formation: Heterogeneous freezing, Journal of Geophysical Research, 108(D14), 4402, doi:10.1029/2002JD003220.
Kashchiev, D. (2000), Nucleation, Butterworth-Heinemann, Oxford.
Knopf, D. A., P. A. Alpert, B. Wang, and J. Y. Aller (2010), Stimulation of ice nucleation by marine diatoms, Nature Geoscience, 4(2), 88–90, doi:10.1038/ngeo1037.
Korolev, A. V., E. F. Emery, J. W. Strapp, S. G. Cober, and G. a. Isaac (2013),
Quantification of the Effects of Shattering on Airborne Ice Particle Measurements, Journal of Atmospheric and Oceanic Technology, 30(11), 2527–2553,
doi:10.1175/JTECH-D-13-00115.1.
Langer, G., and J. Rodgers (1975), An Experimental Study of the Detection of Ice Nuclei on Membrane Filters and Other Substrata, Journal of Applied Meteorology, 14(4), 560– 570, doi:10.1175/1520-0450(1975)014<0560:AESOTD>2.0.CO;2.
Langham, E. J., and B. J. Mason (1958), The Heterogeneous and Homogeneous Nucleation of Supercooled Water, Proceedings of the Royal Society A: Mathematical, Physical and Engineering Sciences, 247(1251), 493–504, doi:10.1098/rspa.1958.0207.
syringae and Escherichia coli, Molecular Plant-Microbe Interactions, 2(5), 262, doi:10.1094/MPMI-2-262.
Lohmann, U. (2002), A glaciation indirect aerosol effect caused by soot aerosols, Geophysical Research Letters, 29(4), 1052, doi:10.1029/2001GL014357.
Lüönd, F., O. Stetzer, A. Welti, and U. Lohmann (2010), Experimental study on the ice nucleation ability of size-selected kaolinite particles in the immersion mode, Journal of Geophysical Research, 115(D14), D14201, doi:10.1029/2009JD012959.
Maki, L. R., E. L. Galyan, M. M. Chang-Chien, and D. R. Caldwell (1974), Ice nucleation induced by pseudomonas syringae., Applied microbiology, 28(3), 456–9.
Marcolli, C., S. Gedamke, T. Peter, and B. Zobrist (2007), Efficiency of immersion mode ice nucleation on surrogates of mineral dust, Atmospheric Chemistry and Physics, 7(19), 5081–5091, doi:10.5194/acp-7-5081-2007.
Mason, B. J., and J. Maybank (1960), The fragmentation and electrification of freezing water drops, Quarterly Journal of the Royal Meteorological Society, 86(368), 176–185, doi:10.1002/qj.49708636806.
Möhler, O. et al. (2006), Efficiency of the deposition mode ice nucleation on mineral dust particles, Atmospheric Chemistry and Physics, 6(10), 3007–3021, doi:10.5194/acp-6-3007-2006.
Möhler, O., P. J. Demott, G. Vali, and J. Levine (2007), Microbiology and atmospheric processes: the role of biological particles in cloud physics, Biogeosciences, 4(6), 1059– 1071, doi:10.5194/bg-4-1059-2007.
Morris, C. E., D. C. Sands, C. Glaux, J. Samsatly, S. Asaad, a. R. Moukahel, F. L. T. Gonçalves, and E. K. Bigg (2013), Urediospores of rust fungi are ice nucleation active at > −10 °C and harbor ice nucleation active bacteria, Atmospheric Chemistry and Physics, 13(8), 4223–4233, doi:10.5194/acp-13-4223-2013.
Murray, B. J., S. L. Broadley, T. W. Wilson, J. D. Atkinson, and R. H. Wills (2011), Heterogeneous freezing of water droplets containing kaolinite particles, Atmospheric Chemistry and Physics, 11(9), 4191–4207, doi:10.5194/acp-11-4191-2011.
Niedermeier, D., R. A. Shaw, S. Hartmann, H. Wex, T. Clauss, J. Voigtländer, and F. Stratmann (2011), Heterogeneous ice nucleation: exploring the transition from stochastic to singular freezing behavior, Atmospheric Chemistry and Physics, 11(16), 8767–8775, doi:10.5194/acp-11-8767-2011.
Niemand, M. et al. (2012), A Particle-Surface-Area-Based Parameterization of Immersion Freezing on Desert Dust Particles, Journal of the Atmospheric Sciences, 69(10), 3077– 3092, doi:10.1175/JAS-D-11-0249.1.
Petters, M. D. et al. (2009), Ice nuclei emissions from biomass burning, Journal of Geophysical Research, 114(D7), D07209, doi:10.1029/2008JD011532.
Pratt, K. A., P. J. DeMott, J. R. French, Z. Wang, D. L. Westphal, A. J. Heymsfield, C. H. Twohy, A. J. Prenni, and K. A. Prather (2009), In situ detection of biological particles in cloud ice-crystals, Nature Geoscience, 2(6), 398–401, doi:10.1038/ngeo521.
Prospero, J. M., P. Ginoux, O. Torres, S. E. Nicholson, and T. E. Gill (2002), Environmental characterization of global sources of atmospheric soil dust identified with the NIMBUS 7 Total Ozone Mapping Spectrometer (TOMS) absorbing aerosol product, Reviews of Geophysics, 40(1), 1002, doi:10.1029/2000RG000095.
Pruppacher, H. R., and J. D. Klett (1996), Microphysics of Clouds and Precipitation, 2nd ed., Springer, New York.
Pummer, B. G., H. Bauer, J. Bernardi, S. Bleicher, and H. Grothe (2012), Suspendable macromolecules are responsible for ice nucleation activity of birch and conifer pollen, Atmospheric Chemistry and Physics, 12(5), 2541–2550, doi:10.5194/acp-12-2541-2012. Rangno, A. L., and P. V. Hobbs (1991), Ice particle concentrations and precipitation
development in small polar maritime cumuliform clouds, Quarterly Journal of the Royal Meteorological Society, 117(497), 207–241, doi:10.1002/qj.49711749710.
Rogers, D. C. (1988), Development of a continuous flow thermal gradient diffusion chamber for ice nucleation studies, Atmospheric Research, 22(2), 149–181, doi:10.1016/0169-8095(88)90005-1.
Rogers, D. C., P. J. DeMott, S. M. Kreidenweis, and Y. Chen (1998), Measurements of ice nucleating aerosols during SUCCESS, Geophysical Research Letters, 25(9), 1383– 1386, doi:10.1029/97GL03478.
Rosinski, J., and G. Morgan (1991), Cloud condensation nuclei as a source of ice-forming nuclei in clouds, Journal of Aerosol Science, 22(2), 123–133, doi:10.1016/0021-8502(91)90022-A.
Shaw, R. A., A. J. Durant, and Y. Mi (2005), Heterogeneous surface crystallization observed in undercooled water, The Journal of Physical Chemistry B, 109(20), 9865–8,
doi:10.1021/jp0506336.
Stevenson, C. M. (1968), An improved Millipore filter technique for measuring the concentrations of freezing nuclei in the atmosphere, Quarterly Journal of the Royal Meteorological Society, 94(399), 35–43, doi:10.1002/qj.49709439905.
Suphioglu, C., M. . Singh, P. Taylor, R. . Knox, R. Bellomo, P. Holmes, and R. Puy (1992), Mechanism of grass-pollen-induced asthma, The Lancet, 339(8793), 569–572,
doi:10.1016/0140-6736(92)90864-Y.
Turnbull, D., and J. C. Fisher (1949), Rate of Nucleation in Condensed Systems, The Journal of Chemical Physics, 17(1), 71, doi:10.1063/1.1747055.
Vali, G. (1985), Nucleation terminology, Journal of Aerosol Science, 16(6), 575–576, doi:10.1016/0021-8502(85)90009-6.
Vali, G. (1994), Freezing rate due to heterogeneous nucleation, Journal of Atmospheric Sciences, 51(13), 1843–1856.
Vali, G. (2008), Repeatability and randomness in heterogeneous freezing nucleation,
Atmospheric Chemistry and Physics, 8(16), 5017–5031, doi:10.5194/acp-8-5017-2008. Vardiman, L. (1978), The Generation of Secondary Ice Particles in Clouds by Crystal–
Crystal Collision, Journal of the Atmospheric Sciences, 35(11), 2168–2180, doi:10.1175/1520-0469(1978)035<2168:TGOSIP>2.0.CO;2.
Wegener, A. (1911), Thermodynamik der Atmosphäre, J.A. Barth, Leipzig.
Westbrook, C. D., and A. J. Illingworth (2011), Evidence that ice forms primarily in supercooled liquid clouds at temperatures > −27°C, Geophysical Research Letters, 38(14), L14808, doi:10.1029/2011GL048021.
Williams, C. G. (2010), Long-distance pine pollen still germinates after meso-scale dispersal., American Journal of Botany, 97(5), 846–55, doi:10.3732/ajb.0900255. Wolber, P. K., C. A. Deininger, M. W. Southworth, J. Vandekerckhove, M. van Montagu,
protein., Proceedings of the National Academy of Sciences of the United States of America, 83(19), 7256–60.
2. ROLE OF TIME IN HETEROGENEOUS ICE NUCLEATION
This chapter has been published in the Journal of Geophysical Research:
Atmospheres.
Full citation:
Wright, T. P. and M. D. Petters (2013), The role of time in heterogeneous freezing
nucleation, Journal of Geophysical Research: Atmospheres, 118(9), 3731–3743,
doi:10.1002/jgrd.50365, 2013.
Abstract
A small fraction of particles in the atmosphere can catalyze ice formation in cloud
water drops through heterogeneous freezing nucleation at temperatures warmer than the
homogeneous freezing temperature of approximately -38 degree C. The rate for
heterogeneous freezing nucleation is dependent on several factors including the type and
surface area of dust that is immersed inside the drop. Although nucleation is an inherently
stochastic process resulting from size fluctuations of the incipient ice germ, there is a
growing body of literature that suggests that quasi-deterministic models of ice nucleation can
describe laboratory experiments. Here we present new experiments and simulations that aim
to better constrain theoretical models fitted to laboratory data. We collected ice nucleation
data for Arizona Test Dust aerosol immersed in water using a droplet freezing assay setup
that allows for the cooling rates to be changed between 10 and 0.01 K per minute. Discrete
event simulations based on a variant of the multiple-component stochastic model of
heterogeneous freezing nucleation were used to simulate different experimental procedures.
The nucleation properties of the dust are specified by four material-dependent parameters
that accurately describe the time dependence of the freezing process. We anticipate that the
combination of discrete event simulations and a spectrum of experimental procedures
described here can be used to design more meaningful laboratory experiments probing ice
2.1 Introduction
Ice initiation in mixed-phase tropospheric clouds proceeds via heterogeneous freezing
nucleation of water on aerosol surfaces. Particles that provide such surfaces are a subset of
the atmospheric aerosol and are termed ice nuclei (IN). Primary ice in clouds can form on ice
nuclei via several distinct pathways: 1) deposition of supersaturated water vapor with respect
to ice on dry aerosol surfaces (deposition mode), 2) activation of an incipient ice germs on
aerosol surfaces that are immersed in supercooled cloud droplets (immersion and
condensation mode), 3) movement of an ice nucleus across the water/air interface (contact
mode), and 4) any of the previous mechanisms aided by the presence of cooling (evaporation
freezing) or electric charge (electrofreezing) [Baumgardner et al., 2012].
An important open question in the field of cloud physics is the evolution of ice crystal
concentrations with time. For example, the properties of persistent mixed-phase Arctic
stratus clouds can only be explained if a continuous slow ice nucleation process is assumed,
e.g. entrainment of IN from the free troposphere followed by contact nucleation [Fridlind et
al., 2012]. In general, the time evolution of ice crystal concentrations in clouds can either be
attributed to secondary processes such as rime splintering [Hallet and Mossop, 1974] or to
the time dependence of the primary ice formation via freezing nucleation. Classical
nucleation theory (CNT) of immersion freezing [Pruppacher and Klett, 1996] assumes that
the ice phase forms on a germ that is located on a surface and that the germ continually
fluctuates in size due to the fusion and melting of individual water molecules. Once the germ
reaches a critical size it becomes activated and grows rapidly at the expense of the
surrounding liquid. This stochastic process gives rise to a nucleation rate which is expressed
as number of nucleation events per unit surface area and time. Classical nucleation theory
therefore predicts that a sufficiently dispersed homogenous substrate, such as an aerosol of a
single type, will result in an increasing number of ice crystals if the sample is given time to
reside at a certain thermodynamic condition.
One hypothesis is that ice nuclei surfaces are heterogeneous and that nucleation
proceeds on preferred active sites [Fletcher, 1969]. These sites aid the formation of the lower
in substrate [Vonnegut, 1947], pores, cracks, or ledges etched on the surface [Knight, 1979;
Sear, 2011], or chemically primed insoluble carbonaceous surfaces [Gorbunov et al., 2001].
Most studies parameterize the free energy of germ formation on these sites either in terms of
contact angle [Fletcher, 1969; Marcolli et al., 2007] or characteristic temperature [Vali,
2008; Broadley et al., 2012]. The distribution of the catalytic strength of these sites is
generally assumed to be Gaussian [Marcolli et al., 2007] or exponential [Niemand et al.;
2012, Hoose and Möhler, 2012].
The fundamental challenge for ice nucleation studies is to separate the
time-dependence of the nucleation process from the properties of the active site distribution [Vali,
1994, 2008]. Although it is possible to derive nucleation rates from various experimental data
[e.g., Archuleta et al., 2005; Eastwood et al., 2008], it remains unclear whether such derived
rates can accurately predict the time dependence of the freezing process. This ambiguity
arises because the residence time in most freezing apparatuses is short and difficult to
systematically vary during experiments. For example, current continuous flow diffusion
chambers [Rogers et al., 2001; Stetzer et al., 2008; Kanji and Abbatt, 2009] and similar
instruments such as LACIS [Hartmann et al., 2011] are limited to residence times on the
order of a few seconds and these times are not easily extended beyond a factor of ten [Welti
et al., 2012]. Cold-stage freezing assays [Durant and Shaw, 2005; Cantrell and Robinson,
2006; Vali, 2008; Fornea et al., 20092009; Murray et al., 20111; Alpert et al., 2011; Wheeler
and Bertram, 2012; Broadley et al., 2012; Pummer et al., 2012] and differential scanning
calorimetry apparatuses [Marcolli et al., 2007] are better suited for exploring the time
dependence since the cooling rate can be easily manipulated. These setups, however, may be
more prone to artifacts because the aerosol/droplet is situated on a substrate and/or is
immersed in oil, although clean work minimizes substrate effects [Murray et al., 2010;
Broadley et al., 2012]. Further, control over the aerosol surface area inside the droplet is more difficult especially when operating with submicron particles that are too small to be
detected with standard optical microscopy. Thus interpretation of the time-dependence from
cold-stage freezing assays can be hindered by the ability to uniquely describe the particle size