78: 3–2 (2016) 133–137 | www.jurnalteknologi.utm.my | eISSN 2180–3722 |
Jurnal
Teknologi
Full Paper
N
UMERICAL
S
TUDIES OF
I
ON
B
EAM IN
NX2
P
LASMA
F
OCUS FOR
D
IFFERENT
A
PPLIED
V
OLTAGE
Nina Diana Nawi, Shu Teik Ong, Jalil Ali
*, Kashif Chaudhary, Mahdi
Bahadoran, Suzairi Daud
Laser Centre, Ibnu Sina Institute for Scientific and Industrial
Research (ISI-SIR), Universiti Teknologi Malaysia (UTM), 81310 Johor
Bahru, Malaysia
Article history
Received 10 February 2015 Received in revised form
10 November 2015 Accepted 12 November 2015
*Corresponding author
[email protected]
Graphical abstract
Abstract
Plasma focus device gives simultaneous interaction between magnetic and electric field which results in exhibiting multi-radiation properties. Ion beam radiates from the system is significant for experimenting target material of interest in plasma focus research. Lee code model is used to simulate the numerical experiments on NX2-plasma focus device system using different applied voltage in the range 10 to 14 kV. The system is operating in Neon filled at an optimum pressure depending on the applied voltage used in the experiment. Results obtained are analysed and fitted with the experimental results for system validation. Good fitting on the numerical with the experimental results is obtained by incorporating mass shedding effects and current shedding factor. The range of current density obtained is in the range 1.6x10⁸ to 7.3x10⁹ Am-2 whilst the maximum ion beam energy is estimated to be 156 J.
Keywords: Plasma focus; applied voltage; focusing phase
Abstrak
Peranti tumpuan plasma, memberikan interaksi serentak antara medan magnet dan elektrik yang menyebabkan ianya memperlihatkan ciri-ciri pelbagai radiasi. Pancaran Ion yand dipancarkan dari sistem adalah penting untuk eksperimen bahan sasaran dalam penyelidikan tumpuan plasma. Kod Lee digunakan untuk simuslasi ujikaji berangka pada NX2 sistem peranti tumpuan plasma dengan menggunakan voltan gunaan yang berbeza dalam julat 10 hingga 14 kV. Sistem yang beroperasi menggunakan Neon ini diisi pada tekanan optimum bergantung kepada voltan gunaan yang digunakan dalam eksperimen. Keputusan yang diperolehi dianalisis dan dimuatkan kepada keputusan eksperimen untuk pengesahan sistem. Berangka yang sesuai dimuatkan dengan keputusan ujikaji dapat diperolehi dengan menggabungkan kesan penyapu jisim dan faktor penyapu arus. Julat ketumpatan arus yang diperolehi adalah dalam julat 1.6x10⁸ sehingga 7.3x10⁹ Am-2 manakala maksimum tenaga pancaran ion dianggarkan 156 J.
Kata kunci: Tumpuan plasma; voltan gunaan; fasa tumpuan
© 2016 Penerbit UTM Press. All rights reserved
0.0E+00 1.0E+09 2.0E+09 3.0E+09 4.0E+09 5.0E+09 6.0E+09 7.0E+09 8.0E+09
80 90 100 110 120 130 140 150 160 170
0.000 2.000 4.000 6.000
C
u
rr
e
n
t
d
e
n
si
ty
, A
m
-2
En
e
rg
y
b
e
am
, J
Pressure, torr Energy Beam Current density
1.0 INTRODUCTION
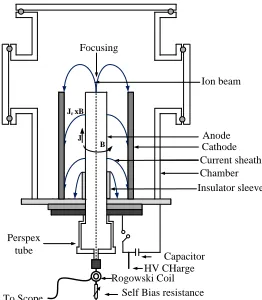
Plasma focus [1] is a high power pulse discharge device consist of capacitor bank, charger, switches, master trigger and discharge-vacuum chamber
which is filled with working gas as shown in Figure 1.
Fast spark gap switch transfers the electrical energy stored in the capacitor bank to the electrodes. The current discharges along the insulator surface at the end of electrode assembly. The electrical discharge [2] cause by the high voltage and high current pulse applies to the system commences the Lorentz force.
Lorentz force, Jr x B, accelerates the conducting
plasma sheath upward in the direction of the z-axis until it reaches to the anode tip. Consequently, plasma column magnetically compresses to a dense plasma column [3] and produce various radiation, such as intense X-rays, relative electrons and energetic ions .
Figure 1 Mather type Plasma Focus device of Z–pinches dynamic.
To facilitate the study on Mather type Plasma Focus, Lee has develops Radiative Dense Plasma Focus, RADPF code also known as Lee code [4, 5]. This code replicates the plasma focus machine based on the snow plough and slug model. The thermodynamics of plasma focus for gases such as hydrogen; deuterium, neon, and etc. are incorporated in the RADPF code. This code exhibits the actual plasma focus machine by inputting specific variable and parameter [6]. Based on RADPF code, the dynamics in plasma focus is divided into two major phases-the axial phase and the radial phase as shown in Figure2.
Figure2 Plasma Focus Operation
The axial phase mechanism starts when the current
sheath is accelerated by the Lorentz force Jrx B and
continue to travel in the track towards the open end of the inner electrodes. The radial phase begins at the end of the axial in which the current sheath is driven radially inwards [7]. This phase contains the dynamics of the plasma, current sheath and the details profiles of the output i.e. ion beam. The competency of dense plasma focus machine in producing high energy ions is supported by Akel [8]. Consistency emissions of ion beam from the plasma focus system make it as the reliable source for material processing field. These ions are very high in temperature and have abundant source of information on fusion reaction yields, plasma ion temperatures, as well as spatial distribution of fusion reaction sources [9]. The high energy ions emitted also will provides essential data on plasma parameters to comprehend ions acceleration mechanism[10]. Akel [8] affirmed that the characterization of ions is very important to understand the mechanism of the production of high-energy ions. Henr´ıquez [11] also highlighted the importance to study the fundamental physics on the ion beam energy, composition and its distribution to ensure immense results in the acceleration and production of ions. The studies on ion beams produce by the plasma focus at different applied voltage are needed to understand the mechanism of the high-energy ions production by investigate the current densities and ion beam energy correlations with the pressures. The knowledge obtained in the generation of ion beam at different applied voltage effect will contribute towards understanding the acceleration process of charged particle and to enrich the investigation of ion beam emission in the material processing application.
1.2 Voltage And Pressure Effects In Plasma Focus
Device
A.Roomi [3] conducted studies on the effects of charging voltage and filling gas pressure towards the behaviour of emitted X-rays by PF device using nitrogen gas. He observed that the voltage and pressure are the effective parameters in X-ray emission from PF; where the increase in voltage increases the emission of X-rays. This is achieved at optimum Jr xB
Focusing
J B
Chamber Current sheath Ion beam
Anode Cathode
Insulator sleeve
Capacitor HV CHarge Rogowski Coil
Self Bias resistance To Scope
Perspex tube
Jr xB
Insulator
Axial Acceleration
Phase Radial Phase
condition for the optimum pressures attained during the focusing dynamics of the X-ray emission. Where the optimum pressure for the applied voltage 10, 11, 12, 13 kV are 3.5, 2.5, 4 and 3 Torr respectively. A.Roomi [12] later confirmed that the motion of plasma sheath is essentially contributed by the applied voltage and current discharge. He certifies on the immense information of the plasma focus device dynamics and performance can be extracted from the discharge current and the tube voltage signal. A.Roomi [12] also observed that the applied voltage in the range of 10– 13 kV with operating pressures ranging between 1.5 and 4.5 Torr gives an increment around 100–150 ns in the focusing time with every increase of 0.5 Torr. The addition of 1 kV in the applied voltage results in decrement of 50–75 ns in the focusing time. Akel [8] in his studies described that the induced voltage of the pre-pinch radial phase affects the acceleration of the ions. The induced voltage decreases with higher pressures while the ion energy of plasma focus follows the same trend.
2.0 THEORY
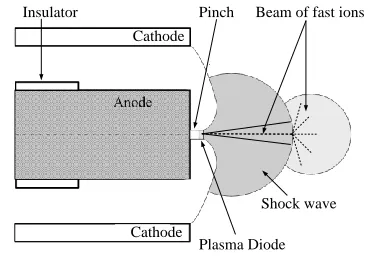
Gribkov [13] described ion beam–plasma interaction where the ions of the main part of the beam leaving the pinch in the direction of the Z-axis which has a conical-tubular structure. Pimenov et.al [14] illustrated the schematic of ion beam phenomenon for further research as shown in Figure 3.
Figure3 Schematic of the plasma dynamics in plasma focus device
Extensive studies by Lee [15, 16] on the beam target mechanism and the mechanism proposed by Gribkov and Pimenov results in the findings of number of ion
beam, 𝑛𝑏 and flux 𝐽𝑏 as given in equation 1 and 2.
𝑛𝑏=(𝜋𝑟𝑁𝑏 𝑝2𝑧𝑝)= (
𝜇 [2𝜋2𝑚𝑝])(
𝑓𝑒 𝑀) {
ln[𝑏 𝑟𝑝] 𝑟𝑝2 } (
𝐼𝑝𝑖𝑛𝑐ℎ2 𝑣𝑏2 ) (1)
𝐽𝑏= 2.75 × 10¹⁵(𝑀 𝑍𝑓𝑒 𝑒𝑓𝑓)
1 2{
ln[𝑏 𝑟𝑝] 𝑟𝑝2 } (
𝐼𝑝𝑖𝑛𝑐ℎ2
𝑈12 ) (2)
Flux, 𝐽𝑏(ions m-2s-1) is calculated based on the ion number per unit cross-section at the plasma exit. The
derivation principle of flux, 𝐽𝑏leads to the
consequential properties of the ion beam. Bhuyan mentioned the studies of energy flux of ion beam in plasma focus and its characterization endeavor to possess broad understanding on fundamental physics as well as in the generation ion beam energyEnergy beam and current densities properties are given in equations 3 and 4.
Current density (Am−2) = 𝐽
𝑏× 𝑒 ∙ 𝑍𝑒𝑓𝑓 (𝑖𝑜𝑛 𝑐ℎ𝑎𝑟𝑔𝑒) (3)
Energy in Beam (J) = 𝑛𝑏× 𝑍𝑒𝑓𝑓∙ 𝑈 (4)
The equations are incorporated in the RADPF code for further studies.
3.0 METHODOLOGY
The optimum working condition in plasma focus facility for neon gas is needed to obtain high energy beam and current densities. This can be achieved by conducting the RADPF code using Microsoft Excel Visual Basic. To start the numerical experiments, discharge current profile of the actual NX2 machine is taken with a Rogowski coil and fitted to the RADPF according to the NX2 machine configuration as
shown in Table 1.
Table 1 Plasma focus machine configuration
Machine Parameter Tube Parameters Static inductance
Lo 10 nH Cathode radius cm 4.1 Capacitance, Co 28μF anode radius, a cm 1.9
stray resistance, ro 2.3 mΩ anode length, zo 5 cm
In present work, a range of applied voltages 10, 11, 12, 13 and 14 kV are used with operating pressures 1.0 until 5.0 Torr using Neon as the working gas. In order to obtain an accurate and valid data, the model parameter of mass shedding effects and current
shedding factor fm, fc, fmr,fcr are fitted one by one, or
in combination with the actual machine. Once the computed current profile is fitted with the measured current profile, the system is run to observe the effect of pressure towards the energy beam and current densities.
4.0
RESULTS AND DISCUSSIONS
The correlation of the current densities and ion beam energy with pressures are presented with different values of applied voltage. Significant differences and similar pattern on the applied voltage are investigated based on numerical simulation using the RADPF Lee’s Model. Figure 4 presents the increasing of the energy beam and current densities with the increase in gas pressure at 10 kV applied voltage of
Insulator Pinch Beam of fast ions
Plasma Diode Shock wave
the 1.4 kJ stored energy. The energy beam is
increased from 50 J with current density 1.6x10⁹ Am-2
at 1 Torr; the highest energy 65 J at 2 Torr, whilst highest
current density 3.8x10⁹ Am-2 at 2.5 Torr are determined.
However, after reaching the peak, each of the value
decreases to 21 J and 1.6x10⁸ Am-2 at 5.0 Torr.
Figure 4 The correlation of current densities and energy beam with pressure for 10 kV applied voltage
In Figure 5 the computed ion beam energy and current densities for 1.7 kJ stored energy of NX2 plasma focus at 11 kV applied voltage is presented. The energy beam is increased from 62 J with current
density 1.7x10⁸ Am-2 at 1 Torr to the maximum value of
83J and 4.5 x10⁹ Am-2 at 2.5 Torr , then it decreases to
the minimum value of 50 J 7.6x10⁸ Am-2 at 5.00 Torr
Figure 5 The correlation of current densities and energy beam with pressure for 11 kV applied voltage
In Figure 6, the ion beam energy and current densities for 2.0 kJ stored energy of NX2 plasma focus
is increased from 73 J and 1.9x10⁹ Am-2 at 1.0 Torr and
reached to maximum value of 107 J and 5.7x10⁹ Am-2
at 3.0 Torr. Then, the energy beam decreases to 80 J and 1.8x10⁹ Am-2 at 5.0 Torr.
Figure 6 The correlation of current densities and energy beam with pressure for 12 kV applied voltage
Figure 7 presents the ion beam energy and current densities for 2.4 kJ stored energy of NX2 13 kV plasma focus with the same pattern of graph. The ion beam energy and current densities are increased from 85 J
and 2.1x10⁹ Am-2 at 1.0 Torr to maximum value of 129 J
and 6.5x10⁹ Am-2 at 3.5 Torr before, the energy beam
decreases to 111 J and 3.1x10⁹ Am-2 at 5.0 Torr.
Figure 7 The correlation of current densities and energy beam with pressure for 13 kV applied voltage
In Figure 8, the computed ion beam energy and current densities for 2.7 kJ stored energy of NX2
plasma focus is increased to 98 J and 2.2x10⁹ Am-2 at
1.0 Torr and reached maximum value of 156 J and
7.3x10⁹ Am-2 at 4.0 Torr. Later, the energy beam
decreases to 145 J and 4.8x10⁹ Am-2 at 5.0 Torr.
Figure 8 The correlation of current densities and energy beam with pressure for 14 kV applied voltage
For each applied voltage; the energy beam and current densities are higher at high pressure than at the low pressure. The optimum pressure for 10 to 14 kV applied voltage is in the addition of 0.5 Torr; when the
0.0E+00 1.0E+09 2.0E+09 3.0E+09 4.0E+09 10 20 30 40 50 60 70
0.000 2.000 4.000 6.000
C u rr e n t d e n si ty , A m -2 En e rg y b e am , J Pressure, Torr Energy beam Current density 0.0E+00 1.0E+09 2.0E+09 3.0E+09 4.0E+09 5.0E+09 6.0E+09 7.0E+09 50 60 70 80 90 100 110 120
0.000 2.000 4.000 6.000
C u rr e n t d e n si ty , A m -2 En e rg y b e am , J Pressure, Torr Energy beam Current density 0.0E+00 1.0E+09 2.0E+09 3.0E+09 4.0E+09 5.0E+09 6.0E+09 40 50 60 70 80 90
0.000 2.000 4.000 6.000
C u rr e n t d e n si ty , A m -2 En e rg y b e am , J Pressure, Torr Energy beam Current Density 0.0E+00 1.0E+09 2.0E+09 3.0E+09 4.0E+09 5.0E+09 6.0E+09 7.0E+09 70 80 90 100 110 120 130 140
0.000 2.000 4.000 6.000
C u rr e n t d e n si ty , A m -2 En e rg y Be am , J Pressure, Torr Energy beam Current Density 0.0E+00 1.0E+09 2.0E+09 3.0E+09 4.0E+09 5.0E+09 6.0E+09 7.0E+09 8.0E+09 80 90 100 110 120 130 140 150 160 170
0.000 2.000 4.000 6.000
system is increased by one voltage. It is also important to note that the same pattern of the computed ion beams energies and current densities at 10, 11, 12, 13 and 14 kV applied voltage give a broad range of energy beam and current densities. The broad range of energy from 50 J to 156 J facilitates selection of the interest material for plasma focus research. In anticipation, it executes optimum results in the actual experiment without causing any damage to the target material.
The physical phenomenon behind the deviation of beam energy and current densities with pressure may be explained as follows. At higher voltages, more gas is ionized thus; generate more ions and electrons with higher energies which accelerate toward the cathode and the anode. Similarly, higher energy beam and current densities are obtained at optimum pressure due to the increase in density of the pinch radiating plasma. The applied pressures are predominantly imposed by the molecules of the neon working gas where; the density number of the molecules effects the diffusion and the transfer of energy. At lower pressure, the electrons move slowly and ions are deliberately accelerated by the field. At higher pressure, higher number of ions collides and as the pressure increases surpass the optimum value, the current sheath during the rundown phase becomes non-uniform
5.0 CONCLUSION
The variation of ion beam energy and current densities are plotted with pressure for applied voltages of 10, 11, 12, 13 and 14 kV. The maximum ion beam energies and current densities are achieved from 14 kV applied voltage with pressure 4.0 Torr, whilst the minimum beam energies and current densities obtained are from 10 kV applied voltage at 5.0 Torr. The maximum and minimum energy and current densities are 156 J, 7.3 x10⁹ Am-2 and 21 J, 7.3 x10⁹ Am-2 respectively. It can
be seen, for all applied voltages, the general pattern of energy beam and current densities are similar. With the increment of pressure, the intensity is increased to a maximum value and then decreased. Considering the optimum pressure obtained from 10 to 14 kV, certainly NX2 plasma focus has distinct optimum conditions for different applied voltage. The optimum pressure are strongly correlated with the applied voltage to stimulate current densities and energy beam, thus, it is evident that applied voltage and operating pressure are the effective parameters.
Acknowledgement
We would like to thank the Laser Centre, Universiti Teknologi Malaysia (UTM) and Mybrain15 for providing
research facilities. This research work has been supported by Grant FRGS 4F519 and Ministry of Higher Education Malaysia.
References
[1] Lee, S., Saw, S. H., Rawat, R S., Lee, P., Verma, R.,
Talebitaher, A., Hassan, S.M., and Abdou, A.E. 2011. Measurement and Processing of Fast Pulsed Discharge
Current in Plasma Focus Machines. Journal of Fusion
Energy. 31(2): 198-204.
[2] Saw, S. H., Akel, M., Ong, S. T., Mohamad, S. N., Ismail, F. D.,
Nawi, N.D., Ali. J. and Lee, S.2011. Magnetic Probe
Measurements in INTI Plasma Focus to Determine
Dependence of Axial Speed with Pressure in Neon. Journal
of Fusion Energy. 31(5): 411-417.
[3] Roomi, A., Saion, E,. Habibi, M,. Amrollahi, R,. and
Baghdadi, R. 2011. The Effect of Applied Voltage and Operating Pressure on Emitted X-Ray from Nitrogen (N2)
Gas in APF Plasma Focus Device. Journal of Fusion Energy.
30(5): 413-420.
[4] Saw, S. H. and Lee, S. 2011.The Plasma Focus- Trending into
the Future. International Journal of Energy Research.
36(15): 1366–1374.
[5] Lee, S. The Plasma Focus - Enhancing Knowledge and
Application Potentials. Proceedings of IPFS Conference
2012. Bangkok. 29 March - 1 April 2012.
[6] Ong, ST., Chawdary, K., Ali, J and Lee, S. 2014. Numerical
Experiments on Neutron Yield and Soft X-Ray Study of A
∼100 kJ Plasma Focus Using the Current Profile Fitting
Technique.Plasma Physics Control Fusion 56: 075001.
[7] Saw, S.H. and Lee, S. 2011. Scaling the Plasma Focus for
Fusion Energy Considerations. International Journal of
Energy Research. 35: 81–88.
[8] Akel, M., Saw, S. H. and Lee, S. 2014.Properties of Ion Beams
Generated by Nitrogen Plasma Focus. Journal of Fusion
Energy. 3(3): 189-197.
[9] El-Aragi, G. 2010. Ion Beam Emission within a Low Energy
Focus Plasma (0.1 kJ) Operating with Hydrogen.A Journal
of Physical Sciences. 65(a): 606- 612
[10] Zakaullah, M., Omar,A., Murtaza, G. and Begz, M. 1996.
Effects of anode shape on plasma focus operation with
argon. Plasma Sources Science and Technology 5: 544-552.
[11] A.Henr´ıquez, Bhuyan, H. Investigation of the ion beam
emission from a pulsed power plasma device. 15th
International Congress on Plasma Physics & 13th Latin American Workshop on Plasma Physics. 2014. Journal of Physics: Conference Series. 511: 012073
[12] A.Roomi, M. H. 2012.The Effect of Working Gas Admixture,
Applied Voltage and Pressure on Focusing Time Parameter
in the APF Plasma Focus Device.Fusion Energy. (31):
227-233.
[13] Gribkov, V. A., Banaszak, A., B Bienkowska, B. and
Dubrovsky, A.V. 2007.Plasma Dynamics in the PF-1000 Device Under Full-Scale Energy Storage: II. Fast Electron and Ion Characteristics Versus Neutron Emission
Parameters and Gun Optimization Perspectives.Journal of
Physics D:Applied Physics. 40: 3592-3607.
[14] Pimenov, V. N., Demina, E. V.,and Gribkov, V. A. Damage
and modification of materials produced by pulsed ion and
plasma streams in Dense Plasma Focus device. 3rd
Research Coordination Meeting on Dense Magnetized Plasmas, Beijing, China.9-13 April 2007. 111−121.
[15] Saw, S. H. and Lee, S. 2013. Plasma Focus Ion Beam Fluence
Aand Flux-For Various Gases.Physics of Plasma. 20: 062702.
[16] Saw, S .H. and Lee, S. 2012. Plasma Focus Ion Beam Fluence
and Flux—Scaling With Stored Energy.Physics of Plasma. 19: