Issues and Ideas in Education Vol - 4, No - 2 September 2016
pp. 99–109 DOI: 10.15415/iie.2016.42008
Dynamics of Low Transition Rate from Primary
to Upper Primary in Bihar
CHANDRA B P SINGH1,*, PREETAM KUMAR2
1Professor, University Department of Psychology, Tilka Manji Bhagalpur University,
Bihar, India
2Research Scholar, University Department of Psychology, Tilka Manji Bhagalpur
University, Bihar, India
Email: [email protected]
Received: July 21, 2016| Revised: August 05, 2016| Accepted: August 24, 2016
Published online: September 05, 2016
The Author(s) 2016. This article is published with open access at www.chitkara.edu.in/publications
Abstract The Unified-District Information System of Education report of Bihar (U-DISE, 2014-15) revealed that about 17.45 per cent children of class V could not transit to class VI in elementary schools. It seems that the goal of universal elementary education may not be realised in the near future if transition rates are not further significantly enhanced. The study was designed to explore contextual reasons of low transition rate from primary to upper primary schools in Bihar with the help of a set of tools. The study was conducted on the government schools (135) randomly selected from three districts (9 blocks and 27 CRCs). 270 teachers, 174 VSS members, 98 Parents, 57 Non-transited children, 27 CRCCs and 9 BRCCs participated in the study. Altogether 1293 cases of the left study category and 411 cases of the left school children were recorded across district. The emerging trend pointed out that domestic work (30 per cent) and wage earning (25 per cent) were prominent reasons across district. Early marriage (11 per cent) and geographical barrier (10 per cent) were other reasons that could not be underestimated. About 47 per cent teachers admitted that schools had no child-friendly set-up leading to low transition in class VI. 43 per cent teachers admitted the fact that their schools were not conducive to transiting all children to class VI. The study discussed the role of VSS members, parents and cluster-resource centre coordinators (CRCCs) in low transition rate and also suggested some measures of improving transition rate.
BP Singh, C
kumar, P 1.
INTRODUCTION
The study was designed to investigate context-specific reasons of low transition rate from primary to upper primary schools in Bihar. The Unified-District Information System of Education report (U-DISE, 2014-15) revealed that about 17.45 per cent children of class V could not transit to class VI in Bihar. It seems that the goal of universal elementary education may not be realised in the near future if transition rates are not further significantly improved. The national average of transition rate is 89.58 per cent. Of 38 districts, transition rate of 14 districts in Bihar is above 85 per cent. In another 15 districts it ranges from 80.1 to 85 per cent. The transition rate in percentage of 9 districts viz. Araria (63.95), Saharsa (70.49), Purnea (71.76), Kishanganj (71.97), Katihar (72.26), Madhubani (74.84), Supaul (78.37), Gaya (78.49) and Madhepura (79.82) is less than 80 per cent. In Rajasthan only 83.79 per cent girls transited from primary to upper primary level against 99.25 per cent boys, showing a gap of about 15 percentage points. Further, a significant deviation in transition rate is observed between rural and urban areas. As compared to 78.22 per cent in rural areas, 99.74 per cent children transited to class VI in urban areas (Mehta, 2007).
Another objective of the study was to ascertain whether U-DISE was an effective tool to capture enrolments of the left school children (especially from primary schools) who were studying somewhere either in the government schools, the government-aided schools and the private schools. Such enrolments if not taken into account for computation, may lower down the transition rate. Though the transition rate shows consistent improvement over a period of time as was evident from the U-DISE report (2015-16) in Bihar, there should be some serious efforts to fish out children who were beyond the coverage of U-DISE. If such data are added to the U-DISE, there may be improvement in the transition rate which is right now not available to the agency. By the same token, if the left study cases from the terminal point of primary cycle are reduced, more improvement in the transition rate can be expected. The design of the study was framed accordingly. A few piecemeal studies (Jana et al., 2014) were conducted on the transition rate in Bengal. By and large, there exists a dearth of studies in this area.
2. THE RESEARCH QUESTIONS
1. Does U-DISE capture the left study children at the terminal point of primary schooling cycle?
Dynamics of Low Transition Rate from Primary to Upper Primary in Bihar
3. THE RESEARCH STRATEGY
3.1
The Coverage
The study was conducted on 135 schools (81 primary and 54 middle schools) randomly selected from 9 blocks and 27 CRCs of three districts-Araria, Saharsa and Gaya. 270 teachers, 174 VSS members, 98 Parents, 57 Non-transited children, 27 CRCCs and 9 BRCCs participated in the study. In each CRC 3 primary and two middle schools were selected through standard sampling procedure, ensuring an arrangement of 18 middle and 27 primary schools (45) from each district.
3.2
Tools Developed
A set of tools was developed for the study.1.Data Capturing Format for Transition, 2.Parent Interview Schedule,3.Students Interview Schedule,4. VSS Member Schedule,5.Teacher Interview Schedule.6.CRC Coordinator Interview Schedule,7.BRC Coordinator Interview Schedule.
3.3
Data Capturing Format for TransitionIt was an individual child tracking data capturing format designed to cover three events at the end of class V (2013-14): Transited students, Non-transited students and repeaters. For each category a set of code was developed. Code
P (promoted) was given to the transited children. In case of transition to another school, the code LS (left school) was assigned to them. Under LS a set of code was developed. By the same token, a separate set of codes for repeaters (R) was developed. A list of all students enrolled in class V was recorded and status of each student was separately investigated by the FIs. Their responses were coded in the respective field of the DCF accordingly. It helped estimate status of non-transited and repeater of the sampled school. LS (left school) category was further coded. If a child stops further studying it was treated as the case of drop out in class V. A separate set of code was developed for identifying reasons of left study (LS).
4. RESULTS AND DISCUSSIONS
4.1 Cross-Verification of U-DISE Enrolment Data
BP Singh, C
kumar, P which were sampled out for the study and compared it with PES enrolment data. If deviation in enrolment data between U-DISE and PES was found, it would result in a major source of low transition to class VI. Altogether 6238 students in U-DISE and 6183 students in PES were enrolled in class V of the sampled schools, showing a difference of less than one per cent (absolute figure of deviation was 55). Similarly, 4545 students in U-DISE were enrolled in class VI. PES captured 4351 students of the same class through child tracking system (CTS) from the sampled schools, making a difference of 4.27 per cent (absolute figure of deviation was 194). An overall gender gap in TR between U-DISE and PES was less than 3 per cent points in all three districts.
An attempt was made to ascertain a gap, if any between middle schools (MS) and primary schools (PS) on transition rate in the study. Other than Kursakunta the remaining two blocks of Araria witnessed a gap of 13.22 and 7.05 per cent points in transition rate. All three blocks witnessed a gap of more than 13 per cent points in transition rate between middle and primary schools of Saharsa district. A sizeable gap in TR (transition rate) between middle and primary schools was also noticed in Kahra urban block (23 per cent points). In Banma Itahari a gap in TR between middle and primary was more prominent (46 per cent points) meaning that students transited to class VI in middle schools more than primary schools. In Gaya town a wide gap in transition rate between middle and primary schools was evident (30 per cent points). Dobhi registered a gap of 22 per cent points in transition rate between middle and primary schools.
Dynamics of Low Transition Rate from Primary to Upper Primary in Bihar 4.2 Capturing Enrolments of the Left Schools Children
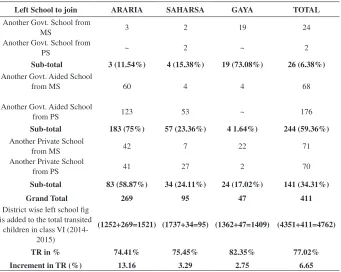
The study attempted to compute transition rate by adjusting enrolment of the left schools-the government schools, the govt.-aided schools and the private schools. Table 1 presents break-up of the left schools categories. The study attempted to compute transition rate by adjusting enrolment of the left schools-the government schools, schools-the govt.-aided schools and schools-the private schools. The computed transition rate of Araria, Saharsa and Gaya was 62.05, 72.06 and 79.6 per cent respectively which was more or less close to the U-DISE report (gap less than five per cent). When the enrolment of the uncovered schools (shifting to other government schools, other government-aided schools and other private schools) was added to the enrolment of class VI (2014-15), transition rate got increased by 74.41 in Araria 75.45 in Saharsa and 82.35 per cent in Gaya. An increment of about 13 per cent was recorded in transition rate in Araria. By the same token, Saharsa recorded an increment of 3.29 per
Table 1: Transition Rate with the Left School Children.
Left School to join ARARIA SAHARSA GAYA TOTAL
Another Govt. School from
MS 3 2 19 24
Another Govt. School from
PS ~ 2 ~ 2
Sub-total 3 (11.54%) 4 (15.38%) 19 (73.08%) 26 (6.38%)
Another Govt. Aided School
from MS 60 4 4 68
Another Govt. Aided School
from PS 123 53 ~ 176
Sub-total 183 (75%) 57 (23.36%) 4 1.64%) 244 (59.36%)
Another Private School
from MS 42 7 22 71
Another Private School
from PS 41 27 2 70
Sub-total 83 (58.87%) 34 (24.11%) 24 (17.02%) 141 (34.31%) Grand Total 269 95 47 411
District wise left school fig is added to the total transited
children in class VI (2014-2015)
(1252+269=1521) (1737+34=95) (1362+47=1409) (4351+411=4762)
BP Singh, C
kumar, P cent and Gaya witnessed an increment of 2.75 per cent. Altogether 1832 cases out of 6183 enrolled in class V were found under the left schools category. Of them 6.65 per cent cases of the shifting schools (411), 20.91 per cent cases of the left study (1293) and 2.07 per cent cases of the unknown category (128) were recorded. An increment in an overall transition rate (70.37) can readily be speculated. If the left schools figure of enrolment (411) was added to the enrolment of class VI (4351+411=4762), transition rate comes around 77.02 per cent. Again, the figure of the unknown cases (128) was added to enrolment of class VI (4762+128=4890), transition rate becomes 79.09 per cent. Hence, it was a desirable exercise to cover the enrolment of the left school children in class VI.
The left school enrolments in class VI (4351) separately for the government schools (26), the govt.-aided schools (244) and the private schools (141) were added to the enrolment of class VI for computing transition rate of each category of schools. The adjusted transition rate of each category of schools for the government schools, the govt.-aided schools and the private schools got increased gradually by 70.79 per cent (4351+26=4377), 74.74 per cent((4377+244=4621) and 77.02 per cent (4621+141=4762) respectively.
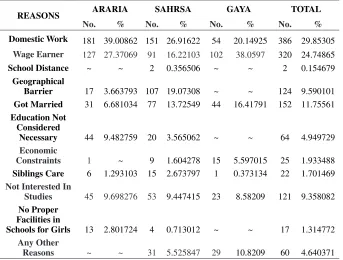
4.3 Reasons of Low Transition
Table 2 displays overall reasons of the left schools. Altogether 1293 cases were found under the left study category across district. The emerging trend pointed out that domestic work (30 per cent) and wage earning (25 per cent) were prominent reasons across district. Early marriage (11 per cent) and geographical barrier (10 per cent) were other reasons that could not be underestimated. About 152 cases of the early marriages were recorded in the study. So was the case of geographical barrier (124). A good number of students (10 per cent) were not interested in their study. Even education was not considered necessary for them as reported by the teachers (5 per cent). Other reasons were not so prominent.
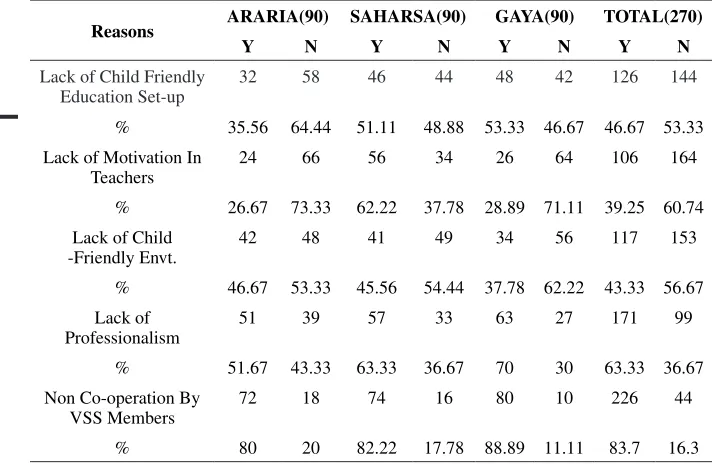
4.4 Teacher as Transition Agent
Dynamics of Low Transition Rate from Primary to Upper Primary in Bihar
per cent teachers admitted the fact that their schools were not conducive to transiting all children to class VI. Schools could not organize extra-academic activities for their students the extent it was being expected. Lack of motivation in teachers was a less significant reason of leaving the school by the children (39 per cent). By the same token, lack of professionalism caused low transition to class VI (about 63 per cent).
4.5 Assessing VSS role in Transition to Class VI
174 VSS members (Araria-57, Saharsa-62 and Gaya-55) participated in the study to share their views on this issue. In all districts VSS members frankly admitted that fact that they hardly discussed the issue of transition in the meeting. Neither VSS members nor any teacher raised this issue in the meeting. They were not satisfied with the teaching in the schools. By and large, the study registered a divided opinion on school functioning. School functioning was defined in terms of opening and closing the school, attending the school by the teachers, implementing MDM, etc. On such parameters schools were functioning. Hardly a few VSS member witnessed extra-curricular activities
Table 2: Overall Reasons of the Left Study Across District.
REASONS ARARIA SAHRSA GAYA TOTAL
No. % No. % No. % No. %
Domestic Work 181 39.00862 151 26.91622 54 20.14925 386 29.85305
Wage Earner 127 27.37069 91 16.22103 102 38.0597 320 24.74865
School Distance ~ ~ 2 0.356506 ~ ~ 2 0.154679
Geographical
Barrier 17 3.663793 107 19.07308 ~ ~ 124 9.590101
Got Married 31 6.681034 77 13.72549 44 16.41791 152 11.75561 Education Not
Considered
Necessary 44 9.482759 20 3.565062 ~ ~ 64 4.949729
Economic
Constraints 1 ~ 9 1.604278 15 5.597015 25 1.933488 Siblings Care 6 1.293103 15 2.673797 1 0.373134 22 1.701469
Not Interested In
Studies 45 9.698276 53 9.447415 23 8.58209 121 9.358082 No Proper
Facilities in
Schools for Girls 13 2.801724 4 0.713012 ~ ~ 17 1.314772
Any Other
BP Singh, C kumar, P
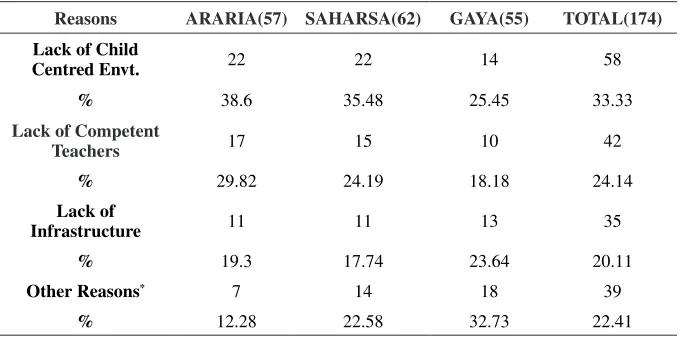
organized at the school level. One question relating to accountability for poor educational achievement was asked. All stakeholders’ accountability (including VSS members) was included in the question. In many cases both teachers and HMs were accountable for poor academic outcomes of learners. Remarkably, a few VSS members owned this responsibility. There was a general tendency to attribute either to teachers or HMs. VSS members made teachers accountable for poor quality of education. Reasons of the left study were also an important issue to them. A few questions were asked to capture their responses on the left study. 47 per cent VSS members underlined lack of child-centred set-up in schools. They also noticed lack of competent teachers in schools (37 per cent). Schools did not have adequate infrastructure like toilet for girls, playground, urinal, etc. resulting in discontinuation of the study. It was to note that teachers, to some extent, admitted the ground reality as well. The study attempted to probe it through VSS members. In Saharsa about 43 per cent parents were responsible for the left study. By the same token, more than 60 per cent VSS members in Gaya and Araria districts targeted parents for the left study. Both teachers and guardian were accountable for the poor education and discontinuation of the study.
Table 3: Reasons of Not-Admitted students In Class VI (2014-15) Reported by Teachers.
Reasons ARARIA(90) SAHARSA(90) GAYA(90) TOTAL(270)
Y N Y N Y N Y N
Lack of Child Friendly
Education Set-up 32 58 46 44 48 42 126 144 % 35.56 64.44 51.11 48.88 53.33 46.67 46.67 53.33 Lack of Motivation In
Teachers 24 66 56 34 26 64 106 164
% 26.67 73.33 62.22 37.78 28.89 71.11 39.25 60.74 Lack of Child
-Friendly Envt. 42 48 41 49 34 56 117 153
% 46.67 53.33 45.56 54.44 37.78 62.22 43.33 56.67 Lack of
Professionalism 51 39 57 33 63 27 171 99
% 51.67 43.33 63.33 36.67 70 30 63.33 36.67 Non Co-operation By
VSS Members 72 18 74 16 80 10 226 44
Dynamics of Low Transition Rate from Primary to Upper Primary in Bihar 4.6 Guardians’ Accountability for Transition
Two categories of parents- children of the left schools (n==39) and children of the left study (n=59) were intentionally selected for probing. Though their number was not sufficient, their reaction to the issue was relevant. District wise parents’ occupation and educational background were analyzed to correlate it with issues in question. The left school was explained in terms of shifting to other schools. The left study was treated as termination of the study after completion of class V. Two different set of occupational background and educational background appeared in the study. Most of the parents under the category of the left school engaged themselves either in cultivation (31 per cent) or service (36 per cent) in all three districts. Parents of the left study were by and large, wage earners (68 per cent). By the same token, the educational background of parents of the left school children was better than the left study children. A good number of mothers (79.66 per cent) and fathers (83 per cent) of the left study were illiterate, indicating a pattern that they were indifferent to education and moulded their ward as they were.
Reasons of the non-admission in class VI were also assessed. Lack of proper teaching, competent teachers and facilities were some of the prominent reasons that led to non-admission in class VI. Besides they also admitted the fact that a few children were not interested in the study. This caused discontinuation of the study. They also alleged that schools could not ensure proper teaching (34 per cent), resulting in termination of the study. At present such students were engaged either in domestic work or wage earning activities (25 per cent and 41
Table 4: Reasons of the Left Study (2014-15) Reported by VSS Members.
Reasons ARARIA(57) SAHARSA(62) GAYA(55) TOTAL(174)
Lack of Child
Centred Envt. 22 22 14 58
% 38.6 35.48 25.45 33.33
Lack of Competent
Teachers 17 15 10 42
% 29.82 24.19 18.18 24.14
Lack of
Infrastructure 11 11 13 35
% 19.3 17.74 23.64 20.11
Other Reasons* 7 14 18 39
% 12.28 22.58 32.73 22.41
BP Singh, C
kumar, P per cent respectively). A few students migrated to some other places (22 per cent). School distance was not the constraint to terminate the study.
4.7 Voice of the Non-Transited Children
The study provided a significant space for the children who terminated their study after completion of class V. Altogether 57 (Araria-17, Saharsa-16 and Gaya-24) the left study students were interviewed. They were approached with the help of either VSS members or parents. Instead of transiting to class VI they preferred to be engaged in some works because of some personal reasons. About 35 per cent children across district left the study because they were not interested in the school education. Only 30 per cent students under the left study category admitted that they discontinued the study because of guardian pressure. They also admitted the fact that they were not interested in the school education. 33 per cent of them showed their desire to continue the study. It was apparent from analysis that they (51 per cent) had a desire to inherit the same occupation as their parents had opted for. Of them a few desired (39 per cent) to learn some new skills which would help them gain more.
4.8 Looking Around CRCCs and BRCCs for Transition
About 67 per cent CRCCs could not identify low TR schools and 44 per cent high TR schools. They kept focusing on social reasons of low transition. In no way they accepted that less attention to the child was a reason of low transition. They admitted (85 per cent) the fact that schools lacked child-friendly environment because teachers had to perform some other works which adversely affected teaching-learning process. They used to organize some activities at the CRC level but participation of teachers, students and parents in such affairs was low. Under the circumstance teaching became secondary to them. In CRC meeting the issue of low transition could not figure out.
5.
SUGGESTIONS FOR IMPROVING TRANSITION RATE
• Child Tracking System (CTS) needs to be introduced in the schooling system and accountability of both the teachers and VSS members are to be fixed at this stage.
Dynamics of Low Transition Rate from Primary to Upper Primary in Bihar
curriculum changes alone cannot have a significant impact if cultural, social and political expectations are not challenged and alternative envisioned. Why learning is perceived as acquisition of knowledge rather than as understanding and conceptual change? Teacher education in the light of culture and pedagogy wraps itself in dualities, thus getting circumscribed and resistant to meaningful interrogation. The duality of acceptance and resistance reflects mind set of teachers in the education system. It is further argued that dualities around the child and the curriculum, the teacher and the curriculum, pedagogy and the curriculum, theory and practice are reinforced and even extended by the very processes that seek to train teachers to transact curriculum.
• Designing teacher training modules need to consider how the cultural dimensions of teacher thinking and teaching relate to the intended objectives of the training and to revise training accordingly. Future efforts are expected to embody cultural constructs into pedagogy and action research programmes.
ACKNOWLEDGEMENT
This study was completed with the financial support of Bihar Education Project Council, Bihar by the end of June 2016. All education officers of the selected districts and schools teachers deserve thanks for extending their support in data collection.
REFERENCES
[1] Jana, M. Khan, A. Chatterjee, S. Sar, N., and Das5, Arosikha (2014). Variability of transition rate and gender parity in rural primary school level in Gopiballavpur circle (west), paschim medinipur, West Bengal: A case specific study, Creative Education,
5, 2014–2056.
http://dx.doi.org/10.4236/ce.2014.524228