R E S E A R C H
Open Access
Implementing Smarter Lunchrooms
Makeovers in New York state middle
schools: an initial process evaluation
Laura N. Thomas
1, Tisa F. Hill
2, Alisha Gaines
1*and Jamie S. Dollahite
3Abstract
Background:This paper presents design and findings from the process evaluation of a randomized controlled trial (RCT) testing the effectiveness of Smarter Lunchrooms Movement (SLM) interventions to encourage consumption of either fruit, vegetables, or unflavored milk in middle school cafeterias (grades 6–8, typically children ages 10–14 years). Using the RE-AIM (Reach, Effectiveness, Adoption, Implementation, and Maintenance) framework adapted for environmental interventions, the process evaluation monitored fidelity to SLM protocol, determined barriers and facilitators influencing fidelity, and identified the training and support needs of implementers.
Methods:Under research team guidance, community partners (interventionists) assisted school food service staff (providers) with a six week implementation of protocol items in 13 public middle school cafeterias (two milk treatment, three vegetable treatment, four fruit treatment, and four control) in New York State during the 2013–2014 academic year. Process evaluation measures included semi-quantitative measures of implementation and maintenance (lunchroom audits) and qualitative data (environmental assessments and semi-structured interviews with school food service staff). Analyses identified challenges and opportunities for improving intervention delivery. Results: Approximately 75 % of enrolled students participated in school lunch programs and thus were exposed to the SLM intervention. Findings indicated potential contamination by other nutrition-related activities in the lunchroom and larger school environment may have affected the intervention impact. Modest implementation fidelity scores were observed for intervention treatments. Providers reported treatments were acceptable and feasible, however interventionists confirmed motivation and perceived effectiveness varied among schools. Post-intervention audits revealed limited maintenance of intervention protocols. Strategies to enhance buy-in and communication among providers and increased interventionist support are recommended.
Conclusions:RE-AIM was a valuable framework for this process evaluation. Results highlighted implementation barriers and facilitators, and findings will enhance interpretation of forthcoming outcome data. Results will inform future iterations of the SLM RCT and provide valuable insights for those designing environmental interventions in school cafeterias.
Keywords:Behavioral economics, Process evaluation, RE-AIM, School meals, Childhood obesity, Nutrition Abbreviations:CEP, Community eligibility provision; NSLP, National School Lunch Program; RCT, Randomized controlled trial; RE-AIM, Proper name of the evaluation framework with the following domains: reach, effectiveness, adoption, implementation, and maintenance; SLM, Smarter Lunchrooms Movement; SNAP-Ed, Supplemental Nutrition Assistance Program Education; USDA, United States Department of Agriculture
* Correspondence:[email protected]
1Division of Nutritional Sciences, Cornell University, 342A Martha Van Rensselaer Hall, Ithaca, NY 14853, USA
Full list of author information is available at the end of the article
Background
Childhood obesity remains a global health concern, par-ticularly among industrialized countries such as the United States (US), in which 2014 prevalence among children 2–19 years old was 17 %, with children of racial/ethnic minorities and children of low-income fam-ilies at increased risk [1, 2]. These data have provided no evidence of a decline in prevalence, and the association between childhood obesity and comorbidities [3], as well as the persistence of obesity into adulthood [4], has been well documented. Additionally, adolescence represents a time of biological and social development during which decreases in overall diet quality and adoption of un-healthful food habits have been observed [5].
Schools have the unique ability to support child health via education, physical activity, and food environments, and have thus been identified as ideal locations for obes-ity prevention programs [6]. Reviews indicate that school health interventions have had limited success decreasing obesity and improving dietary intake, though random-ized controlled trails (RCTs) with nutrition components were promising [7, 8]. The school food environment has received particular attention, given the broad reach of school meal programs and the potential negative impact of food and beverages of minimal nutritional value offered outside of meal programs [9]. Thus common approaches to improve student health have included policy changes to restrict these competitive foods in school settings [10].
Smarter Lunchrooms Movement (SLM) strategies are based on the behavioral science principle of libertarian paternalism, which posits that food selection can be in-fluenced by changing behavioral cues without restricting choices [11–13]. SLM pilot studies have indicated that subtle changes to the school lunchroom environment, which make the healthier choices the easier choices for students, may increase selection and consumption of more nutritious foods [12, 14–21]. The present study was the first in a series of RCTs initiated to test the effectiveness of SLM interventions in middle schools (grades 6–8, students typically ages 10–14 years).
In addition to a rigorous experimental design to test effectiveness, it was imperative that this type of interven-tion be subject to process evaluainterven-tion. Process evaluainterven-tions serve multiple functions, including helping to prevent a type III error [22] by monitoring and assuring quality of intervention implementation fidelity, identifying barriers and facilitators to implementation, and assessing the extent to which the intervention is sustained after the study has ended (i.e., maintenance) [23, 24]. Results can facilitate understanding of the internal and external validity of the intervention [25], thus helping interpret intervention results and informing translation of re-search to practice. The RE-AIM (Reach, Effectiveness,
Adoption, Implementation, and Maintenance) frame-work serves as a useful foundation for designing process evaluation and for reporting salient intervention dimen-sions, and it was adapted for use in the current study [26–29]. This paper presents the design and findings of the process evaluation conducted for the first of three years of the SLM RCT, during which strategies were tested in isolation to determine individual effectiveness prior to testing in combination in year two.
Methods
Intervention design
This RCT was developed in response to a United States Department of Agriculture (USDA) Agriculture and Food Research Initiative request for proposals to target obesity reduction and prevention among middle school age children and was approved by the Cornell University
Institutional Review Board (reference number
1203002914A004). Using small, low- or no-cost changes to the school lunchroom, the primary goal was to in-crease selection and consumption of fruits, vegetables, or unflavored milk offered to students as part of the Na-tional School Lunch Program (NSLP). The full list of protocol items can be found in Table 3. Briefly, 15 items were included in the fruit protocol, 13 in the vegetable protocol, and nine in the milk protocol. These items were grouped into three domains: 1) placement and dis-play, which included positioning vegetables after the en-trée and offering fruit at multiple points on the service line, 2) creative naming, which entailed posting cards with creative names for fruits, vegetables, and milk on service lines and incorporating names into school menus, and 3) nutrition messaging that included new, rotating nutrition factoid posters in the cafeteria. Fruit and vegetable protocols included an additional “variety” domain, which included offering more than one type of fruit and vegetable daily.
In order to determine the effectiveness of SLM in a variety of settings, the intervention was conducted in a convenience sample of New York State urban and rural middle schools during the 2013–2014 academic year. Eligible schools were public institutions participating in NSLP with dedicated lunch times or serving lines for middle school students. Schools that served other grades concurrently were ineligible because of the inability to collect middle school student data separately.
Researchers partnered with local Cooperative Exten-sion nutrition educators (referred to as interventionists) to deliver the intervention in schools, thus schools were recruited from areas in which there were available inter-ventionist staff. A school sampling frame was developed based on the number of students participating in NSLP and balanced representation of urban and rural school districts [30]. Schools were recruited until total NSLP
participation across all schools allowed for the minimum number of tray waste observations needed to detect a 5 % change in consumption for each treatment condi-tion, determined using sample size calculations (80 % power) based on previous SLM studies [16, 17, 19, 31]. Schools were randomized to control or intervention groups, for a total of two milk treatment, three vegetable treatment, four fruit treatment, and four control schools. (Schools were balanced by the number of NSLP participat-ing students, resultparticipat-ing in an uneven number of schools in each treatment.) The milk treatment was administered over six weeks in the fall 2013 semester, while fruit and vege-table treatments were administered separately and in differ-ent schools during six weeks of the spring 2014 semester.
Interventionists were responsible for recruiting schools, training school food service staff (referred to as providers) in the SLM protocol, and conducting weekly contact with providers to answer questions, troubleshoot challenges, and encourage treatment fidelity during the intervention period. Additionally, based on feedback from interventionists and providers in fall 2013, inter-ventionists worked with middle school children to de-velop creative names used to promote fruits and vegetables on lunchroom signage in spring 2014 [18]. "Ice Cold White Milk" was the pre-assigned promotional name on relevant signage in fall 2013.
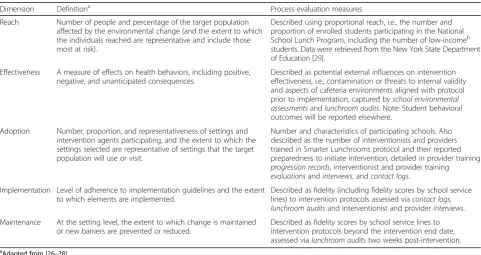
Process evaluation framework, measures, and analyses The RE-AIM framework was adapted to satisfy the needs of an environmental intervention [26–28]. The
definitions and associated process evaluation measures of Reach, Effectiveness, Adoption, Implementation, and Maintenance are described in Table 1. (Effectiveness has been interpreted as potential external influences on the intervention, whereas overall effectiveness of the SLM interventions, measured by student food selection and tray waste, will be reported in a forthcoming paper.) All described process evaluation measures were developed for this study and reviewed by the research team for face validity.
Qualitative and semi-quantitative methods were employed to collect process data for the dimensions of the adapted RE-AIM framework: school environmental assessments, school lunchroom audits, provider training records and evaluations, weekly contact logs, and post-intervention semi-structured interviews.
With assistance from school administrators and staff, interventionists completed school environmental assess-ment forms created to document school wellness pol-icies and committees, parent and teacher association activities, nutrition and health education in classrooms, and other relevant health promotion activities in partici-pating schools. Researchers reviewed these assessments for evidence of contamination or co-occurring activities that might impact student selection and consumption of foods promoted through the intervention.
School lunchroom audits were conducted in each school before, during, and after the intervention. The mid-intervention audit occurred during week three or four of the intervention to ensure providers had enough
Table 1RE-AIM dimensions and application to process evaluation measures
Dimension Definitiona Process evaluation measures
Reach Number of people and percentage of the target population affected by the environmental change (and the extent to which the individuals reached are representative and include those most at risk).
Described using proportional reach, i.e., the number and proportion of enrolled students participating in the National School Lunch Program, including the number of low-incomeb students. Data were retrieved from the New York State Department of Education [29].
Effectiveness A measure of effects on health behaviors, including positive, negative, and unanticipated consequences.
Described as potential external influences on intervention effectiveness, i.e., contamination or threats to internal validity and aspects of cafeteria environments aligned with protocol prior to implementation, captured byschool environmental assessmentsandlunchroom audits. Note: Student behavioral outcomes will be reported elsewhere.
Adoption Number, proportion, and representativeness of settings and intervention agents participating, and the extent to which the settings selected are representative of settings that the target population will use or visit.
Number and characteristics of participating schools. Also described as the number of interventionists and providers trained in Smarter Lunchrooms protocol and their reported preparedness to initiate intervention, detailed in provider training
progression records, interventionist and provider training
evaluationsandinterviews,andcontact logs. Implementation Level of adherence to implementation guidelines and the extent
to which elements are implemented.
Described as fidelity (including fidelity scores by school service lines) to intervention protocols assessed viacontact logs,
lunchroom auditsand interventionist and providerinterviews. Maintenance At the setting level, the extent to which change is maintained
or new barriers are prevented or reduced.
Described as fidelity scores by school service lines to intervention protocols beyond the intervention end date, assessed vialunchroom auditstwo weeks post-intervention.
a
Adapted from [26–28] b
time to enact the protocol comfortably, avoiding days in which tray waste was collected to minimize the potential of compounded observer effect. Audits were performed by the research team and included field notes, a compari-son of the intervention protocol items with actual lunch-room and service line set-ups, diagrams of each line set-up, and photographs of each line. To generate a semi-quantitative measure of implementation fidelity, each ser-vice line received a score for each intervention protocol item: 2 for full compliance, 1 for partial compliance, and 0 for non-compliance. Scores were calculated for all service lines in participating schools. Line scores were averaged within schools, and averages across schools in urban and rural areas were calculated. Averages across all schools were calculated to provide an idea of intervention compliance.
The research team conducted interventionist training. The two-day trainings, designed using Principles of Adult Learning Theory [32] to accommodate multiple learning styles, included an introduction to behavioral economics, project overview and logistics, and a walk-through of the expected provider training. Intervention-ists completed evaluation forms following these trainings in which understanding and preparedness were assessed with 12 items using a 5-point Likert scale (strongly disagree – strongly agree). Items included statements such as:
“…I have a better understanding of the study design, including the intervention, process evaluation, and outcome evaluation.”
“…I understand the differences between activities in intervention and control schools.”
“…I feel prepared to deliver training to intervention school staff.”
Item responses were converted to scores and averaged within and across all schools. A total mean across all items was also calculated. Open-ended questions were used to solicit opinions regarding valuable aspects of training and suggestions for improvement. These results were reviewed and summarized for all interventionists.
Interventionists delivered treatment-specific (milk, fruit, or vegetable), one-hour trainings to providers. Control school providers participated in an unrelated kitchen and food safety training created by the National Foodservice Management Institute [33]. Trainings were based on Adult Learning Theory [32] and designed for an audience with a low literacy level in response to pro-vider needs. Specific learning objectives for propro-viders in treatment schools were 1) to develop a working know-ledge of SLM rationale, 2) to gain information related to the SLM research project description, purpose, team and timeline, 3) to develop a firm understanding of the
specific change to be made in their school’s lunchroom, and 4) to practice using implementation tools. Training records were completed by interventionists and used to document training delivery. Records were reviewed for indicators that the training had been delivered as intended, and any modifications were noted. Providers completed a training evaluation that consisted of ten items assessing understanding and preparedness to im-plement the intervention using a 5-point Likert scale (strongly disagree – strongly agree), as well as open-ended questions to further solicit training feedback.
Likert scale items included statements such as:
“…I know what changes need to be made in my school lunchroom.”
“…I am comfortable with Smarter Lunchrooms tools (sings, planograms, etc.).”
“…I am prepared to carry out my role in the Smarter Lunchrooms project.”
As with interventionist evaluations, statement responses were averaged and a total mean calculated. Responses to open-ended questions were reviewed and summarized for all providers.
Weekly contact logs were completed by the interven-tionists to record providers’experiences with implemen-tation, including any challenges or concerns. Logs were also reviewed for evidence of adoption/implementation fidelity. Additionally, members of the research team con-ducted post-interventionsemi-structured interviewswith a sample of interventionists and providers regarding their experiences implementing SLM in their schools in order to understand barriers and facilitators to imple-mentation, determine the strengths and weaknesses of trainings, and clarify which elements of the intervention were maintained. All 16 interventionists and at least one provider from each of the 12 participating treatment schools (typically a manager with knowledge of day-to-day activities) were invited to participate in post-intervention interviews.
Interventionists were asked about recruitment of schools, training they received, training they delivered to providers, and the help and support they received from the research team. Providers identified challenges with implementation, provided feedback on their training, de-lineated support they received from interventionists, and described any observed intervention outcomes. Inter-viewees were also asked if there was other information they would like to discuss. Interviews were recorded and transcribed verbatim. Researchers used ATLAS.ti (ver-sion 7, 2012, ATLAS.ti Scientific Software Development GmbH, Berlin, Germany) qualitative data management software to code commonalities as well as discrepancies
in reported successes and challenges by treatment and across sites.
Results Reach
Characteristics of the 13 participating schools are further described in Adoption below. Approximately 2,100 (75 %) 6th-8th grade students enrolled in treatment schools participated in NSLP throughout the academic year and thus were exposed to the interventions (Table 2), including about 455 students from low-income families.
Schools from the urban district provided free meals to all enrolled students through the Community Eligibility Provision (CEP) [34], eligibility for which is determined based on the percentage of students from low-income families. In these schools, >95 % of students participated in NSLP. No participating rural schools qualified for CEP, thus more urban students (95 %) were reached with the intervention compared with rural students (65 %).
Effectiveness
Process data highlighted several possible sources of con-tamination within participating schools that may have affected student food selection and tray waste. School environmental assessments revealed that all treatment schools had established wellness policies that varied in content and active contribution to school food and
nutrition education environments, and urban treatment schools operated under the same district-wide policy. Policies most often addressed meeting requirements of the federally established NSLP and integrating nutrition education in the classroom. Curricula in all schools in-corporated nutrition education components in health or family and consumer sciences courses, which most often included Supplemental Nutrition Assistance Program Education (SNAP-Ed) fruit and vegetable activities from the Cooking Matters curriculum [35].
Schools were asked to delay introduction of new extra-curricular food and nutrition education programming if possible; one urban milk treatment school suspended a weekly nutrition program for the duration of the inter-vention. However, direct nutrition education program-ming was occurring in two rural treatment schools, one fruit and one vegetable, during the intervention period. Programming included USDA MyPlate and Supertracker meal and activity planning [36], the Choose Health: Food, Fun, and Fitness healthy eating and active living curriculum [37], and National Nutrition Month activities [38] in the spring semester.
Pre-intervention school lunchroom audits identified newly adopted cafeteria practices developed in response to changes in the NSLP regulations [39]. SLM interven-tion protocol dictated that treatment schools increase fruit and vegetable selections to at least two varieties per line. However, all participating schools were already
Table 2Demographic characteristics of participating schools and enrolled students, Smarter Lunchrooms Makeovers RCT, New York State, 2013–2014
Fall 2013 Spring 2014
School treatment Milk Milk Control Vegetable Vegetable Vegetable Fruit Fruit Fruit Fruit Control Control Control
Designation Urban Rural Rural Urban Rural Rural Urban Urban Rural Rural Urban Urban Rural
Lines represented (n lines) 3 4 2 4 6 1 2 3 2 2 3 2 2
Total enrollment grades 6–8 (n students)
192 755 892 369 159 295 151 233 327 315 91 193 386
Average NSLP participation (% students)
95 72 57 92 60 50 95 95a 59 72 100 84 59
Reachb (n students)
183 542 508 338 96 147 144 223 192 227 91 163 226
Low-income students (% students)
82 50 51 71 64 38 85 91 57 53 91 85 49
Race/Ethnicity (% students)
Black 92 7 12 23 6 6 93 18 1 2 33 85 4
White 2 77 62 57 90 89 2 6 92 97 20 5 90
Hispanic 3 9 16 3 3 3 3 73 4 <1 7 5 4
Other 3 7 10 17 1 2 2 3 3 <1 40 5 2
Gender (% students)
Female 54 49 50 47 46 50 45 50 47 46 56 55 47
Male 46 51 50 53 54 50 55 50 53 54 44 45 53
a
Missing data. Calculated as the average participation of other schools within the same district b
offering a minimum of two fruits and two vegetables in response to recent NSLP regulations, rendering this par-ticular component insensitive to change. There was no apparent impact of NSLP changes on the milk treat-ment. In addition to these changes, audits also revealed that students in urban schools (CEP schools) could se-lect from either one hot or one cold lunch daily, with no competitive foods available, thereby minimizing student choice and differences in food selected by students. Stu-dents in rural schools were exposed to larger numbers of competitive food options.
Adoption
School-level adoption
Of the 17 schools invited to participate, 13 (nine treat-ment, four control) across eight school districts in five counties (one urban, four rural) participated in this RCT. See Table 2 for further school demographic char-acteristics. Adoption occurred at the food service dir-ector level with approval of school administration. Two school food service directors representing four schools in two rural counties were unwilling to participate in the intervention, citing negative experiences with previous involvement in research studies.
Interventionist- and provider-level adoption
All 16 interventionists received the training conducted by researchers and completed the training evaluation. Mean rating across items was 4.5 out of 5 (range: 4.0 -4.9), indicating interventionists agreed or agreed strongly that they understood the project purpose and their roles and felt equipped to initiate study responsibilities. Data
from open-ended evaluation questions and
post-intervention interviews with 14 post-interventionists (88 % response) revealed that they found the trainings detailed and well organized. They enjoyed the hands-on nature of the activities and liked the training materials.
However, due to production and shipping delays, inter-ventionists did not have access to the complete set of intervention materials needed to train the providers, which negatively impacted their ability to effectively train the providers for successful implementation of SLM in a timely manner. Interventionists suggested that the full complement of these materials be available at future trainings. Interventionists in the urban locations also requested the development of a module with guidance on how to increase buy-in from reluctant or less en-thusiastic providers.
Urban Interventionist:“I guess one thing would be maybe some guidance regarding if…they agree to buy in at the food service director level, but at the front-line level, in this case food service staff, they're not really on board with it. So, some direction there.”
Interventionists reported they were comfortable deliv-ering the training to providers, as it was designed in accordance to their standard programming. Training re-cords indicated that all components of provider trainings were delivered in all treatment schools; however, both urban and rural interventionists reported enhancing the trainings to be more responsive to provider learning styles and to increase provider buy-in. For example, urban interventionists reported offering fruit and vege-table snacks during provider trainings as both an incen-tive to participate as well as a teaching tool.
Training records also indicated that interventionists in the urban schools encountered unexpected time constraints and typically had only 20–25 min to deliver one-hour pro-vider trainings. Urban interventionists indicated that train-ings typically took place during providers’lunch breaks and that providers often left before the end of the training to continue setting up the lunch line. As a result, intervention-ists believed that the training was disruptive to providers and may have generated a negative attitude towards the intervention from the onset. One urban interventionist noted, “It’s already coming in a negative manner. You know?‘Oh, you’re interrupting our lunch.’”Both urban and rural interventionists spoke of the need to include more in-formation in the training for providers about how SLM strategies could positively impact the school food service staff, students, and the food service budget.
Rural interventionist:“If there’s more information about how this benefits the kids ultimately, or benefits, you know, the cafeteria staff…If it’s less things going in the garbage, it could help your bottom line…Whatever we can bring back to show them the benefits would be good.”
Sixty-one of 63 providers attending trainings com-pleted training evaluations (97 % response), and eight of 12 providers (67 % response) in manager positions ticipated in post-intervention interviews. Interview par-ticipation varied based on response to this invitation and willingness to participate, difficulty scheduling inter-views, and inclement weather and road conditions that prohibited both travel and whether or not schools were open/staff were available. Training evaluation responses indicated mean understanding and preparedness was 4.1 out of 5 (range: 3.0 - 4.9). Providers were less likely to report that they believed the intervention would benefit students or that they were excited to begin the interven-tion. Providers were most likely to indicate that they were prepared to carry out their role in this project and that they knew who to contact with questions. Interview data also indicated that providers believed the training was effective, and providers offered few suggestions for training improvements.
Implementation
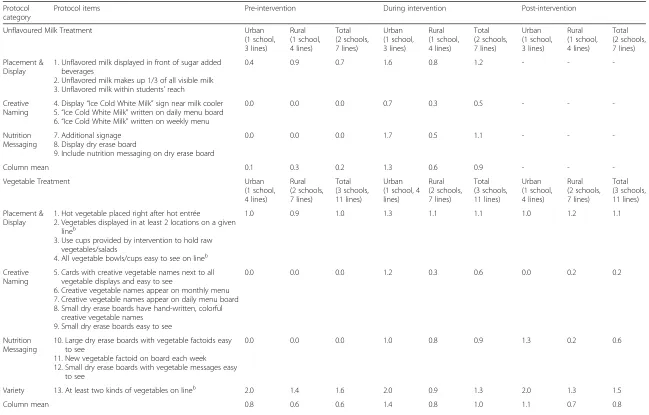
Table 3 includes average fidelity scores for the protocol items pre-, during, and post-intervention for urban and rural treatment schools’service lines. For each treatment domain, scores were averaged across lines, across schools in urban and rural groups, and finally across all schools.
Milk treatment
Overall fidelity across both schools was moderate (0.9/2 points, or 45 % compliance); however, the urban school demonstrated higher overall compliance during the intervention period (65 %) compared with the rural school (30 %). Fidelity was most limited for use of cre-ative naming. Specifically, both schools displayed signage next to milk coolers, while neither added creative names to daily or weekly menus. Placement and display items were implemented most consistently, though because of some pre-intervention adherence within this category, the largest increase in compliance from pre- to during intervention was seen for nutrition messaging. Urban providers implemented both the placement and display and nutrition messaging protocol items with the highest degree of compliance and with substantial increases from baseline to intervention. Increased variety of beverages (seltzer water and other sugar-sweetened beverages) and number of display cases available in the rural school made it impossible for providers to offer unflavored milk in all areas where beverages were available to students, effectively decreasing fidel-ity scores.
Vegetable and fruit treatments
Total fidelity to vegetable protocol items across all three treatment schools during the intervention was approxi-mately 50 %, and there were notable differences among overall compliance in rural (40 %) and urban schools (70 %). Fidelity was highest among variety protocol items in urban and rural schools, though compliance was skewed by 100 % baseline adherence in urban areas. Messaging was the least implemented category across all lines, followed by creative naming. Despite modest fidel-ity scores, the largest increases in compliance were ob-served for creative naming in both urban and rural areas, as well as messaging in rural schools.
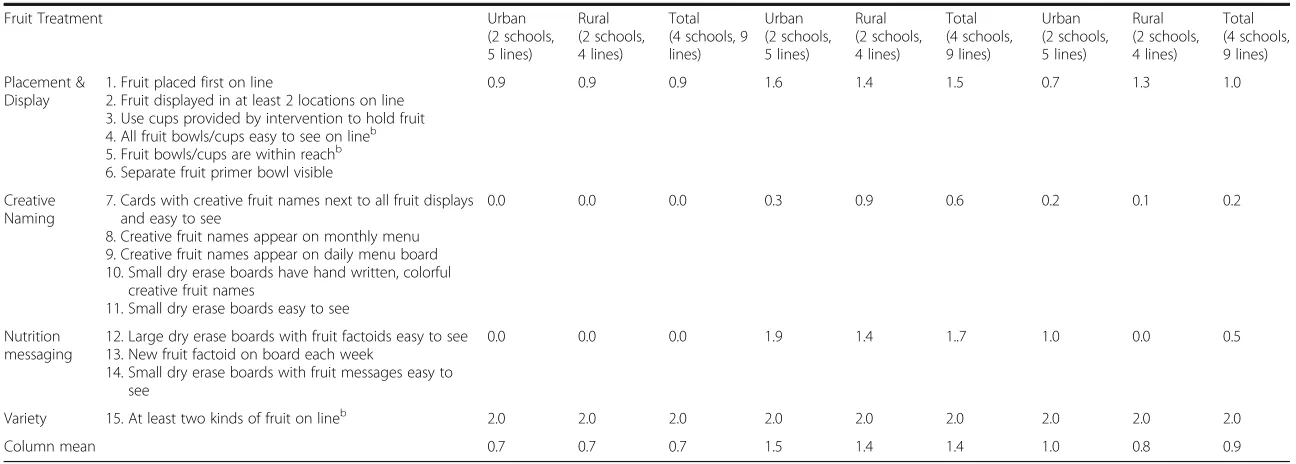
Total fruit fidelity during the intervention (70 %) was higher than total vegetable fidelity (50 %), with similar compliance among urban and rural schools (75 and 70 %, respectively). Unlike with vegetable variety, both urban and rural schools were in 100 % compliance with fruit variety prior to and during the intervention. Ex-cluding variety, fruit messaging items were implemented with the highest fidelity across all lines and accounted for the largest increases in compliance from baseline.
Fidelity was lowest for fruit creative naming protocol items, though rural lines demonstrated higher adherence than urban lines. For both fruit and vegetable treat-ments, the vast majority of schools failed to add creative fruit or vegetable names to their daily and monthly menus, keeping fidelity scores low.
Additionally, urban and rural school lines exhibited contrasting fidelity to creative naming for the fruit and vegetable interventions. In urban schools, fidelity to vegetable creative naming was higher than similar proto-col items for fruit intervention, as the wide variety of fruit offerings created challenges both in matching daily options with the creative names and finding room on the sneeze guard to post all of the fruit signage needed at a given time. While rural schools complied with fruit creative naming at a higher level than similar protocol items for the vegetable intervention, the reasons for this difference were unclear.
Fidelity to placement and display protocol items for fruit compared with vegetables during the intervention was largely attributable to consistent use of primer bowls provided, which increased visibility of whole fruit and was unique to the fruit intervention, and to more con-sistent use of attractive serving cups in fruit treatment schools compared with vegetable treatment schools.
Data from lunchroom audits suggested that the vegetable treatment received a much lower dose of the intervention than the fruit treatment, even when imple-mentation fidelity was high, due to the relative proportion of fruit offered in lunchrooms as compared to vegetables. Specifically, in any given school there was usually a selec-tion of several fruits available, while there was typically only one hot and one cold vegetable offered each day. Fruit treatment school lines were often saturated with cre-ative fruit name signage, while vegetable signage was less obvious due to limited varieties available.
Implementation barriers and facilitators
Many providers liked the materials provided by the intervention and the initial effect on the students. In an urban school, “When the children saw the bowls…they were very excited…when they started grabbing the salad they said‘Oh!’ Their eyes got big. Their face lit up and they were passing over [to] pick a salad. All the other kids would take one.” A rural provider noted, “I mean, you know they just read [creative name sign], you always had that little giggle or whatever.”Providers also enjoyed the names that the students generated for menu items. “I mean, we had some good comments. You know, they thought it was going to be cute and stuff and nice names that [the students] had chosen.”
Table 3Protocol description and mean implementation fidelity scoresafor treatment school lines, Smarter Lunchroom Makeovers RCT, New York State, 2013–2014
Protocol category
Protocol items Pre-intervention During intervention Post-intervention
Unflavoured Milk Treatment Urban
(1 school, 3 lines)
Rural (1 school, 4 lines)
Total (2 schools, 7 lines)
Urban (1 school, 3 lines)
Rural (1 school, 4 lines)
Total (2 schools, 7 lines)
Urban (1 school, 3 lines)
Rural (1 school, 4 lines)
Total (2 schools, 7 lines)
Placement & Display
1. Unflavored milk displayed in front of sugar added beverages
2. Unflavored milk makes up 1/3 of all visible milk 3. Unflavored milk within students’reach
0.4 0.9 0.7 1.6 0.8 1.2 - -
-Creative Naming
4. Display“Ice Cold White Milk”sign near milk cooler 5.“Ice Cold White Milk”written on daily menu board 6.“Ice Cold White Milk”written on weekly menu
0.0 0.0 0.0 0.7 0.3 0.5 - -
-Nutrition Messaging
7. Additional signage 8. Display dry erase board
9. Include nutrition messaging on dry erase board
0.0 0.0 0.0 1.7 0.5 1.1 - -
-Column mean 0.1 0.3 0.2 1.3 0.6 0.9 - -
-Vegetable Treatment Urban
(1 school, 4 lines)
Rural (2 schools, 7 lines)
Total (3 schools, 11 lines)
Urban (1 school, 4 lines)
Rural (2 schools, 7 lines)
Total (3 schools, 11 lines)
Urban (1 school, 4 lines)
Rural (2 schools, 7 lines)
Total (3 schools, 11 lines)
Placement & Display
1. Hot vegetable placed right after hot entrée
2. Vegetables displayed in at least 2 locations on a given lineb
3. Use cups provided by intervention to hold raw vegetables/salads
4. All vegetable bowls/cups easy to see on lineb
1.0 0.9 1.0 1.3 1.1 1.1 1.0 1.2 1.1
Creative Naming
5. Cards with creative vegetable names next to all vegetable displays and easy to see
6. Creative vegetable names appear on monthly menu 7. Creative vegetable names appear on daily menu board 8. Small dry erase boards have hand-written, colorful
creative vegetable names 9. Small dry erase boards easy to see
0.0 0.0 0.0 1.2 0.3 0.6 0.0 0.2 0.2
Nutrition Messaging
10. Large dry erase boards with vegetable factoids easy to see
11. New vegetable factoid on board each week 12. Small dry erase boards with vegetable messages easy
to see
0.0 0.0 0.0 1.0 0.8 0.9 1.3 0.2 0.6
Variety 13. At least two kinds of vegetables on lineb 2.0 1.4 1.6 2.0 0.9 1.3 2.0 1.3 1.5
Column mean 0.8 0.6 0.6 1.4 0.8 1.0 1.1 0.7 0.8
Thomas
et
al.
Archives
of
Public
Health
(2016) 74:41
Page
8
of
Placement & Display
1. Fruit placed first on line
2. Fruit displayed in at least 2 locations on line 3. Use cups provided by intervention to hold fruit 4. All fruit bowls/cups easy to see on lineb 5. Fruit bowls/cups are within reachb 6. Separate fruit primer bowl visible
0.9 0.9 0.9 1.6 1.4 1.5 0.7 1.3 1.0
Creative Naming
7. Cards with creative fruit names next to all fruit displays and easy to see
8. Creative fruit names appear on monthly menu 9. Creative fruit names appear on daily menu board 10. Small dry erase boards have hand written, colorful
creative fruit names
11. Small dry erase boards easy to see
0.0 0.0 0.0 0.3 0.9 0.6 0.2 0.1 0.2
Nutrition messaging
12. Large dry erase boards with fruit factoids easy to see 13. New fruit factoid on board each week
14. Small dry erase boards with fruit messages easy to see
0.0 0.0 0.0 1.9 1.4 1..7 1.0 0.0 0.5
Variety 15. At least two kinds of fruit on lineb 2.0 2.0 2.0 2.0 2.0 2.0 2.0 2.0 2.0
Column mean 0.7 0.7 0.7 1.5 1.4 1.4 1.0 0.8 0.9
a
2 points for full complicance, 1 point for partial compliance, 0 points for non-compliance
b
Protocol elements already in place prior to study
Archives
of
Public
Health
(2016) 74:41
Page
9
of
time consuming given time and space constraints in their cafeterias.
Rural provider:“With budgetary cuts, I have a skeleton crew, and you know that five, ten minutes it takes to write that poster up, you know, once a week, especially on a Monday, that’s just very time
consuming. Mondays are the worst prep day, I mean, you’ve got to get everything set up for the week.”
In both urban and rural schools, some providers ques-tioned intervention effectiveness and/or expressed nega-tive attitudes related to the perceived ineffecnega-tiveness of their efforts. An urban provider believed“…at this particu-lar school, it didn’t impress the children at all. You know, they could care less whether you had it there or not… Some of them didn’t even look at the signs and, and paid no attention to the signs.”Another urban provider said,“I think it’s a complete waste of time.” One rural provider questioned sustained impact, stating, “After the four-week cycle had gone through and we had started again, I didn’t really hear as many comments about it.”
The need for provider buy-in was highlighted by con-tact logs from schools receiving fruit or vegetable inter-ventions that revealed some urban schools had low levels of implementation fidelity in the first few weeks of the intervention. This was resolved when the school dis-trict’s food service director intervened to communicate that intervention participation was mandatory. In the urban county, the whole school district was recruited via the food service director, whereas rural providers opted in on a school-by-school basis, indicative of differing management structures which may have impacted staff motivation.
Additionally, there was a strong sense among pro-viders that they did not have a lot of input in the execu-tion of the intervenexecu-tion, as exemplified by a rural provider:“But based on my staff observations, they kind of felt left out of it. They were just, you know, everybody came in and just told them what they were going to do, and they just kind of did it.”
During post-intervention interviews, both interven-tionists and providers mentioned the need to generate excitement about the project and potentially offer incen-tives for providers.
Urban interventionist:“We can create more
excitement too, like… ‘This is the tool kit. This is all the stuff you’re gonna have, and you can keep them.’ Some type of incentive and some type of challenge. Well the schools that do…the best job, you know, they all [get taken] out for lunch or have a big… celebration…they can get movie tickets, you know, all different little things…to motivate them.”
Maintenance
Barriers and facilitators to intervention implementation likely impacted maintenance of treatments as well. Table 3 indicates the extent to which the schools were complying with the fruit and vegetable intervention about two weeks after the end of the intervention period, i.e. in the maintenance period. Due to winter weather travel conditions, maintenance data were not collected for the milk treatment.
Fidelity to placement and display protocol items for both fruit and vegetable treatments returned to baseline levels, though there was modest maintenance in rural schools. Though generally not maintained at interven-tion levels, nutriinterven-tion messaging components of fruit and vegetable treatments were typically maintained above baseline. Notable exceptions include continued increase of vegetable messaging in urban schools and abandon-ment of fruit messaging in rural schools.
Despite noted barriers, lunchroom audits revealed use of creative fruit names were still being employed post-intervention, and while rural providers also maintained some naming for vegetables, urban providers did not. Post-intervention interviews with providers suggested that providers continued to use the signage for the fruits and vegetables. “I mean, the signs do look cute, so we do still use them,” said one urban provider, and a rural provider stated, “We’re still putting the signs up for the vegetables, and we still, I still left the names on the menu and stuff.”
Discussion
In light of the prevalence of childhood obesity and schools’unique position to effect changes in student diet and body weight [6], school health interventions are in-creasingly common, though have been marginally suc-cessful [7, 8]. SLM interventions have been shown to positively impact student consumption in pilot studies [12, 14–21] and are of particular interest in middle schools, given that students are experiencing critical physical and psychosocial development [5]. The effective-ness of SLM protocol items on increasing student selec-tion and consumpselec-tion of fruit, vegetables, or unflavoured milk was therefore tested using a rigorous experimental design with process evaluation based on an adapted RE-AIM framework [26–28].
Reach
Approximately 75 % of enrolled students were exposed to SLM interventions throughout the 2013–2014 school year. This intervention coincided with the introduction of CEP [34], or universal free lunch. Thus via CEP, reach was effectively expanded in urban schools due to high levels of NSLP participation (coinciding with increased exposure among higher proportions of students from
low-income families). Such national policies provide in-creased opportunities for interventions to complement and augment health impacts, particularly among youth at risk for obesity.
In this study, all students entering the cafeterias could have been exposed to aspects of the intervention, even if not participating in school meal programs, and any intervention-specific changes that were maintained will continue to reach students in subsequent years. Though this likely increased the number and representativeness of students reached, spillover effects were not assessed in the present study.
It is important to note that reach is defined more broadly within environmental interventions, thereby warranting multiple indicators of this dimension [27, 40]. Sweet et al. [40] included several reach categories (intended, direct, and indirect) in their evaluation of mul-tisector partnerships, a methodological consideration for future iterations of this study. Glasgow et al. [41] advocate for evaluation of the combined impact of reach and effect-iveness in order to yield integrated data that could more thoroughly inform SLM intervention design and future school policy decisions.
Effectiveness
Forthcoming outcome results will provide indicators of intervention effectiveness, though because of the dy-namic, multi-dimensional school environment, an array of confounding factors is not uncommon [42] and should be assessed before drawing conclusions regarding changes in student food consumption as a direct effect of SLM [43]. Findings indicated the potential for con-tamination in the larger school environment (e.g., nutri-tion educanutri-tion) that may have supported positive food choices and thereby diminished the apparent impact of the SLM intervention. Additionally, cafeteria policies and practices related to food availability may have had a range of effects on study outcomes. Increased fruit and vegetable variety in response to NSLP regulation changes [39] had the potential to positively impact student diet, but changes introduced a ceiling effect that should be considered in analyses of outcome data and design of future study protocols.
Conversely, the presence of competitive foods in rural schools may have negatively impacted student intake, and the full food environment will be considered when analyzing the impact of SLM protocol items designed to work within unrestricted food environments. In a sys-tematic review, Chriqui et al. [10] reported mixed effects of competitive food policies on overall student consump-tion and body mass index and concluded that more and rigorous research is needed to truly understand effect of these policies. SLM pilot work has suggested that student selection and consumption can be improved without
restrictions beyond NSLP regulations [12, 14–21], and outcome results of this RCT strengthened by process evaluation data will provide further evidence regarding the effectiveness of such approaches.
Adoption
A high percentage of invited schools (76 %) agreed to participate in the current study. Adoption was higher than in other studies which have involved school edu-cation departments (i.e., teacher involvement or cur-riculum changes) [42, 44]. Because the NSLP falls under the jurisdiction of USDA, participation was also likely enhanced due to the national recognition of SLM as a USDA-approved program.
In this study, adoption was also described using train-ing results. Research has suggested that well-trained interventionists and providers demonstrate enhanced ability to deliver the intervention, important for treat-ment fidelity [45]. The high response rates for both interventionist and provider training evaluations and post-intervention interviews lend confidence in the rep-resentativeness of data presented. Interventionists indi-cated high levels of satisfaction with trainings they received. Evaluations suggested that providers felt the training effectively prepared them to execute the inter-vention and that they did not find the interinter-vention to be too complicated. Interventionists reinforced the need to have the full complement of materials available at the training to both enhance the training experience and po-tentially impact intervention outcomes by increasing provider motivation and adoption. Intervention design considerations that consider ease and efficiency of de-livery have been shown to enhance adoption in other settings as well [24].
However, data from provider training progression re-cords, provider training evaluations, and interviews highlighted the need to generate provider buy-in. In re-sponse, the research team will develop a training module informed by these results and fidelity literature [45] which will equip interventionists to emphasize relevancy and benefits of SLM work, such as the prestige of par-ticipation in a USDA-funded study, potential reduction of tray waste and enhanced bottom lines, and facilitation of healthful student food choices. Further, to address the issues of time constraints and minimize interruptions, future provider trainings should be scheduled to coincide with in-service days. Incentives will also be considered.
Implementation and maintenance
to the limited variety of vegetables available daily. Over-all, both urban and rural compliance with each fruit treatment category was higher than observed for vegeta-bles, with the exception of creative naming in urban lines. Another SLM study conducted in Ohio schools found mean implementation scores for fruit practices were higher than scores for vegetable practices [46].
Following variety, placement and display protocol items for fruits, vegetables, and milk were the most con-sistently implemented, though many were in place pre-intervention and gains observed during the pre-intervention period were lost post-intervention when fidelity scores generally returned to baseline. These results may point to provider comfort with protocol items that reflected their pre-intervention routines, while naming and mes-saging components were additions to provider routines. Though naming and messaging items accounted for the largest increases in fidelity scores from baseline, fidelity to these components was generally lower than variety and placement/display items, and the reason most com-monly cited by providers for inadequate implementation was a lack of time.
Implementation and maintenance fidelity scores may have been an indirect reflection of provider attitudes. Rural providers had more neutral or positive attitudes towards the intervention, whereas the urban providers tended to be more negative, contributing to food service director intervention that increased fidelity. These urban schools were recruited via the district-wide food service director, thus each school’s providers had no say in par-ticipation. Rural districts encompassed fewer middle schools with more closely connected food service ad-ministration. Schools opted in on a school-by-school basis and may have therefore had different or more widespread motivation to participate compared with urban schools. These results highlight the need to im-prove provider engagement and buy-in at training and throughout the intervention. Phase two of this RCT will consider provider motivation and reciprocity, as well as the complexity and compatibility of the intervention with specific school settings [28, 45].
Strengths
This is the first paper to evaluate the process of imple-menting SLM in schools. Design strengths include observational data, as opposed to self-report, and the use of a mediating staff group (interventionists) that communicated, addressed, and provided timely support for concerns. These results will be used to inform future iterations of the SLM RCT. Beyond this study, results will assist the translation of research to practice in school cafeterias across the US doing SLM work. Add-itionally, authors have applied the increasingly popular RE-AIM framework designed to facilitate the translation
of research to practice [26–28, 41], and dissemination of framework adaptations such as RE-AIM for environmen-tally focused interventions is timely.
Limitations
Limitations of the study included use of a convenience sample; selection bias may have been introduced. A limi-tation related to elements of the process evaluation was the lack of a measure of preparedness to deliver the intervention among the interventionists, which should be added in future iterations of SLM work so that any necessary confidence- and skill-building can be incorpo-rated in subsequent training or intervention communi-cation. Further testing of process evaluation measures is also warranted.
Finally, fidelity scores were calculated from single ob-servation lunchroom audits conducted during the inter-vention. While triangulation of data from all process measures provided a means of interpreting data, increas-ing the frequency of fidelity measurements could provide a more accurate assessment of school adherence to SLM. Also, maintenance audits were conducted shortly after the end of the intervention to account for school holidays, and milk maintenance data was not collected. Maintenance is typically defined as a longer term dimen-sion [47, 48], which would provide a more thorough evaluation of maintenance.
Conclusions
The RE-AIM framework served as a useful foundation upon which to build the process evaluation of a SLM en-vironmental school lunchroom intervention [25–27]. Process evaluation data were used to monitor protocol implementation fidelity, understand barriers and facilita-tors to adoption, and to determine whether protocol items were maintained after the study ended. Results indicated the intervention was generally feasible, though it could be enhanced by consideration of school-level policies in place and staff engagement.
SLM is an approved intervention in the USDA SNAP-Ed Obesity Prevention Toolkit for States [49], which means that many SNAP-Ed nutrition providers are inter-ested in incorporating SLM in their programs. However, if the intervention is not delivered as intended, the out-comes will not reflect the original research [12, 14–19], limiting intervention ability to effect childhood obesity. Given the extensive reach of school meals programs, re-search and program implementers need to work more closely with providers in the schools to address and re-duce school-specific barriers to implementation.
Lastly, this paper provides important information re-garding the training of interventionists and providers to deliver SLM in both urban and rural school settings. Findings from this work may be useful for researchers
and practitioners interested in implementing similar environmental changes in school settings and are particu-larly relevant as the focus of community-based organiza-tions are shifting focus toward sustainable environmental changes for obesity prevention. Results will inform future study implementation, can be used to advise SLM projects across the nation, and will guide the development of a training model that can be disseminated nationally.
Acknowledgements
Authors would like to acknowledge Brian Wansink, David Just, and Lara Latimer for their leadership and contribution to this project. We also extend our gratitude to the invaluable support of Cornell Cooperative Extension staff and to the New York State middle school staff participating in this study.
Funding
This project was supported by Agriculture and Food Research Initiative Grant no. 2012-68001-19604 from the USDA National Institute of Food and Agriculture, Childhood Obesity Prevention: Integrated Research, Education, and Extension to Prevent Childhood Obesity–A2101.
Availability of data and materials
Tools and data presented in this manuscript are available upon requests to the corresponding author.
Author’s contributions
All authors contributed to the conceptualization, writing, and editing of this manuscript. LT designed and implemented the process evaluation framework and lead data analysis and manuscript preparation. TFH assisted LT with framework design, staff training, data collection and analysis, and manuscript preparation and revision. AG reviewed data analyses, provided suggestions regarding RE-AIM interpretations, and edited the manuscript. JSD provided expertise in process evaluation design and the RE-AIM framework and edited the manuscript. All authors read and approved the final manuscript.
Competing interests
Authors have reviewed editorial policies and declare they have no competing interests.
Consent for publication Not applicable.
Ethics approval and consent to participate
The Cornell University Institutional Review Board approved this study, which included written consent for participation, recording, and presentation of interview data from participating staff.
Author details
1Division of Nutritional Sciences, Cornell University, 342A Martha Van Rensselaer Hall, Ithaca, NY 14853, USA.2Division of Nutritional Sciences, Cornell University, 343 Martha Van Rensselaer Hall, Ithaca, NY 14853, USA. 3Division of Nutritional Sciences, Cornell University, 408 Savage Hall, Ithaca, NY 14853, USA.
Received: 9 March 2016 Accepted: 15 August 2016
References
1. Ogden C, Carroll M, Lawman H, Fryar C, Kruszon-Moran D, Kit B, Flegal K. Trends in obesity prevalence among children and adolescents in the united states, 1988–1994 through 2013–2014. JAMA. 2016;315:2292–9.
2. Singh GK, Siahpush M, Kogan MD. Rising social inequalities in US childhood obesity, 2003–2007. Ann Epidemiol. 2010;20:40–52.
3. Must A, Anderson SE. Effects of obesity on morbidity in children and adolescents. Nutr Clin Care. 2003;6:4–12.
4. Whitaker RC, Wright JA, Pepe MS, Seidel KD, Dietz WH. Predicting obesity in young adulthood from childhood and parental obesity. N Engl J Med. 1997; 337:869–73.
5. Pearson N, Atkin AJ, Biddle SJH, Gorely T, Edwardson C. Patterns of adolescent physical activity and dietary behaviours. Int J Behav Nutr Phys Act. 2009;6:1–7.
6. Story M, Kaphingst KM, French S. The role of schools in obesity prevention. Future Child. 2006;16:109–42.
7. Evans CEL, Christian MS, Cleghorn CL, Greenwood DC, Cade JE. Systematic review and meta-analysis of school-based interventions to improve daily fruit and vegetable intake in children aged 5 to 12 y. Am J Clin Nutr. 2012;96:889–901. 8. Hung L-S, Tidwell DK, Hall ME, Lee ML, Briley CA, Hunt BP. A meta-analysis
of school-based obesity prevention programs demonstrates limited efficacy of decreasing childhood obesity. Nutr Res. 2015;35:229–40.
9. Institute of Medicine (US). Committee on Accelerating Progress in Obesity Prevention, Glickman D. Accelerating progress in obesity prevention: solving the weight of the nation. DC: National Academies Press Washington; 2012. 10. Chriqui JF, Pickel M, Story M, Pickel M, Story M. Influence of school
competitive food and beverage policies on obesity, consumption, and availability: a systematic review. JAMA Pediatr. 2014;168:279–86. 11. Thaler RH, Sunstein CR. Libertarian paternalism. Am Econ Rev. 2003;93:175–9. 12. Hanks AS, Just DR, Wansink B. Smarter lunchrooms can address new school
lunchroom guidelines and childhood obesity. J Pediatr. 2013;162:867–9. 13. Just DR, Wansink, B. Smarter Lunchrooms: Using Behavioral Economics to
Improve Meal Selection. Choices, 2009;24(3).
14. Hanks AS, Just DR, Smith LE, Wansink B. Healthy convenience: nudging students toward healthier choices in the lunchroom. J Public Health (Oxf). 2012;34:370–6.
15. Wansink B, Just DR. Trayless cafeterias lead diners to take less salad and relatively more dessert. Public Health Nutr. 2013;18:1–2.
16. Just DR, Price J. Using incentives to encourage healthy eating in children. J Hum Resour. 2013;48:855–72.
17. Just D, Price J. Default options, incentives and food choices. Public Health Nutr. 2014;16:2281–8.
18. Wansink B, Just D, Smith L. What is in a name? giving descriptive names to vegetables increases lunchroom sales. J Nutr Educ Behav. 2011;43:S1. 19. Just DR, Lund J, Price J. The role of variety in increasing the consumption of
fruits and vegetables among children. Agric Res Econ Rev. 2012;41:72. 20. Wansink B, Just D, Smith L. Move the fruit: putting fruit in New bowls and
New places doubles lunchroom sales. J Nutr Educ Behav. 2011;43:S1. 21. Wansink B, Just DR, Hanks AS, Smith LE. Pre-sliced fruit in school cafeterias:
children’s selection and intake. Am J Prev Med. 2013;44:477–80. 22. Basch CE, Sliepcevich EM, Gold RS, Duncan DF, Kolbe LJ. Avoiding type III
errors in health education program evaluations: a case study. Heal Educ Behav. 1985;12:315–31.
23. Kim AE, Towers A, Renaud J, Zhu J, Shea JA, Galvin R, Volpp KG. Application of the RE-AIM framework to evaluate the impact of a worksite-based financial incentive intervention for smoking cessation. J Occup Environ Med. 2012;54:610–4.
24. Wilcox S, Parra-Medina D, Felton GM, Poston MB, McClain A. Adoption and implementation of physical activity and dietary counseling by community health center providers and nurses. J Phys Act Health. 2010;7:602–12. 25. Baranowski T, Stables G. Process evaluations of the 5-a-day projects. Health
Educ Behav. 2000;27:157–66.
26. Glasgow RE, Vogt TM, Boles SM. Evaluating the public health impact of health promotion interventions: the RE-AIM framework. Am J Public Health. 1999;89:1322–7.
27. King DK, Glasgow RE, Leeman-Castillo B. Reaiming RE-AIM: using the model to plan, implement, and evaluate the effects of environmental change approaches to enhancing population health. Am J Public Health. 2010;100: 2076–84.
28. Austin G, Bell T, Caperchione C, Mummery WK. Translating research to practice: using the RE-AIM framework to examine an evidence-based physical activity intervention in primary school settings. Health Promot Pract. 2011;12:932–41.
29. New York State Education Department (2014) Public Data Access Site. http://data.nysed.gov/. Accessed 15 Dec 2015
30. United States Census Bureau (2013) Metropolitan and Micropolitan Statistical Areas. http://www.census.gov/population/metro/. Accessed 6 Jan 2015 31. Hanks AS, Wansink B, Just DR. Reliability and accuracy of real-time
visualization techniques for measuring school cafeteria tray waste: validating the quarter-waste method. J Acad Nutr Diet. 2014;114:470–4.
33. Institute of Child Nutrition (2015) ICN Resource Center. http://www.nfsmi. org/Templates/TemplateDivision.aspx?qs=cElEPTI=. Accessed 3 Aug 2015 34. United States Department of Agriculture Food and Nutrition Service (2015)
School Meals: Community Eligibility Provision. http://www.fns.usda.gov/ school-meals/community-eligibility-provision. Accessed 15 Jul 2015 35. Share Our Strength (2015) Cooking Matters. http://cookingmatters.org/.
Accessed 3 Aug 2015
36. United States Department of Agriculture Center for Nutrition Policy and Promotion (2015) ChooseMyPlate.gov Website. http://www.choosemyplate. gov/. Accessed 3 Aug 2015
37. Cornell University Food and Nutrition Education in Communities (2013) Choose Health: Food, Fun, and Fitness youth curriculum. https://fnec.cornell. edu/for-partners/curricula/chfff/. Accessed 3 Aug 2015
38. Academy of Nutrition and Dietetics (2015) National Nutrition Month. http:// www.nationalnutritionmonth.org/nnm/. Accessed 3 Aug 2015
39. US Department of Agriculture Food and Nutrition Service (2015) School Meals: Nutrition Standards for School Meals. http://www.fns.usda.gov/ school-meals/nutrition-standards-school-meals. Accessed 3 Aug 2015 40. Sweet SN, Ginis KAM, Estabrooks PA, Latimer-Cheung AE. Operationalizing
the RE-AIM framework to evaluate the impact of multi-sector partnerships. Implement Sci. 2014;9:74.
41. Glasgow RE, Klesges LM, Dzewaltowski DA, Estabrooks PA, Vogt TM. Evaluating the impact of health promotion programs: using the RE-AIM framework to form summary measures for decision making involving complex issues. Health Educ Res. 2006;21:688–94.
42. Janssen M, Toussaint HM, van Mechelen W, Verhagen EALM. Translating the PLAYgrounds program into practice: a process evaluation using the RE-AIM framework. J Sci Med Sport. 2013;16:211–6.
43. Institute of Medicine, Committee on Comprehensive School Health Programs in Grades K-12. Challenges in School Health Research and Evaluation. In: Allensworth D, Lawson E, Nicholson L, Wyche J (eds) Sch. Heal. Our Nation’s Invest. Washington: The National Academies Press; 1997. pp. 271–295.
44. Collard DCM, Chinapaw MJM, Verhagen EALM, van Mechelen W. Process evaluation of a school based physical activity related injury prevention programme using the RE-AIM framework. BMC Pediatr. 2010;10:86. 45. Bellg AJ, Borrelli B, Resnick B, Hecht J, Minicucci DS, Ory M, Ogedegbe G,
Orwig D, Ernst D, Czajkowski S. Enhancing treatment fidelity in health behavior change studies: best practices and recommendations from the NIH behavior change consortium. Heal Psychol. 2004;23:443.
46. Rose PJ, Golub HM, Kennel JA (2015) Methods and Fidelity of Smarter Lunchrooms Program to Decrease Plate Waste in Children’s School Lunch Meal. Columbus: The Ohio State University
47. Jilcott S, Ammerman A, Sommers J, Glasgow RE. Applying the RE-AIM framework to assess the public health impact of policy change. Ann Behav Med. 2007;34:105–14.
48. Kessler RS, Purcell EP, Glasgow RE, Klesges LM, Benkeser RM, Peek CJ. What does it mean to Employ’the RE-AIM model? Eval Health Prof. 2012;00:1–23. 49. US Department of Agriculture (2014) SNAP-Ed Connection: SNAP-Ed
Interventions Toolkit for the States. https://snaped.fns.usda.gov/materials/ snap-ed-strategies-interventions-obesity-prevention-toolkit-states. Accessed 18 Aug 2015
• We accept pre-submission inquiries
• Our selector tool helps you to find the most relevant journal
• We provide round the clock customer support
• Convenient online submission
• Thorough peer review
• Inclusion in PubMed and all major indexing services
• Maximum visibility for your research
Submit your manuscript at www.biomedcentral.com/submit