DOI: 10.30954/0974-1712.08.2018.13
©2018New Delhi Publishers. All rights reserved
SOIL WATER CONSERVATION
Soil Loss Estimation of a Watershed of Central India with
Integration of Geospatial Techniques and Universal Soil Loss
Equation
Sajiya Khan
1, Akhilesh Singh*
2, Sudhir Singh Bhadauria
2, Shashi S. Yadav
1and
Amita Sharma
31Deptt. of Soil Science and Agril. Chemistry, RVSKVV, CoA, Gwalior, MP. India 2Directorate of Extension Services, RVSKVV, Gwalior, MP. India
3Department of Environment Science, RVSKVV, CoA, Gwalior, MP. India
*Corresponding author: [email protected] (ORCID ID: 0000-0001-8139-781X)
Paper No. 733 Received: 03-04-2018 Accepted: 19-07-2018
ABSTRACT
Soil erosion is a crucial problem and a critical environmental hazard in agricultural land, river catchments and reservoirs. Its assessment by various methods such as universal soil loss equation (USLE) is widely carried out by estimating the factors of the equation in a GIS environment. The Non-River catchment in Madhya Pradesh, India comprising of 836 sq. km area was studied for soil erosion and sediment losses in entirety as well as for its 33 sub catchments. The study revealed that a vertical fall of 230 meter with a sudden drop within 10 km generates a high erosion potential by runoff water in micro catchments numbered 1,2, 3, 7, 21 and 29. The erosivity (R) parameter of catchment suggested of medium precipitation but high kinetic energy in western and southern part of the catchment. The topographic factor (LS) in western part of the catchments is higher which covers the sub catchments referred above. The forest land, fallow land and ravine lands comprising of 43.79% of the total catchment area are having sparse-vegetation and steep slopes, and are more prone to the soil erosion. In the Non River catchment no conservation practices are followed. The total annual rate of soil erosion in the catchment, as obtained by multiplying USLE factors, ranged variably under different land uses. The erosion from the steep and sparsely vegetated sub catchments under forest and fallows is highest in the range of 5.90-10.25 t/ha/yr. However, the agricultural land comprising of 50% of the catchment area is under the ‘slight’ class of the erosion ranging from 0.05 to 2.57t/ha/yr.
Highlights
mSoil erosion of fallow and sparse forests, where density of vegetation is very less, is varying from moderate to high. The annual rate of soil erosion in these sub catchments varies from 5.90 to10.25 t/ ha/year, and as per revised tolerance limits such areas are not safer with respect to soil erosion hazard. mThe upper reaches of the watershed are contributing the maximum soil loss, as these areas are
degraded forests with high degree of slope. The middle reaches and lower reaches of the watershed are contributing average (<1 t/ ha/yr) and moderate (1-5 t/ ha/yr) soil loss.
Keywords: Soil erosion, River catchment, USLE, Remote sensing, GIS tools
Over 80% of the world agricultural land suffers from moderate to severe erosion which includes loss of productivity. Despite numerous efforts, the agricultural soil loss is a grave concern and it is a world-wide problem. Soil degradation is a broader term for a decline in soil quality encompassing the
hectares of land which is threatening productivity and the fertility of the soil (Kumar 2004).
The state of Madhya Pradesh is endowed with a number of perennial rivers offering immense irrigation potential but simultaneously prone to soil erosion on account of its topography, soil types and rainfall patterns. Non Riveris one of the important rivers of Madhya Pradesh (M.P.) and is having the catchment of about 836 sq. km. It emanates from district Gwalior of M.P. and is a major tributary to Sindh River. The river catchment is predominantly under agricultural use. In order to conserve its soil and water resources for their sustainable use in agriculture and ecological integrity, it needs basic knowledge on land resources inventories with risk of land degradation as main criterion. The assessment of soil erosion in the Non river catchment is an attempt in the same direction. Integrated use of remote sensing and GIS can be used in soil erosion assessment studies. The input parameters required for soil erosion modeling can be generated by remote sensing. Geographical information system helps in creation of a data base for the catchment which is very much useful for carrying out spatial analysis thereby helping the decision makers in framing appropriate measures for critically affected areas. In general, remote- sensing data are primarily used to develop the cover-management factor image through land- cover classifications, while GIS tools are used for derivation of the topographic factor from DEM, drainage network and stream order (Lama et al. 2015) data interpolation of sample plots, and calculation of soil erosion loss. Simple methods such as the Universal Soil Loss Equation, modified Universal Soil Loss Equation etc. are used for estimation of surface erosion and sediment yield from catchment areas.
In the recent past, sediment yield and soil erosion studies using GIS and remote sensing technologies have been carried out by many investigators. Das et al. (2008) carried out estimation of annual soil loss from a catchment in Assam and compared with that of base year using remote sensing and satellite data. Chandramohan et al. (2002) simulated sediment yield from a catchment using GIS for lumped and distributed models using USLE model developed by Wischmaier and Smith in 1965. USLE was used to identify the erosion potential zones of Hire
Nadi catchment in Karnataka. Martin et al. (2007) obtained soil data from soil resource inventory and land and climate were derived from the remote sensing satellite data (Landsat TM, bands 1 to 7) and integrated the data in GIS environment to obtain the soil erosion loss using USLE model for watershed area. In 2012, a qualitative soil erosion model has been developed using weighted sum tool of Arc GIS, where rasters of all the factors given as input were assigned equal weightage and were later reclassified into five soil erosion classes. Remote sensing and GIS techniques have become valuable tools specially when assessing erosion at larger scales due to the amount of data needed and the greater area coverage. For this reason use of these techniques have been widely adopted and currently there are several studies that show the potential of remote sensing techniques integrated with GIS in soil erosion mapping (Pilesjo 1992; Metternicht and Fermont 1998).
MATERIALS AND METHODS
The study was carried out in Non river watershed, which is part of Sindh river basinbetween 25o 47’ 28’’ N to 26o 03’42’’ N latitude and 77o 57’ 13’’ E to 78o 21’48’’ E longitudes with geographical area of 83558 hectares. The watershed is covered in five number of Survey of India toposheets viz. 54 K/1, 54 K/5,54 J/4, 54 G/13, and 54 F/16.Non river watershed falls under dry sub humid to semi arid region. The average annual rainfall of watershed area is 764.4 mm. Rainfall through South West monsoon contributes about 90% of total rainfall whereas the rest is received from the North-East monsoon in winter. Rainfall in the region is highly erratic in nature. Most of the area of watershed is irrigated by canals. The area experiences extreme cold and hot temperature during winter and summer, respectively. Temperature in the district varies from 1o – 47o C. Geologically the study area comprises alluvial soil and silting material. Soil in the watershed is, in general, loamy in texture. This is shallow to very shallow in depth, poor in organic matter content and other plant nutrients.
India Toposheet no. 54 K/1, 54 K/5, 54 J/4, 54 G/13, and 54 F/16. on 1:50,000 scale.
Universal Soil Loss Equation
Soil erosion potential is governing by Land use, soil, slope steepness and management parameters at a particular location to the erosive power of rainfall. In this study, the data and methods for determining the each input parameters for the USLE is discussed as follows:
The USLE (Eq. 1) is the product of several factors: rainfall and runoff (R), soil erodibility (K), slope (LS), Vegetation cover (C) and finally the management practices (P). The output is the annual soil loss per unit area (A)
A = R * K * LS * C * P …(1)
Where,
A = Mean annual soil loss (in ton.ha-1.yr-1)
R = Rainfall and Runoff Erosivity Index (in MJ/ ha/mm/yr)
K = Soil Erodibility Factor (in ton/MJ/mm) LS = Slope and Length of Slope Factor C = Cropping – Management Factor P = Erosion Control Factor Practice
Rainfall erosivity factor(R)
R is the long term annual average of the product of event rainfall kinetic energy in MJ ha1 and the maximum rainfall intensity in 30 minutes in mm per hour (Wischmeier and Smith 1978; Renard and Freidmund 1994). The rainfall distribution is not homogeneous all over the study area, for this reason an interpolation of annual precipitation data was applied to have a more representative rainfall distribution. Once the interpolation is performed a map representing annual rainfall in the region is obtained. This map was the input source for the R factor calculation using the relationships were established between average annual and seasonal (June-September) rainfall with computed EI30 values for different zones. Derived relationships were as follows:
Annual relationship,
R = 81.5 + 0.38RN (340 RN 3500mm) …(2)
Seasonal relationship,
R = 71.9 + 0.361 RS (293 RS 3190mm) …(3)
Where,
R = average annual /seasonal erosion index; RN = average annual rainfall (mm) and RS = average seasonal rainfall (mm).
Finally thematic map of rainfall erosivity factor (R) was prepared in the GIS environment. For this Thiessen polygon of the study area was prepared using spatial analyst tool box of the ArcGIS 10.0. Soil erodibility factor (K): Soil erodibility (K) represents the susceptibility of soil or surface material to erosion, transportability of the sediment, and the amount and rate of runoff given a particular rainfall input, as measured under a standard condition. The standard condition is the unit plot, 72.6ft long with a 9 percent gradient, maintained in continuous fallow, tilled up and down the hillslope (Weesies 1998). K values reflect the rate of soil loss per rainfall-runoff erosivity (R) index. Wischmeier and Smith equation (1978) was used for the estimation of soil erodibility factor (K):
100K = 2.1M1.14 (10-4)(12-a) + 3.25(b-2)
+ 2.5(c-3) …(4)
Where, K = K-factor (t ha-1MJ-1 mm-1); M = texture
from the first 15 cm of soil surface = [(100-Ac). (L+ Armf)]
Where, Ac = % of clay (<0.002mm); L = % of silt (0.002-0.05mm); Armf = % of very fine sand (0.05-0.1mm); a = % of organic matter content; b = structure of soil (very fine granular; 1-2mm; fine granular; 2-5mm; med or coarse granular; 5-10 mm; blocky, platy or massive>10mm) and c = permeability (c=1, very rapid, c=2, mod to rapid, c=3, moderate, c=4, slow to mod, c=5, slow, c=6, very slow).
map units were attributed to the digitized features and raster map of K factor was prepared using Conversion tool box of Arc GIS 9.3.
Slope length factor (L) : Slope length factor (L) being the ratio of soil loss from given length of slope to that from land having 22.13 m length of slope is generally expressed as (Wischmeier and Smith 1978):
L = 22.13 m λ
…(5)
Where, λ = field slope length in meters and m = an exponent having value ranging from 0.2 to 0.5. Slope gradient factor(S) : The slope gradient factor can be expressed mathematically as (Wischmeier and Smith 1978):
S = (65.4 sin2 Ɵ + 4.56 sinƟ + 0.065) …(6)
Where, λ is the angle of slope in degree.
Combining the above two factors, the topographic factor (LS) is calculated. In present study, the LS factor was also calculated by an executable C++ Program (Khosrowpanah et al. 2007).
Crop/Cover management factor (C) : The C factor is the ratio of soil loss from an area with specified cover and management to that from an identical area in tilled continuous fallow. It measures the effect of canopy and ground cover on the hydraulics of raindrop impact and runoff. The following regression equation was used to determined ‘C’ factor:
C = 1.02 – 1.21 × NDVI
Where, NDVI (Normalized Difference Vegetation Index) = (NIR-red)/ (NIR+ red)
NIR= spectral reflectance near infrared zone of light spectrum and red = spectral reflectance in red zone of light reflectance.
Conservation/ support practice factor (P) : In this study land use/ land cover map was also used for the preparation of P factor map. The values of conservation/ support practice factor P as suggested by Dabral et al. (2008) were attributed to the land use/land cover map and raster map of the P factor was prepared by using Conservation tool box of ArcGIS 10.0.
Assessment of annual rate of soil erosion
The Soil from Non river watershed was estimated from procedure given in flow chart:
The USLE (Wischmeier and Smith, 1965) was combined with the ArcGIS 10.0 to calculate the annual average annual rate of soil loss (A) occurring in the Non-Nadi Watershed. Raster layers corresponding to each of the six USLE factor were created, stored and analyzed with the ArcGIS 10.0 This combination computes the simulated soil erosion potential for the entire watershed and areas of high soil erosion potential were identified. The USLE computation was done by multiplying all the USLE factors together. Annual rate of soil loss was estimated for each grid cell of the watershed and calculated for each sub watershed so that spatial distribution of annual rate of soil loss can be determined.
RESULTS AND DISCUSSION
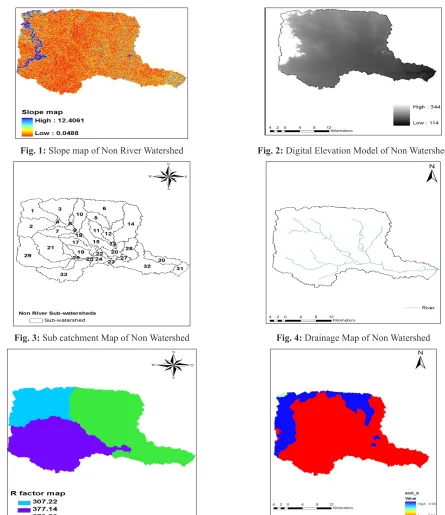
The Slope, digital elevation map, drainage map and sub-catchment maps of the watershed (delineated by ArcGIS 10.0) are presented in Fig. 2 to 4. The elevation map (Fig. 2) show a vertical fall of around 230m from highest point (344 m) to lowest point (114 m) across a watershed slope length of 44 km with a sudden drop within 10 km. It shows a high potential generated by runoff water to detach and erode the land forms and soil along its pathway and up to downstream where the gradient suddenly falls flat. Thus, the intensity of soil erosion in the high gradient micro catchments numbered 1,2,3,7,21 and 29 may be high. The drainage map of the catchment (Fig. 3) shows that the Non River is fed by many first order streams and several 2nd order streams.
USLE data
(TLSD) concept. The erosivity is varying from one geographical location to another (even under the same annual rainfall condition).. High erosivity (R) value (377 to 380) in north eastern, eastern and southern part of Non river catchment is suggestive of high amount of precipitation and kinetic energy of rain in these areas in comparison to northwest part of catchment (R = 307).
Soil Erodibility factor (K): Being an inherent character of a particular soil, K factor is a quantitative measure of soil particles to detachment and transport by rainfall and runoff. The K factor (Table 1 and Fig. 6) shows that different soils along the toposequence in the Non river catchment erode at different rates where as the other factors that affects erosion remains the same. In the catchment the K values Fig. 1: Slope map of Non River Watershed Fig. 2: Digital Elevation Model of Non Watershed
Fig. 3: Sub catchment Map of Non Watershed Fig. 4: Drainage Map of Non Watershed
varies from 0.04 to 0.08 with 72% of the area under 0.04 (low) value of K; which indicate that major part of soils in the catchment are resistant to detachment.
Table 1: Area of each soil class, percent of watershed area and K factor
Sl.
No. Soil type Area (kmSoil class 2)
% of total watershed
area
K factor
1 Clayey soil 60,300 72.16 0.04
2 Loamy
skeletal soil 358 0.42 0.06
3 Loamy soil 22900 27.40 0.08
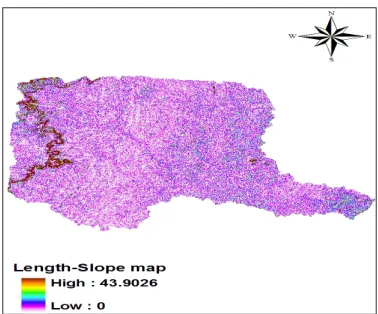
Topographic factor (LS): The raster data created for the LS factor (Fig. 7) shows that LS factor is higher in southern part of Non river catchment due to effect of steep slope in the area. This area is under micro catchments numbered 1,2, 3, 7,21, and 29. In rest of the micro catchments of the river, the LS factor varies from low to medium. The areas having high LS factor and degraded forest/ grasslands need immediate attention from soil conservation point of view, according to experts (Moore & burchi 1986; Kinnel 2008; Zhang et al. 2013; Lui et al. 2015). The extraction of LS factor is a key issue in application of RUSLE models (Oliviera et al.
2013). This is because LS factor is most sensitive parameter of USLE in the soil loss predictions (Tetzlaff & Wend land 2012).
Crop/cover management factor: The resultant
effect of soil disturbing activities, plants, crop-sequences, soil cover and below ground
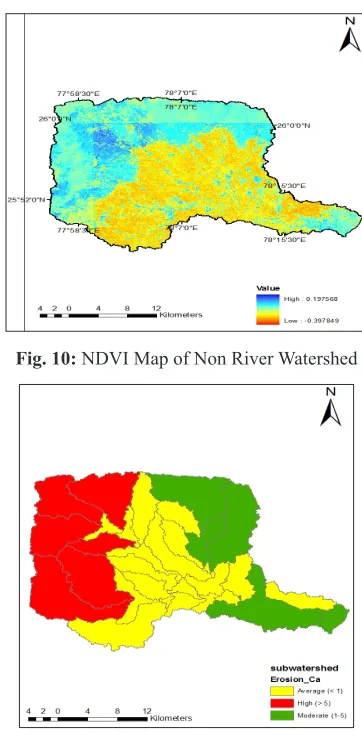
biomass, on soil erosion are represented by the C factor (Jones et al. 1996). The land use land cover map of Non river catchment (Fig. 8) represent the type of cover and apprise of the activities generally associated with the particular land use (Table 2). Majority of the area (91%) of the catchment is under agriculture, forest and fallow land, with low C values of 0.25, 0.004 and 0.18, respectively. The distribution of various land user comprise of forest (10.6%), waste land (1.77%), habitation settlement (1.12%), water bodies (1.21%), agriculture (50%) and fallow land (30.3%). However, the C values for ravine and habitation area (3%) are highest with the value of 1, suggestive of more erosion risk from these land uses NDVI map (Fig. 9) and C factor map (Fig. 10) as derived from satellite imageries corroborate the figures of land use and land cover.
Table 2: Conservation/ support practice factor (P) for different
Sl. No Land use class P factor
1 Forest 0.9
2 Ravine/Waste land 0.2
3 Habitation 00
4 Water body 00
5 Agriculture 0.35
6 Fallow land 0.2
Conservation/ support practices factor (P): Support practices such as contour farming, terracing, strip cropping, stone walls, grass barriers etc, which are considered to retard the soil erosion are taken into account for
estimation of P factor. Even the minimum tillage or no tillage which are effective in reducing soil erosion by water (Nyakatawa et al. 2001) are evaluated under P factor. In the Non river catchment under study no major conservation practices are followed and P factor (Fig. 11 & Table 3) are computed accordingly.
Table 3: Land use/ land cover statistic of the non watershed
Sl. No. Land use/land cover
class Area in ha Per cent Area
1 Forest 8910 10.6
2 Wasteland 1369 1.77
3 Habitation/settlement 936 1.12
4 Water boides 1013 1.21
5 Agriculture 41814 50
6 Fallow land 29973 30.3
Total 83558
Assessment of annual rate of soil erosion
Once all erosive factors were calculated, they were introduced into the USLE using “ArcMap / Spatial Analyst / Raster Calculator”, therefore erosion risk map was obtained (Fig. 12). The annual erosion loss values under different catchments are also given in Table 4, showing the predominant land use and severity of erosion simultaneously. The combination computed the simulated soil erosion potential for the entire watershed too. The erosion rates were classified into ‘slight’, ‘moderate’, and ‘high’ classes as per guidelines adopted by Pandey et al. (2007) for Indian conditions. The results show that the soil erosion of fallow and sparse forests, where density of vegetation is very less, is varying from moderate to high. The sub catchments numbered 1,2,3,7,21 and 29 falls under this category. The annual rate of soil erosion in these 6 sub catchments varies from 5.90 to 10.25 t/ha/year, and as per revised tolerance limits Fig. 9: Land use and Land cover Map of Non Watershed Fig. 10: NDVI Map of Non River Watershed
Fig. 11: Conservation/support practice factor (P) map of Non
such areas are not safer with respect to soil erosion hazard (Lakaria et al. 2010). It may also be due to steep slope (LS) high erodibility (K) values, high C and P values in the respective sub catchments. The inference is supported by various maps of USLE factors, given in previous pages. However, the parts of catchment under agricultural land use with good crop and gentle slope are contributing less soil erosion. Agriculture is predominant land use of the Non river catchment and 27 sub-catchments out of total 33 are under this land use. Agricultural land is contributing soil erosion in the range of 0.16 to 2.64 t/ha/ yr. The study revealed that the maximum annual soil loss from Non river catchment was 10.25 t/ ha/yr.
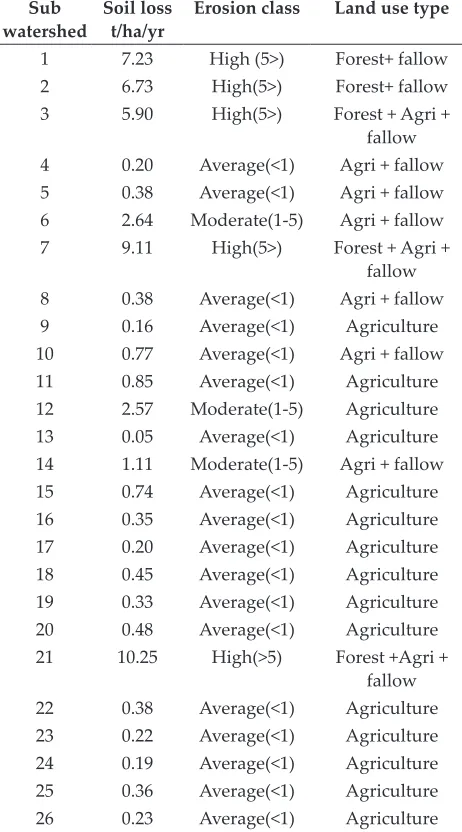
Table 4: Erosion from the each sub- watershed of Non-nadi watershed
Sub
watershed Soil loss t/ha/yr Erosion class Land use type 1 7.23 High (5>) Forest+ fallow
2 6.73 High(5>) Forest+ fallow
3 5.90 High(5>) Forest + Agri + fallow 4 0.20 Average(<1) Agri + fallow 5 0.38 Average(<1) Agri + fallow 6 2.64 Moderate(1-5) Agri + fallow 7 9.11 High(5>) Forest + Agri +
fallow 8 0.38 Average(<1) Agri + fallow 9 0.16 Average(<1) Agriculture
10 0.77 Average(<1) Agri + fallow 11 0.85 Average(<1) Agriculture
12 2.57 Moderate(1-5) Agriculture
13 0.05 Average(<1) Agriculture
14 1.11 Moderate(1-5) Agri + fallow 15 0.74 Average(<1) Agriculture
16 0.35 Average(<1) Agriculture
17 0.20 Average(<1) Agriculture
18 0.45 Average(<1) Agriculture
19 0.33 Average(<1) Agriculture
20 0.48 Average(<1) Agriculture
21 10.25 High(>5) Forest +Agri + fallow 22 0.38 Average(<1) Agriculture
23 0.22 Average(<1) Agriculture
24 0.19 Average(<1) Agriculture
25 0.36 Average(<1) Agriculture
26 0.23 Average(<1) Agriculture
27 0.39 Average(<1) Agriculture
28 0.29 Average(<1) Agriculture
29 9.77 High(>5) Forest + Agri+ fallow 30 0.66 Average(<1) Wasteland +Agri+
fallow 31 2.08 Moderate(1-5) Agriculture+ fallow 32 1.02 Moderate(<1-5) Wasteland+ Agri+
fallow 33 0.33 Average(<1) Agriculture
CONCLUSION
The soil erosion risk assessment can be helpful for land evaluation in regions where soil erosion is the main threat for sustained agriculture, as soil is the basis of agricultural production. Various erosion models are used to predict the rates of soil erosion. Most of these models need information related with soil type, land use, climate and topography to estimate soil loss. With the advent of remote sensing and GIS technology, deriving the spatial information on input parameters has become more handy and cost-effective. The highest annual rate of soil erosion from the Non-nadi watershed was estimated to be 10.25 t/ ha/yr. The upper reaches of the watershed are contributing the maximum soil loss, as these areas are degraded forests with high degree of slope. The middle reaches and lower reaches of the watershed are contributing average (<1 t/ ha/yr) and moderate (1-5 t/ ha/yr) soil loss. The soil loss from different land use combination was calculated. Forest + agriculture + fallow contributed maximum soil loss of 5.90-10.25 t/ha/yr followed by forest + fallow (6.73-7.25 t/ha/yr), while minimum soil loss was found from the agriculture and agriculture + fallow, in the range of 0.05-2.57t/ha/yr.
REFERENCES
Chandramohan, T. and Durbude, D. 2002. Estimation of soil erosion potential using USLE. Journal of the Indian Society of Remote Sensing, 30(4): 181-190.
Dabral, P.P., Baithuri N. and Pandey A. 2008. Soil erosion assessment in a hilly catchment of North Eastern India using USLE, GIS and remote sensing. Water Resources Management,22: 1783-1798.
Das, B., Singal, S.K. and Singh, R. 2008. Estimation of soil erosion in a ungauged wetland catchment, Hydrology Journal, 31: 65-76.
Khosrowpanah, S., Heitz, L.F., Wen, Y. and Park, M. 2007. Developing a GIS-based soil erosion potential model of the Ugum watershed. Water & Environmental Research Institute, Western Pacific UOG Station, Guam, Technical Report No.117.
Kumar, P. 2004. Economics of Soil Erosion. Issues and Imperatives from India, Ashok Kumar Mittal Concept Publishing Company, New Delhi, India.
Lakaria, B.L., Mandal, D. and Biswas, H. 2010. Permissible limits under different landscapes of Chhattisgarh. Indian Journal of Soil Conservation,3(3): 148-154.
Lama, T.D., Singh, R.K., Saikia, U.S. and Satapathy, K.K. 2015. Geomorphometric analysis of a hilly watershed in north east India. International Journal of Agriculture, Environment and Biotechnology, 8(1): 29-36.
Lui, K., Tang, G., Jiang, L., Zhu, A.X., Yang, J. and Song, X. 2015. Regional-scale calculation of the LS factor using parallel processing. Computers & Geosciences, 78: 110–122. Martin, D. and Saha, S.K. 2007. Integrated approach of using
remote sensing and GIS to study watershed prioritization and productivity, Journal of the Indian Society of Remote Sensing,35(1): 21-30.
Metternicht, G.I. and Fermont, A. 1998. Estimating erosion surface features by linear mixture modeling. Remote Sensing of Environment,64(3): 254-265.
Moore, I.D. and Burch, G.J. 1986. Physical basis of the lengthslope factor in the Universal Soil Loss Equation. Soil Science Society of America Journal,50: 1294–1298.
NBSSLUP. 1996. Soils of Madhya Pradesh for optimizing land se. Publication, 50 (b).
Nyakatawa, E.Z., Reddy, K.C. and Lemunyon, V.L. 2001. Predicting soil erosion in conservation tillage cotton production system using the revised universal soil loss equation (RUSLE) soil tillage Res.,57(4): 213-224.
Pandey, A., Chowdary, V.M. and Mai, B.C. 2007. Identification of critical erosion prone areas in the small agricultural watershed using USLE, GIS and remote sensing. Water Resource Management, 21: 729- 746.
Pilesjo, P. 1992. GIS and Remote Sensing for soil erosion studies in semi-arid environments. PhD thesis: Meddelanden fran Lunds Universitets Geografiska, Sweden, pp. 203. Renard, K.G. and Freidmund, J.R. 1994. Using monthly
precipitation data to estimate the R factor in the RUSLE. Journal of Hydrology,157: 287–306.
Tetzlaff, B. and Wendland, F. 2012. Modelling sediment input to surface waters for German states with MEPhos: Methodology, sensitivity and uncertainty. Water Resources Management,26: 165–184.
Weesies, G.A. 1998. Predicting soil erosion by water: A guide to conservation planning with the Revised Universal Soil Loss Equation (RUSLE). Agriculture Handbook No. 703. Washington, District of Columbia, USA.
Wischmeier, W.H. and Smith, D.D. 1965. Predicting rainfall – erosion losses from cropland east of Rocky Mountain: guide for selection of practices for soil and water conservation, U.S. Department of Agriculture, Agricultural Handbook, p. 282.
Wischmeier, W.H. and Smith, D.D. 1978. Predicting rainfall- erosion losses – a guide to conservation planning. A.H.-537, U.S. Department of Agriculture, Washington (D.C.) Zhang, H., Yang, Q., Li, R., Liu, Q., Moore, D., He, P., Ritsema,