RESEARCH
Microbial community dynamics
in replicate anaerobic digesters exposed
sequentially to increasing organic loading rate,
acidosis, and process recovery
Xavier Goux
1,2,3, Magdalena Calusinska
1, Sébastien Lemaigre
1, Martyna Marynowska
1, Michael Klocke
4,
Thomas Udelhoven
5, Emile Benizri
2,3and Philippe Delfosse
1*Abstract
Background: Volatile fatty acid intoxication (acidosis), a common process failure recorded in anaerobic reactors, leads to drastic losses in methane production. Unfortunately, little is known about the microbial mechanisms under-lining acidosis and the potential to recover the process. In this study, triplicate mesophilic anaerobic reactors of 100 L were exposed to acidosis resulting from an excessive feeding with sugar beet pulp and were compared to a steady-state reactor.
Results: Stable operational conditions at the beginning of the experiment initially led to similar microbial popula-tions in the four reactors, as revealed by 16S rRNA gene T-RFLP and high-throughput amplicon sequencing. Bacteroi-detes and Firmicutes were the two dominant phyla, and although they were represented by a high number of opera-tional taxonomic units, only a few were dominant. Once the environment became deterministic (selective pressure from an increased substrate feeding), microbial populations started to diverge between the overfed reactors. Interest-ingly, most of bacteria and archaea showed redundant functional adaptation to the changing environmental condi-tions. However, the dominant Bacteroidales were resistant to high volatile fatty acids content and low pH. The severe acidosis did not eradicate archaea and a clear shift in archaeal populations from acetotrophic to hydrogenotrophic methanogenesis occurred in the overfed reactors. After 11 days of severe acidosis (pH 5.2 ± 0.4), the process was quickly recovered (restoration of the biogas production with methane content above 50 %) in the overfed reactors, by adjusting the pH to around 7 using NaOH and NaHCO3.
Conclusions: In this study we show that once the replicate reactors are confronted with sub-optimal conditions, their microbial populations start to evolve differentially. Furthermore the alterations of commonly used microbial parameters to monitor the process, such as richness, evenness and diversity indices were unsuccessful to predict the process failure. At the same time, we tentatively propose the replacement of the dominant Methanosaeta sp. in this case by Methanoculleus sp., to be a potential warning indicator of acidosis.
Keywords: Anaerobic digestion, Volatile fatty acids intoxication, Process recovery, 16S rRNA gene-based T-RFLP, High-throughput 16S rRNA amplicon sequencing, Microbial ecology
© 2015 Goux et al. This article is distributed under the terms of the Creative Commons Attribution 4.0 International License (http://creativecommons.org/licenses/by/4.0/), which permits unrestricted use, distribution, and reproduction in any medium, provided you give appropriate credit to the original author(s) and the source, provide a link to the Creative Commons license, and indicate if changes were made. The Creative Commons Public Domain Dedication waiver (http://creativecommons.org/ publicdomain/zero/1.0/) applies to the data made available in this article, unless otherwise stated.
Open Access
*Correspondence: [email protected]
1 Environmental Research and Innovation (ERIN) Department,
Luxembourg Institute of Science and Technology (LIST), 41 rue du Brill, 4422 Belvaux, Luxembourg
Background
Anaerobic digestion (AD and syn. biomethanation) of biomass, including wastewater, agro-food residues, municipal solid waste, and energy crops, is not only regarded as a promising source of renewable energy, but also generates environmental benefits, e.g. reduction of greenhouse gas emissions, manure odour and pathogens [1, 2] and contributes to the recovery of essential nutri-ents (N, P, and K). The main products of the AD process are the biogas and the digestion residue. Biogas is com-posed of methane (CH4), carbon dioxide (CO2) and trace gases such as H2S, NH3 and H2, and it can be combusted in combined heat and power units (CHP) to provide elec-tricity and heat. Alternatively, by eliminating CO2 and trace gases, methane can be upgraded to reach the natu-ral gas quality and be injected into the gas grid or used as transport fuel. Digestion residue being rich in nutrients is gaining reputation as a fertilizer in agriculture [3].
The AD process is conducted by different microbial groups interacting to decompose the organic matter into minerals and simple molecules. During the first stage called hydrolysis, facultative or obligatory anaerobic fermenting microorganisms decompose proteins, fats and polysaccharides into soluble compounds (i.e. amino acids, long-chain fatty acids and sugars). In continuation, during the acidogenic stage, acidogenic bacteria convert these by-products into volatile fatty acids (VFAs), CO2, H2, and alcohols. Furthermore, VFAs, CO2 and H2 are transformed by acetogenic microorganisms to produce acetate (acetogenesis stage). Finally during the methano-genesis stage, acetate and H2, CO2 are used, respectively, by the acetotrophic (syn. acetoclastic) and hydrogeno-trophic methanogenic archaea to produce methane [4]. Even though the major paths of the AD process are well described, the complexity of the microbial activities, competition, and syntrophism are not well understood [5, 6]. Importantly, the performance of an AD reactor is closely linked to the structure and dynamics of its micro-bial community (microbiome) [7]. Consequently, the importance of understanding the AD microbiome and the need of establishing microbial indicators of process performance are currently considered as key research subjects towards the improvement of the biomethanation process and the understanding of the process imbalance [6].
Acidification of anaerobic reactors (acidosis) results from an accumulation of VFAs due to an overload of the feeding substrate or the use of a rapidly degradable sub-strate and sometimes due to the temperature drop [8, 9]. VFAs accumulation directly reflects the kinetic imbal-ance between their production by fermentative and aci-dogenic bacteria and their consumption by a combined effort of acetogenic bacteria and methanogenic archaea
[10]. Acidosis is the most common process failure tak-ing place in many AD reactors [9, 11] and for which the biogas unit owners seek advice and recommendation on how to quickly and efficiently recover the process (per-sonal interactions with the biogas plants owners in the Greater Region including Luxembourg, and partially Bel-gium, France and Germany). In general, acidosis is not easy to prevent [12], and high VFAs concentration in the reactors do not necessarily result in pH decrease [13]. However, due to their high sensibility to the increased VFAs concentrations and pH changes, archaeal com-munities in AD reactors facing acidification are quickly inhibited, leading to a decreased methane production [14]. As a consequence, acidosis represents an impor-tant loss for the biogas plants both in terms of reduced methane production and an acidic digestion residue, which do not meet the requirements for optimal fertiliza-tion anymore [15, 16]. For these reasons, it is important on the one hand to efficiently predict and prevent acido-sis and on the other hand, to quickly restart the process once the acidosis takes place [17]. Indeed, a poor biogas quality (low CH4 content) usually results in stopping the CHP unit with heat no longer being provided to the AD reactor, thus further worsening the process status of the plant. While recent studies have brought more evidence about the changes in microbial communities during the process perturbation related to VFAs accumulation [9, 13, 18, 19], little is known about the individual sensitiv-ity of the reactors and the capabilsensitiv-ity of the process to recover when the pH is brought back to neutrality.
with the dominant microbes and the state of the AD process.
Results and discussion
Operational parameters and anaerobic process performance
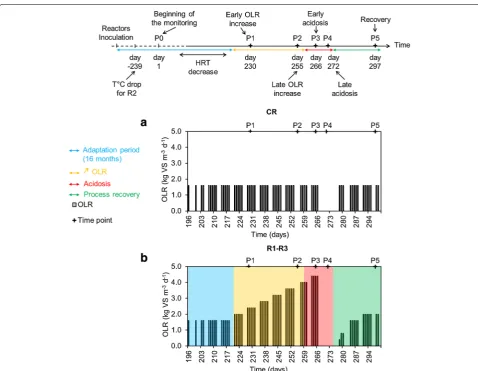
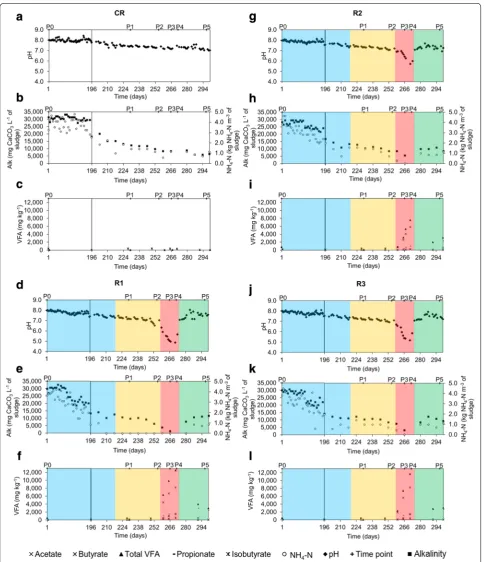
The reactors were previously acclimated for 16 months to adapt to a mono-substrate, sugar beet pulp, and to reach a steady-state with a final hydraulic retention time (HRT) of 28.5 days (Fig. 1). CR was constantly and cautiously fed with an OLR of 1.60 kg m−3 day−1 of sugar beet pulp, assuring a steady-state process with sludge parameters in the range of pH 7.1–7.6, alkalinity of 8824.9 ± 2.5 mg CaCO3 L−1 of sludge, NH4–N under 1.5 kg NH4–N m−3 (Fig. 2a–c) and the TS and VS contents fluctuating between 1.9–2.4 % and 60–67 %, respectively. For the
70 % ± 6, 11 % ± 1 and 3 % ± 1 of total VFAs, respec-tively. Even though a propionate/acetate ratio above 1.4 is considered as one of the most appropriate indicators of process imbalance [20], for the three overfed reac-tors it did not exceed 0.17 ± 0.0, what could prevent the right diagnosis of the reactor state if only relying on VFAs measurement. Indeed, different authors previously reported that different reactors have their specific VFAs levels to serve as process indicator, and the conditions that are considered stable for one reactor may not be optimal for another [13, 21, 22].
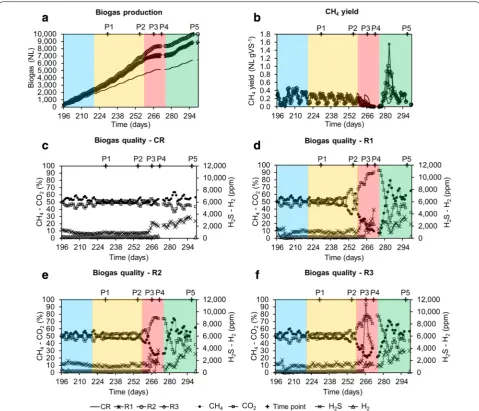
Significant differences in biogas production and com-position were also observed during the late acidosis phase (Fig. 3), with methane constituting roughly 9, 25, and 32 % of the biogas for R1, R2 and R3, respectively, while it equalled a minimum of 55 % for CR. Moreover, peeks of increased H2 production (>2000 ppm) were detected for R1–R3 indicating a decoupling between the H2-producing and H2-consuming bacteria (Fig. 3d–f).
Following the acidosis, a process recovery (restora-tion of biogas produc(restora-tion with average methane con-tent above 50 %; P5) was promoted by an artificial pH
Fig. 3 Progress of the biogas production and composition over time for the four reactors. Biogas production for the four reactors (in NL) (a); CH4 yield for the four reactors (in NL g VS−1) (b); biogas quality (CH
increase, what led to a decrease of total VFAs to a level of 4000 mg kg−1 for R1, 2000 mg kg−1 for R2 and 2800 mg kg−1 for R3 at the sampling period P5 (Fig. 2f, i, l). A significant increase in methane content in the biogas was correlated with acetate consumption, what could indicate the re-activation of acetoclastic methanogen-esis. However, at the same time propionate was the most dominant VFA (75 and 90 % of total VFAs for R1 and R2–R3, respectively) and the propionate/acetate ratio was above 12.5 ± 6.4 during the recovery stage. Incapac-ity to quickly re-consume propionate might point to the fact that acetogenic bacteria were the one most affected by the experimental conditions examined in this study. Moreover, syntrophic propionate degradation is a ther-modynamically very unfavourable reaction (ΔG0′ equals +72 kJ mol−1), that occurs only when an optimized bal-ance (pH2 below 10−5 atm) between H2-producing (ace-togens) and H2-consuming (mostly hydrogenotrophic methanogens and homoacetogens) microbes exists [23].
Comparison of the 16S rRNA gene‑based T‑RFLP and high‑throughput 16S rRNA amplicon sequencing results
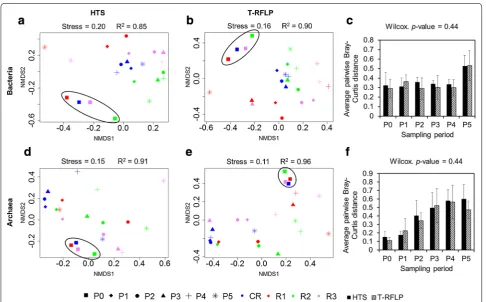
Microbial communities were evaluated in the four stud-ied reactors by means of 16S rRNA gene-based T-RFLP and high-throughput amplicon sequencing (Figs. 4, 5). It is well known that while the T-RFLP allows for the detec-tion and semi-quantificadetec-tion of only the most abundant species in a sample [24–26], taxon-specific resolution of the HTS is much higher [27]. Therefore, knowing this limitation, we were not surprised that the calculated spe-cies richness based on the T-RFLP results was relatively lower compared to the amplicon sequencing (Additional file 1: Table S1). Also the total terminal restriction frag-ments (T-RF) diversity was only around 50 % of that resulting from the HTS. Similar discrepancies between the two molecular approaches were previously observed for AD reactors [27] as well as other studied environ-ments, e.g. human anterior nares [28]. Additionally these differences can result from the use of different primers pairs for T-RFLP and HTS [29]. Due to the length limi-tation of the HTS technology, longer amplicons required for T-RFLP were too large for HTS. However, the cal-culated average pairwise Bray–Curtis distances reflect-ing the dissimilarities in community structures between the four reactors at the different sampling points were not significantly different between T-RFLP and HTS results (Fig. 6c, f). This observation suggests that both techniques accurately characterized the species dynam-ics over time in the four reactors, even though HTS was superior to T-RFLP regarding its sensitivity to detect minority species and the direct taxonomic affiliation of
resulting sequencing reads. Interestingly, based on the HTS results, the ten most abundant bacterial opera-tional taxonomic units (OTUs) at the sampling period P0 accounted for an average of 52.0 % ± 7.9 of the popula-tion in the studied reactors. At the same time the average bacterial richness calculated based on the T-RFLP was 8.7 ± 1.3, suggesting that indeed the T-RFLP approach could be sufficient to characterise at least the dominant part of the bacterial community in the reactor. Neverthe-less, the attempts to in silico taxonomically assign the obtained T-RFs failed to provide unequivocal results due to a difference of a few base pairs. This discrepancy is often found between T-RFs predicted in silico and T-RFs measured in vivo [27, 30]. It usually results from the pres-ence of unknown species in analysed environmental sam-ples, thus the adequate 16S rRNA gene sequences lack in required databases used to assign in silico the generated T-RFLP results.
Microbial communities in replicate reactors in steady state
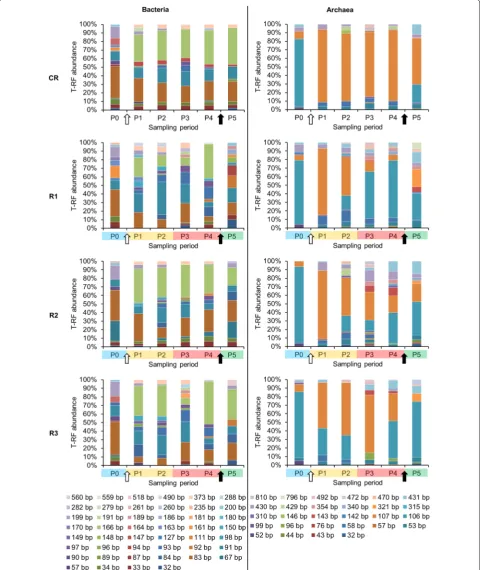
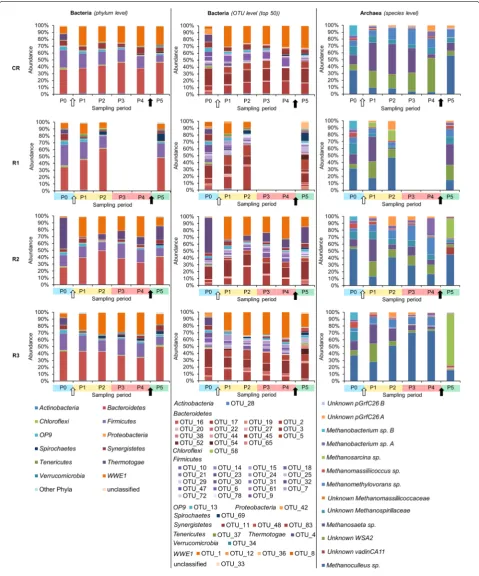
At P0, on average, 22.8 % ± 5.7 and 63.3 % ± 13.8 of bac-terial and below 1.0 % ± 0.0 and 19.6 % ± 3.3 of archaeal 16S rRNA amplicon reads could not be classified at the family and genus levels, respectively, confirming that largely bacterial and to a lesser extent archaeal communi-ties in AD reactors remain uncharacterized. Both at the OTUs and T-RFs levels, bacterial and archaeal commu-nities from replicate reactors (except for R2) clustered together at P0 based on non-metric multidimensional scaling (NMDS) analyses (Fig. 6). This indicates that sta-ble operational conditions during the acclimation period led to similar microbial population in replicate AD reac-tors. In general, archaeal communities were much less diverse than bacterial ones (Additional file 1: Table S1), with Methanomicrobiaceae, Methanobacteriaceae and
Methanosaetaceae being the dominant families at P0. Bacterial communities were dominated by representa-tives of the phyla Bacteroidetes, Firmicutes and candidate phylum WWE1 (Fig. 5) with, respectively, Porphyromon-adaceae, Lachnospiraceae and Cloacamonaceaea being the dominant families. The prevalence of Bacteroidetes
dominated by Methanoculleus sp. (over 50 % of all 16S rRNA reads) and to a lesser extent by Methanosaetasp.
and unknown Methanospirillaceae (Fig. 5).
Towards the end of the acclimation period, the HRT was gradually decreased in the four CSTRs, from more than 300 days at P0 to 28.5 days at P1 (data not shown), what influenced the shift of microbial diversity between the two sampling periods studied (Figs. 4, 5). While, at day 221 the OLR started to be gradually increased for the test reactors, it remained unchanged for CR, what resulted in a relatively stable bacterial community between P1 and P5 for this control reactor (Figs. 4, 5). The six prevalent bacterial T-RFs (T-RFs 33, 83, 91, 147, 166 and 373 bp), with high relative abundance at P1, were also detected for the other sampling points (Fig. 4). Similarly, the archaeal community remained stable in CR between the sampling periods P1 and P4, with the T-RF 107 bp representing more than 80 % of the total T-RF abundance (Fig. 4). At P5, its abundance decreased and another T-RF 106 bp started to emerge. By correlating 16S rRNA gene-based T-RFLP and 16S rRNA ampli-con sequencing results, we could relate T-RF 107 bp to
Methanosaeta sp., and T-RF 106 bp to Methanoculleus
sp. The apparent redirection from acetoclastic towards hydrogenotrophic methanogenesis, as could be con-cluded based on the increased abundance of Metha-noculleus sp. at P5, is most probably attributable to the depleting source of acetate (Fig. 2c), what is a direct con-sequence of the 11-day-long starving regime applied to CR (corresponds to the late acidosis and partially to the recovery period applied to R1–R3).
Comparison of bacterial composition in replicate reactors exposed to increasing OLR and acidosis
redundant, since all reactors operated stably and showed similar global characteristics (Figs. 2, 3). Similarly to CR, the three dominant phyla, namely Bacteroidetes, Firmi-cutes and candidate phylum WWE1 also dominated in R2–R3 (Fig. 5). No data for R1 could be recorded dur-ing the acidosis phase due to poor quality of extracted DNA for these sampling periods (harsh acidic environ-ment). While in total, 441 OTUs were characterized for bacteria, roughly 50 top OTUs represented on average 88.1 % ± 4.4 of the whole bacterial populations in the studied reactors, and they were assigned to 12 different phyla (Fig. 5). Top 10 OTUs accounted for 70.8 % ± 14.9 of all sequenced 16S rRNA reads for the sampling periods P1–P5 for the four reactors, with the dominant repre-senting the candidate phylum WWE1 (OTU_1), Bacteroi-detes (OTU_2, 3 and 5), Firmicutes (OTU_6, 7 and 18), the candidate phylum OP9 (OTU_13) and Synergistetes
(OTU_11). Thermotogae (OTU_4) was also dominant in case of R2.
In general, the diversity of Firmicutes with a total of 231 different OTUs (223 assigned to Clostridia) was much higher than Bacteroidetes with only 59 OTUs. While the dominant Bacteroidetes OTUs (they accounted for an average of 31.6 % ± 8.8 of the total bacterial 16S rRNA reads for R1–R3) appeared resistant to the increasing OLR and acidosis, Firmicutes (on average they accounted for 6.1 % ± 3.6 of total 16S rRNA reads for R1–R3) were much more sensitive (Additional file 2: Table S2). Several dominant Firmicutes OTUs disappeared (e.g. OTU_7, 15 and 32 unclassified bacteria of the order MBA08, OTU_14, an unclassified bacterium of the order SHA
-98), and other completely new OTUs appeared during the acidosis. These new OTUs, e.g. OTU_18, 31, 78, 101 and 103, were classified as Clostridiales, including fami-lies of Ruminococcaceae and Lachnospiraceae (Additional file 2: Table S2). Whether this functional redundancy of Firmicutes explains their much higher diversity than
Bacteroidetes is not clear at this stage and needs further investigation. Interestingly, it is well recognized that more diverse microbial communities provide a wider range of parallel pathways, what in principle should ensure their overall functional stability when confronted with an environmental stress [6]. That is why, diversity index is often proposed as a warning indicator of a pro-cess performance (see below). However, the fact that our reactors were dominated by a few resistant Bacteroidetes
OTUs, suggests that each of these microbes must have a suite of parallel pathways encoded on its genome to allow to quickly adapt to the changing environment. Therefore, further metagenomic studies should show whether these yet uncharacterized Bacteroidetes are indeed broad-spec-ificity bacteria.
The remaining phyla detected in our test reactors were much less diverse, with a candidate phylum WWE1
being represented by five OTUs and Thermotogae by two OTUs only. The most abundant OTU_1, in terms of total 16S rRNA reads, was assigned to the candidate phylum
WWE1 and constituted a fourth part of the whole bac-terial community in R2 and R3 between P1 and P4 (on average 27.6 % ± 3.9), and it only decreased during the recovery stage (13.6 % ± 1.5). For the test reactor R1 its abundance varied depending on the experimental stage. Interestingly, this OTU was below the detection limit for all reactors at the beginning of the experiment (P0). Candidatus Cloacimonas belonging to candidate division
WWE1 was previously shown to be the most dominant genus in an AD reactor co-digesting fish waste and cow manure [32]. The reconstructed genome of a representa-tive bacterium from the same division suggested that it could be a hydrogen-producing syntroph [33]. Addition-ally, the involvement of the WWE1 candidate bacteria to the fermentation of sugars was further confirmed by a high-resolution nanometer-scale secondary ion mass spectrometry (nano SIMS) [34]. With regards to Ther-motogae, members of this phylum have been previously detected in mesophilic anaerobic reactors [35] and their presence could not be clearly linked to process param-eters such as HRT or OLR [36]. Surprisingly, the high abundance of OTU_4 (Thermotogae) in R2 coincided with the higher pH reached by this reactor compared to the other test reactors during the late acidosis (P4, pH 5.7, Fig. 2g). Moreover, members of Thermotogae have been characterized for complex polysaccharide fermenta-tion and hydrogen producfermenta-tion [37], what might promote beneficial associations with hydrogenotrophic methano-gens [38].
Bacterial richness, diversity and evenness
these indices either increased (T-RFLP) or remained unchanged (HTS). Interestingly, while in general R2 was characterized by a lower species richness and diversity during the acidosis period than R3 (no HTS data for R1; Additional file 1: Table S1), it maintained the highest pH at P4 (5.7 vs 4.9 and 5.2 for R1 and R3), and produced significantly more biogas than R1 and R3, with the most favourable CH4/CO2 ratio (Figs. 2, 3).
While the use of richness and diversity parameters has still to be carefully considered, a decrease of evenness in structure of microbial diversity has been shown to be a good candidate warning indicator of process perturba-tion [43, 44]. Nevertheless, in our study the differences in the calculated evenness, based on the Pielou index (Additional file 1: Table S1), for R1–R3 and measured at the different sampling periods, did not show any uniform patterns, based on both T-RFLP and HTS results, sug-gesting that this index should also be carefully interpreted when used as a warning indicator. The overall functional redundancy of microbial communities demonstrated for our replicate overfed reactors, and the absence of uni-form patterns in terms of the microbial ecology param-eters raise the question whether the conclusions of the studies where only a single reactor was investigated (no replicates) are meaningful. Indeed, similarly to our obser-vations, recent studies of parallel reactors treating beet silage [36] and co-digesting fish waste and cow manure [32], showed as well that distinct reactors can establish different microbial communities.
Adaptation of archaeal population to acidosis and correlation with reactor’s parameters
Following the accumulation of VFAs and the resulting decrease of pH, and in contrast to another report [45], the richness and the diversity of the archaeal commu-nity were in general higher during the acidosis (P3 and P4) than at the beginning of the overfeeding campaign (P1) for the test reactors. The calculated evenness (Pielou index) for the archaeal population showed a trend simi-lar to the bacterial community (Additional file 1: Table S1), providing no evidence that a lower evenness could be associated with a process imbalance. In continuation a canonical correspondence analysis (CCA) was used to highlight the influence of the changing process param-eters on the archaeal community (CCA performed for bacteria was not statistically significant most probably due to the differential answer of the different commu-nities that established in replicate reactors; p value of the Monte Carlo test was >0.05; therefore, these results are not discussed here). As shown in Fig. 7, 65 % of the total species variance could be explained by the first two axes of the CCA ordination diplot. While pH showed a strong positive correlation with the alkalinity (r = 0.94,
p value <0.001) and a negative correlation with the VS content (r = −0.89, p value <0.001), it was uncorrelated with the total biogas production (p value = 0.34). This may be explained by the fact that total biogas produc-tion was not strongly reduced during acidosis, due to the increased production of CO2 and most probably H2 (its correct concentration could not properly be measured due sensor saturation; Fig. 3) by hydrolytic and acido-genic bacteria. This is well reflected by a strong negative correlation between pH and CO2 content in the biogas (r = −0.80, p value <0.001). At the same time, pH also showed a strong positive correlation with the methane content in the biogas (r = 0.80, p value <0.001), which was significantly reduced during the acidosis (Fig. 3d–f). Interestingly, higher biogas production was also corre-lated with the abundance of Methanosaeta sp. (r = 0.48, p
value <0.05). Moreover, the presence of Methanosaeta sp. was negatively correlated with the total VFAs content in the reactors (r = −0.72, p value <0.001) and with the level of abundance of Methanoculleus sp. (r = −0.49, p value < 0.05). Indeed, in the overfed reactors R1–R3, the relative
abundance of T-RFs 107 bp, assigned to Methanosaeta
sp., was dominant at the beginning of the OLR increase (P1), then decreased toward acidosis and was replaced by T-RFs 106 pb, related to Methanoculleus sp. (Figs. 4, 5). This suggests an overall redundancy of the archaeal population in sub-optimal conditions. Similarly, a low pH and high VFAs-determined transition from an acetoclas-tic (Methanosaeta sp.-dominated) toward a hydrogeno-trophic (Methanoculleus sp.-dominated) methanogenesis has been previously reported for an anaerobic membrane bioreactor treating swine manure and exposed to high shear condition [46], and for a hybrid anaerobic reactor exposed to the changing OLR [45]. Even though, in the absence of Methanosaetaceae, syntrophic acetate oxida-tion (SAO) and hydrogenotrophic methanogenesis were proposed to be the dominant methane-producing path-ways from acetate [47], we did not detect any of a few known SAO bacteria in our test reactors [44] (Additional file 2: Table S2). This might indicate either the presence of previously unknown SAO bacteria, which could be expected regarding a relatively high number of taxo-nomically unassigned 16S rRNA sequences generated in this study, or the existence of new metabolic pathways leading to VFAs conversion and a subsequent methane production.
Methanosaeta sp. is regarded as a redundant archaeon and a decrease in its population, or more generally a dis-turbance of a stable archaeal population has been pro-posed as an early warning indicator of process failure [6]. Here, by correlating the 16S rRNA amplicon sequencing with the changes observed at macroscopic level, we could observe that indeed a decrease of Methanosaeta sp. pop-ulation and its substitution by Methanoculleus sp. started in the test reactors at the sampling period P2. For the same, the pH was still above 7, no accumulation of VFAs was observed, and the methane yield was not yet affected (Figs. 2, 3).
Even though, the dominance of Methanoculleus was documented for many well-performing farm reactors [48], it is not the presence of this species (e.g. P0 in our studied reactors) which could point to the approaching process disturbance, but the sudden shift of the domi-nant population in steady-state reactors. Therefore, and in accordance to other authors [6], we tentatively pro-pose that substitution of a dominant archaeal population (Methanosaeta sp. is often dominant in reactors inocu-lated with sludge from a wastewater treatment plant (WWTP) and operated at low acetate and free-ammonia concentrations [48–51], Fig. 7) with another population of archaea (Methanoculleus sp. emerged at the onset of VFAs accumulation) could indeed be regarded as an early warning indicator of acidosis. Nevertheless, other authors propose other e.g. Methanosarcina thermophilia-related
species, characterized as heavy duty methanogens [49], to be the earliest indicators of acidification in overloaded fed-batch biogas reactor digesting maize silage [52]. In our study Methanosarcina sp. was not detected neither before nor during the acidosis (Fig. 5). Therefore, we sug-gest to conduct further large-scale monitoring of differ-ent well-performing as well as failed AD reactors fed with diverse substrates before a microbial species can une-quivocally be proposed as a good and universal indicators of any process imbalance.
Restoration of biogas production with NaOH and NaHCO3 addition
A starving period and a gradual addition of NaOH and NaHCO3 to R1–R3 following the acidosis, resulted in a pH increase to a neutral level after 3 days only. The com-plete process recovery and restoration of biogas produc-tion with the methane content exceeding 50 %, occurred already after 9 days following the beginning of the alkali addition. In comparison, bioaugmentation of overfed acidic reactors (pH decreased from around 7.0 to 6.8 only), has been shown to decrease the recovery time by a maximum of 37 days, compared to about 180 days for non-bioaugmented ones [53]!
Interestingly, the archaeal population in the test R1– R3 reactors, although affected in terms of community structure dynamics, was not eradicated by a relatively low pH (5.2 ± 0.4) during the acidosis. Following the pH increase, and probably as a consequence of starvation and NaOH influence on archaeal population, Methano-sarcina sp. which was also described as a fast growing archaeon resistant to high acetate concentration [49], started to outcompete Methanoculleus sp. in R2 and R3 (Fig. 5). Remarkably, a new archaeal OTU_15 classi-fied as a candidate genus vadinCA11 that was below the detection limit in previous periods, emerged in R1 and R2 during the recovery phase (P5) (Fig. 5; Additional file 2: Table S3). This genus has been reported as poten-tially halophilic [54] and it is probable that the increase of sodium ion concentration due to the addition of the alkali favoured its outbreak during the recovery phase.
Sedimentibacter, OTU_68 potentially assigned as
Clostridium bolteae and OTU_72 assigned as unclassi-fied Epulopiscium). At P5, OTU_68 constituted 10.6, 0.5 and 7.6 % of the whole bacterial population, based on the HTS results, respectively, for R1, R2 and R3. C. bolteae, which is a spore-forming propionate producer, was only detected for R3 at P0 and at a very low abundance level (around 0.01 % of the whole bacterial community). As one could expect, an increased propionate concentration at P5 was linked to an increased abundance of a propi-onate-producing C. bolteae and a decrease in abundance of potentially propionate-consuming WWE1 candidate bacteria [33]. Although the bacterial and archaeal com-munity structures completely changed for the three reac-tors R1–R3, following the alkali addition (Figs. 4, 5), the microbial population successfully self-optimized to the new environmental conditions, as the biogas production restarted quickly (Fig. 3a). On the one hand we showed that the addition of NaOH to raise the pH and NaHCO3 to raise the alkalinity quickly restored the activity of over-fed reactors; therefore, it represents an efficient treat-ment of AD reactors that faced acidosis. On the other hand, the drastically changing environmental conditions influenced the structure of the prevailing microbial com-munities in a way that a favourable niche was created for other species to emerge.
Conclusions
The impact of increasing OLR of sugar beet pulp, acido-sis and finally process recovery on microbial community richness and diversity in three mesophilic CSTR tors (R1–R3) were compared with a cautiously fed reac-tor (CR). As major outputs of this study we could point out that even though the overfed reactors responded rather similarly in terms of process performance to the OLR increase, each reactor established its own micro-bial community structure over time, dominated only by a few OTUs. The retrospective management [6] of our reactors showed that traditional microbial parameters such as richness, diversity and evenness which could be potentially used to predict process imbalances were not effective, due to the differential behaviours of microbial consortia in the replicated reactors. Moreover, the reac-tor that was characterized with the least diverse micro-bial community (R2) was the most resistant to acidosis and the best performing one in terms of methane pro-duction. The shift from Methanosaeta sp. to Methanoc-ulleus sp. in Methanosaeta sp.-dominated reactor could be an interesting and promising warning indicator of an approaching acidosis since this shift occurred before pH started to decreased. The combination of the reac-tor starvation and the pH adjustment with NaOH and NaHCO3 demonstrated a good potential for process
recovery after acidosis, as reflected by a quick restart of the methane production, even if a new microbial com-munity has established. Nevertheless, longer monitor-ing periods of microbial communities after man-induced process recovery are necessary to evaluate if the newly established microbial populations are stable over time and if they are better adapted to high VFAs concentra-tions. Relying on the results of this study, alkali-medi-ated AD process recovery from acidosis was successfully applied to two full-scale anaerobic reactors in Germany and Luxembourg (data not shown).
Methods
Reactors operation, monitoring and sampling
(0–2000 ppm range; RKI Instruments Inc., Union City, USA), respectively, on the same time basis as CH4 and CO2.
Following the reactors inoculation and during a 16-month-long adaptation phase (data not shown) the four reactors were fed every working day with a mono-substrate, using sugar beet pulp pellets [86.8 % total sol-ids (TS), 92.0 % volatile solsol-ids (VS), C/N: 39.63] at the OLR of 1.60 kg VS m−3 day−1, to increase the TS content of the original sludge from about 2 % to 7–8 % (TS con-tent commonly observed in farm biogas reactors).To best mimic traditional full-scale anaerobic reactors, the added substrate was not sterilized. In continuation, the feeding was adapted to maintain a constant HRT of 28.5 days by mixing the sugar beet pulp with tap water. Once a sta-ble TS content was obtained, the sludge was sampled (sampling period zero: P0, day 1) and the experimental campaign was initiated (Fig. 1). Three reactors (overfed reactors: R1, R2, R3) were further fed with an increasing OLR, while one reactor was used as a control (cautiously fed reactor; CR), and was constantly fed at an OLR of 1.60 kg VS m−3 day−1 (Fig. 1a). The choice of the experi-mental design present in this study (three replicated overfed reactors versus only one control reactor) was dic-tated by the fact than only four reactors of 100 L capac-ity were available; therefore, we decided to give priorcapac-ity for data generation to the overfed reactors. The OLR for R1-R3 was gradually increased by increments of 0.40 kg VS m−3 every week until reaching acidosis (Fig. 1b). To promote the process recovery, the feeding was stopped at day 267. After 6 days of starving under very acidic pH (5.2 ± 0.4), the pH was artificially increased to reach a value of 7 by adding 7, 2 and 5 L of 1 M NaOH to R1, R2 and R3, respectively (each reactor requiring specific amount of alkali). In continuation, NaHCO3 dry salt was slowly added to increase the alkalinity (around 900, 600 and 800 g for R1, R2 and R3, respectively) until a pH of 7.5 was reached. The three test reactors were then starved for 5 more days. The total starving of 11 days was
also applied to the CR. Finally, after the 11 days of starv-ing, as the methane content in the biogas reached again at least 50 % for R1–R3 (Fig. 3), the feeding was re-initi-ated for all the reactors at an OLR of 1.60 kg m−3 day−1. Sludge aliquots for R1–R3 and CR were sampled for six periods P0–P5 (Fig. 1) and stored frozen at −20 °C prior the microbial community analyses.
Microbial monitoring by 16S rRNA gene‑based T‑RFLP analysis
Genomic DNA was extracted as previously described by Klocke et al. [56]. Bacteria-specific 16S rRNA gene forward primer 27f, labelled with 6-carboxyfluorescein (6-FAM), and the reverse primer 926MRr (Table 1; Euro-gentec, Seraing, Belgium) were used for amplification with the following PCR conditions; initial denaturation at 98 °C for 3 min, followed by 25 cycles of denatura-tion at 98 °C for 20 s, annealing at 54 °C for 15 s, elon-gation at 72 °C for 1 min and a final elonelon-gation at 72 °C for 7 min. To amplify the archaeal 16S rRNA gene, for-ward primer Ar109f labelled with 6-FAM and the reverse primer Ar912r (Table 1; Eurogentec, Seraing, Belgium) were used with the following PCR conditions: initial denaturation at 98 °C for 3 min, followed by 29 cycles of denaturation at 98 °C for 20 s, annealing at 55 °C for 15 s, elongation at 72 °C for 1 min, and a final elonga-tion at 72 °C for 7 min. Amplificaelonga-tions were done using a TProfessional Thermocycler (Biometra GmbH, Goettin-gen, Germany) and the Phusion® Taq polymerase (New England Biolabs Inc., Ipswich, USA) in a final volume of 25 µL with 0.4 µM of each primer and 0.5 µL of a 1:10 and 1:50 dilution of the DNA extracts, respectively, for bacteria and archaea. PCR products were purified with the QIAquick PCR Purification Kit (Qiagen, Hilden, Germany) according to the manufacturer’s protocol. In continuation, 100–200 ng of purified bacterial 16S rRNA amplicons were digested at 37 °C for 4 h with the MspI and Hin6I restriction enzymes (Thermo Fisher Scientific, Waltham, USA). For Archaea, between 200 and 500 ng of
Table 1 PCR primers targeting the 16S rRNA genes of the bacterial and archaeal community
Primer Direction Sequence [5′ → 3′] Targeted domain References
27f Forward AGA GTT TGA TCM TGG CTC AG Bacteria [66]
926MRr Reverse CCG TCA ATT CMT TTR AGT TT Bacteria [67]
S-D-Bact-0341-a-S-17 Forward CCT ACG GGA GGC AGC AG Bacteria [68]
S-D-Bact-0787-b-A-20 Reverse GGA CTA CHV GGG TAT CTA AT Bacteria [68]
Ar109f Forward ACK GCT CAG TAA CAC GT Archaea [69]
Ar 912r Reverse CTC CCC CGC CAA TTC CTT TA Archaea [70]
S-D-Arch-0519-a-S-15 Forward CAG CMG CCG CGG TAA Archaea [68]
PCR products were digested at 37 °C for 4 h with the AluI restriction enzyme (Thermo Fisher Scientific, Waltham, USA). Digested products were precipitated with 0.1 v/v of sodium acetate (3 M) and 10 v/v of ethanol (75 %). Samples were incubated for 30 min in the dark and at room temperature, and centrifuged at 14,000 rpm at 4 °C for 30 min. Following the centrifugation, the supernatant was discarded, 10 v/v of ethanol (75 %) was added and samples were incubated for a second time during 10 min in the dark and at room temperature; and centrifuged at 14,000 rpm and 4 °C for 30 min. Finally, following the centrifugation, the supernatant was discarded, sam-ples were dried at 37 °C, re-suspended in 40 µL of ster-ile ultrapure water and incubated at 55 °C for 15 min at 300 rpm. In continuation, samples were mixed with 10 µL of Hi-Di formamide (Applied Biosystems, Stafford, USA) containing 1:250 (v/v) carboxy-X-rhodamine (ROX)-labelled MegaBace™ ET900-R size standard (GE Health-care, Piscataway, USA). Ultrapure water was added to reach the final volume of 16 µL. Samples were denatured at 95 °C for 3 min and directly placed on ice. The sizes of generated DNA fragments were determined using an Applied Biosystems 3130 Genetic Analyser (Applied Bio-systems, Stafford, USA) (POP 7 matrix, capillary size: 50 cm) with the following parameters: injection voltage, 3.0 kV; injection duration, 12 s; run voltage, 8.5 kV; run time at 60 °C, 5500 s. The GeneMapper software (version 4.0; Applied Biosystems, Stafford, USA) was used to ana-lyse the T-RFLP chromatograms. Fragments with fluo-rescence intensity below 200 relative fluofluo-rescence units were discarded from further analysis and following Dun-bar et al. [57], the total fluorescence of each sample was standardized three times to the smallest quantity. Online T-Rex software was used to align the T-RFs with a clus-tering threshold of 0.8 [58]. The length of each T-RF was expressed in base pair (bp). Figure 4 shows the results of the 16S rRNA gene-based T-RFLP analysis, with the graphs representing an average of three technical repli-cates performed for each sample.
Microbial monitoring by high‑throughput 16S rRNA amplicon sequencing
Genomic DNA extractions from samples of the six sam-pling periods P0–P5 were performed this time using the PowerSoil DNA Isolation Kit (Mobio Laboratories Inc., Carlsbad, CA, USA) in accordance with the manu-facturers’ protocol. The 16S rRNA gene libraries were constructed with a modified primer pair S-D-Bact-0341-a-S-17 and S-D-Bact-0787-b-A-20 targeting a fragment of 466 bp of the bacterial V3–4 region and primer pair S-D-Arch-0519-a-S-15 and S-D-Arch-1041-a-A-18 tar-geting a fragment of 526 bp of the archaeal V4–6 region (Table 1). The modification included the incorporation
in the 5′ end of the Nextera XT® transposase sequence (Illumina Inc., San Diego, USA) in the forward and the reverse primer, and additional four N (i.e. four random nucleotides) in the forward primer to increase the nucle-otide diversity. Amplicons were generated using the Q5® Hot Start High-Fidelity DNA Polymerase (New England Biolabs Inc., Ipswich, USA), purified with the AMpure magnetic beads (Agencourt, Beckman Coulter Inc., Full-erton, USA) and quantified with the Qubit® dsDNA HS assay kit (Life technologies, Carlsbad, USA). The concen-tration of the amplicons was adjusted to 1 ng µL−1 and 1 µL of each library was used as a template in a second PCR where the Nextera XT® barcodes and the Illumina adapters necessary for hybridization to the flow cell were added with the Nextera XT Index kit. The result-ing amplicons were purified with the AMpure magnetic beads (Agencourt) and pooled in equimolar concentra-tions. The final concentration of the library pool was determined with a KAPA SYBR® FAST Universal qPCR Kit (Kapa Biosystems, Wilmington, USA). Libraries were mixed with Illumina-generated PhiX control libraries (5 %) and sequenced with the MiSeq Reagent Kit V3-600 cycles. The obtained sequence reads were de-multi-plexed, quality trimmed and assigned to OTUs at 97 % similarity with Usearch (v7.0.1090_win64) pipeline [59]. Taxonomy affiliation was done with the Greengenes data-base (http://greengenes.lbl.gov/) and the final nucleo-tide sequences obtained were deposited in the GenBank database (http://www.ncbi.nlm.nih.gov/genbank/) under accession numbers KR013301 to KR013741 for bacteria and KR013288 to KR013300 for archaea.
Data analysis and statistics
test. Differences were considered statistically significant at a p value <0.05. The influence of process parameters on the microbial community diversity, assessed by HTS, was analysed using CCA with the CANOCO software (version 4.5) [64] and a correlation analysis (Spearman). The significance test for CCAs was carried out by Monte Carlo permutation (499 times) and correlations were considered significant at a p value <0.05. All statistical and correlation analyses were performed using the free-ware R version 3.1.0 [65].
Abbreviations
AD: anaerobic digestion; CCA: canonical correspondence analysis; CHP: combined heat and power unit; CR: control (cautiously fed) reactor; CSTR: continuously/completely stirred tank reactor; H′: Shannon–Weaver index; HRT: hydraulic retention time; HTS: high-throughput amplicon sequencing; J: Pielou index; LMM: linear mixed-effect models; nano SIMS: nanometer-scale secondary ion mass spectrometry; NMDS: non-metric multidimensional scaling; OLR: organic loading rate; R1–R3: test (overfed) reactors R1, R2 and R3; SAO: syntrophic acetate oxidation; T-RF: terminal restriction fragment; T-RFLP: terminal restriction fragment length polymorphism; TS: total solids; VFAs: volatile fatty acids; VS: volatile solids; OTU: operational taxonomic unit; WWTP: wastewater treatment plant.
Authors’ contributions
SL and XG performed the anaerobic digestion experiments and collected the samples and the reactor performances data. Molecular analyses were planned and carried out by XG, MC and MM, with the contribution of MK for the T-RFLP analysis. MC and XG analysed the results and wrote the manuscript. TU advised the statistical analysis. EB and PD participated in the planning and coordination of the study and in the manuscript correction. All the authors contributed to writing of the manuscript. All authors read and approved the final manuscript.
Author details
1 Environmental Research and Innovation (ERIN) Department, Luxembourg
Institute of Science and Technology (LIST), 41 rue du Brill, 4422 Belvaux, Lux-embourg. 2 Laboratoire Sols et Environnement, UMR 1120, Université de
Lor-raine, 2 avenue de la Forêt de Haye, TSA 40602, 54518 Vandœuvre-lès-Nancy, France. 3 Laboratoire Sols et Environnement, UMR 1120, INRA, 2 avenue de la
Forêt de Haye, TSA 40602, 54518 Vandœuvre-lès-Nancy, France. 4 Department
Bioengineering, Leibniz Institute for Agricultural Engineering Potsdam-Bornim, Max-Eyth-Allee 100, 14469 Potsdam, Germany. 5 Fachbereich VI- Raum- und
Umweltwissenschaften, Umweltfernerkundung & Geoinformatik, Universität Trier, 54286 Trier, Germany.
Acknowledgements
The authors thank Bénédicte De Vos and Anaïs Noo for their valuable technical support and Laurent Solinhac, Sylvain Legay, Beate Kröck and Ingo Bergmann for their help to set up the T-RFLP method. This work was supported by the Fonds National de la Recherche, Luxembourg (FNR CORE 2011 project GAS-POP, CO11/SR/1280949: Influence of the Reactor Design and the Operational Parameters on the Dynamics of the Microbial Consortia Involved in the Biomethanation Process) and co-financed by the European Fund for Regional Additional files
Additional file 1: Table S1. Community diversity and evenness indices for the four reactors CR, R1–R3.
Additional file 2: Table S2. Abundance levels and taxonomic affiliation of bacterial OTUs. Table S3. Abundance levels and taxonomic affiliation of archaeal OTUs. Table S4. Spearman correlation matrix for the relation-ships between the process parameters and the archaeal community diversity.
Development (ERDF) through the INTERREG IV A program 2007–2013 «Greater Region» for the OPTIBIOGAZ project.
Compliance with ethical guidelines
Competing interests
The authors declare that they have no competing interests.
Received: 12 May 2015 Accepted: 7 August 2015
References
1. Möller K, Stinner W (2009) Effects of different manuring systems with and without biogas digestion on soil mineral nitrogen content and on gase-ous nitrogen losses (ammonia, nitrgase-ous oxides). Eur J Agron 30:1–16 2. Yiridoe EK, Gordon R, Brown BB (2009) Nonmarket cobenefits and
economic feasibility of on-farm biogas energy production. Energy Policy 37:1170–1179
3. Wilkie AC (2008) Biomethane from biomass, biowaste, and biofuels. In: Wall JD, Harwood CS, Demain A (eds) Bioenergy. ASM Press edition, Washington, pp 195–205
4. Ahring B (2003) Perspectives for anaerobic digestion. In: Ahring B, Angeli-daki I, Macario EC, Gavala HN, Hofman-Bang J, Macario AJL et al (eds) Biomethanation I, 81st edn. Springer, Berlin Heidelberg, pp 1–30 5. Appels L, Lauwers J, Degrève J, Helsen L, Lievens B, Willems K et al (2011)
Anaerobic digestion in global bio-energy production: potential and research challenges. Renew Sustain Energy Rev 15:4295–4301 6. Carballa M, Regueiro L, Lema JM (2015) Microbial management of
anaerobic digestion: exploiting the microbiome-functionality nexus. Curr Opin Biotech 33:103–111
7. Demirel B, Scherer P (2008) The roles of acetotrophic and hydrogeno-trophic methanogens during anaerobic conversion of biomass to methane: a review. Rev Environ Sci Biotechnol 7:173–190
8. Vanwonterghem I, Jensen PD, Rabaey K, Tyson GW (2015) Temperature and solids retention time control microbial population dynamics and volatile fatty acid production in replicated anaerobic digesters. Sci Rep 5. doi:10.1038/srep08496
9. Akuzawa M, Hori T, Haruta S, Ueno Y, Ishii M, Igarashi Y (2011) Distinctive responses of metabolically active microbiota to acidification in a thermo-philic anaerobic digester. Microb Ecol 61:595–605
10. Ahring BK, Sandberg M, Angelidaki I (1995) Volatile fatty acids as indica-tors of process imbalance in anaerobic digesindica-tors. Appl Microbiol Biot 43:559–565
11. Speece RE (1996) Anaerobic biotechnology for industrial wastewaters. Archae press, Nashville
12. Adam G, Lemaigre S, Goux X, Delfosse P, Romain AC (2015) Upscaling of an electronic nose for completely stirred tank reactor stability monitor-ing from pilot-scale to real-scale agricultural co-digestion biogas plant. Bioresour Technol 178:285–296
13. Franke-Whittle IH, Walter A, Ebner C, Insam H (2014) Investigation into the effect of high concentrations of volatile fatty acids in anaerobic digestion on methanogenic communities. Waste Manag 34:2080–2089
14. Weiland P (2010) Biogas production: current state and perspectives. Appl Microbiol Biotechnol 85:849–860
15. Möller K, Müller T (2012) Effects of anaerobic digestion on digestate nutri-ent availability and crop growth: a review. Eng Life Sci 12:242–257 16. Makádi M, Tomócsik A, Orosz V (2012) Digestate: a new nutrient source—
review. In: Sunil Kumar (ed) Biogas. Intech, Rijeka. doi:10.5772/31355 17. Lerm S, Kleyböcker A, Miethling-Graff R, Alawi M, Kasina M, Liebrich M et al
(2012) Archaeal community composition affects the function of anaerobic co-digesters in response to organic overload. Waste Manag 32:389–399 18. Delbès C, Moletta R, Godon JJ (2001) Bacterial and archaeal 16S rDNA
and 16S rRNA dynamics during an acetate crisis in an anaerobic digestor ecosystem. FEMS Microbiol Ecol 35:19–26
20. Hill DT, Cobb SA, Bolte JP (1987) Using volatile fatty acid relationships to predict anaerobic digester failure. Trans ASABE 30:496–501
21. Angelidaki I, Ellegaard L, Ahring BK (2004) A mathematical model for dynamic simulation of anaerobic digestion of complex substrates: focus-ing on ammonia inhibition. Biotechnol Bioeng 42:159–166
22. Murto M, Björnsson L, Mattiasson B (2004) Impact of food industrial waste on anaerobic co-digestion of sewage sludge and pig manure. J Env Manag 70:101–107
23. Gallert C, Winter J (2004) Bacterial metabolism in wastewater treatment systems. In: Jördening H-J, Winter J (eds) Environmental biotechnology: concepts and applications. Wiley-VCH Verlag GmbH & Co. KGaA, pp 1–48 24. Bent SJ, Forney LJ (2008) The tragedy of the uncommon: understanding
limitations in the analysis of microbial diversity. ISME J 2:689–695 25. Liu WT, Marsh TL, Cheng H, Forney LJ (1997) Characterization of
microbial diversity by determining terminal restriction fragment length polymorphisms of genes encoding 16S rRNA. Appl Environ Microbiol 63:4516–4522
26. Osborn AM, Moore ERB, Timmis KN (2000) An evaluation of terminal-restriction fragment length polymorphism (T-RFLP) analysis for the study of microbial community structure and dynamics. Environ Microbiol 2:39–50
27. Pilloni G, Granitsiotis MS, Engel M, Lueders T (2012) Testing the limits of 454 pyrotag sequencing: reproducibility. Quantitative assessment and comparison to T-RFLP fingerprinting of aquifer microbes. PLoS One 7:7
28. Camarinha-Silva A, Wos-Oxley ML, Jáuregui R, Becker K, Pieper DH (2012) Validating T-RFLP as a sensitive and high-throughput approach to assess bacterial diversity patterns in human anterior nares. FEMS Microbiol Ecol 79:98–108
29. Berry D, Ben Mahfoudh K, Wagner M, Loy A (2011) Barcoded primers used in multiplex amplicon pyrosequencing bias amplification. Appl Environ Microbiol 77:7846–7849
30. Winderl C, Anneser B, Griebler C, Meckenstock RU, Lueders T (2008) Depth-resolved quantification of anaerobic toluene degraders and aquifer microbial community patterns in distinct redox zones of a tar oil contaminant plume. Appl Environ Microbiol 74:792–801
31. Sundberg C, Al-Soud WA, Larsson M, Alm E, Yekta SS, Svensson BH et al (2013) 454 pyrosequencing analyses of bacterial and archaeal richness in 21 full-scale biogas digesters. FEMS Microbiol Ecol 85:612–626 32. Solli L, Havelsrud O, Horn S, Rike A (2014) A metagenomic study of the
microbial communities in four parallel biogas reactors. Biotechnol Biofu-els 7:146
33. Pelletier E, Kreymeyer A, Bocs S, Rouy Z, Gyapay G, Chouari R et al (2008) “Candidatus Cloacamonas acidaminovorans”: genome sequence recon-struction provides a first glimpse of a new bacterial division. J Bacteriol 190:2572–2579
34. Limam RD, Chouari R, Mazéas L, Wu TD, Li T, Grossin-Debattista J et al (2014) Members of the uncultured bacterial candidate division WWE1 are implicated in anaerobic digestion of cellulose. Microbiologyopen 3:157–167
35. Nesbo CL, Dlutek M, Zhaxybayeva O, Doolittle WF (2006) Evidence for existence of mesotogas, members of the order thermotogales adapted to low-temperature environments. Appl Environ Microbiol 72:5061–5068 36. Krakat N, Schmidt S, Scherer P (2011) Potential impact of process
param-eters upon the bacterial diversity in the mesophilic anaerobic digestion of beet silage. Bioresour Technol 102:5692–5701
37. Conners SB, Mongodin EF, Johnson MR, Montero CI, Nelson KE, Kelly RM (2006) Microbial biochemistry, physiology, and biotechnology of hyper-thermophilic Thermotoga species. FEMS Microbiol Rev 30:872–905 38. Muralidharan V, Rinker KD, Hirsh IS, Bouwer EJ, Kelly RM (1997) Hydrogen
transfer between methanogens and fermentative heterotrophs in hyper-thermophilic cocultures. Biotechnol Bioeng 56:268–278
39. De Vrieze J, Verstraete W, Boon N (2013) Repeated pulse feeding induces functional stability in anaerobic digestion. Microb Biotechnol 6:414–424 40. Carballa M, Smits M, Etchebehere C, Boon N, Verstraete W (2011)
Cor-relations between molecular and operational parameters in continuous lab-scale anaerobic reactors. Appl Microbiol Biotechnol 89:303–314 41. Heeg K, Pohl M, Sontag M, Mumme J, Klocke M, Nettmann E (2014)
Microbial communities involved in biogas production from wheat straw as the sole substrate within a two-phase solid-state anaerobic digestion. Syst Appl Microbiol 37:590–600
42. Talbot G, Topp E, Palin MF, Massé DI (2008) Evaluation of molecular meth-ods used for establishing the interactions and functions of microorgan-isms in anaerobic bioreactors. Water Res 42:513–537
43. Werner JJ, Knights D, Garcia ML, Scalfone NB, Smith S, Yarasheski K et al (2011) Bacterial community structures are unique and resilient in full-scale bioenergy systems. Proc Natl Acad Sci USA 108:4158–4163 44. Werner JJ, Garcia ML, Perkins SD, Yarasheski KE, Smith SR, Muegge BD et al
(2014) Microbial community dynamics and stability during an ammonia-induced shift to syntrophic acetate oxidation. Appl Environ Microbiol 80:3375–3383
45. Kundu K, Sharma S, Sreekrishnan TR (2013) Changes in microbial com-munities in a hybrid anaerobic reactor with organic loading rate and temperature. Bioresour Technol 129:538–547
46. Padmasiri SI, Zhang J, Fitch M, Norddahl B, Morgenroth E, Raskin L (2007) Methanogenic population dynamics and performance of an anaerobic membrane bioreactor (AnMBR) treating swine manure under high shear conditions. Water Res 41:134–144
47. Karakashev D, Batstone DJ, Trably E, Angelidaki I (2006) Acetate oxidation is the dominant methanogenic pathway from acetate in the absence of methanosaetaceae. Appl Environ Microbiol 72:5138–5141
48. Nettmann E, Bergmann I, Pramschüfer S, Mundt K, Plogsties V, Herrmann C et al (2010) Polyphasic analyses of methanogenic archaeal communi-ties in agricultural biogas plants. Appl Environ Microbiol 76:2540–2548 49. De Vrieze J, Hennebel T, Boon N, Verstraete W (2012) Methanosarcina: the
rediscovered methanogen for heavy duty biomethanation. Bioresour Technol 112:1–9
50. Karakashev D, Batstone DJ, Angelidaki I (2005) Influence of environmental conditions on methanogenic compositions in anaerobic biogas reactors. Appl Environ Microbiol 71:331–338
51. Zheng D, Raskin L (2000) Quantification of Methanosaeta species in anaerobic bioreactors using genus- and species-specific hybridization probes. Microbial Ecol 39:246–262
52. Kampmann K, Ratering S, Geißler-Plaum R, Schmidt M, Zerr W, Schnell S (2014) Changes of the microbial population structure in an overloaded fed-batch biogas reactor digesting maize silage. Bioresour Technol 174:108–117
53. Tale VP, Maki JS, Zitomer DH (2015) Bioaugmentation of overloaded anaerobic digesters restores function and archaeal community. Water Res 70:138–147
54. Durbin AM, Teske A (2012) Archaea in organic-lean and organic-rich marine subsurface sediments: an environmental gradient reflected in distinct phylogenetic lineages. Front Microbiol 3:168. doi:10.3389/fmicb.2012.00168 55. Anonymous (2006) VDI 4630—Vergärung organischer Stoffe (German
guideline: Fermentation of organic materials—characterisation of the substrate, sampling, collection of material data, fermentation tests). Beuth Verlag GmbH edn, Berlin
56. Klocke M, Mähnert P, Mundt K, Souidi K, Linke B (2007) Microbial com-munity analysis of a biogas-producing completely stirred tank reactor fed continuously with fodder beet silage as mono-substrate. Syst Appl Microbiol 30:139–151
57. Dunbar J, Ticknor LO, Kuske CR (2001) Phylogenetic specificity and repro-ducibility and new method for analysis of terminal restriction fragment profiles of 16S rRNA genes from bacterial communities. Appl Environ Microbiol 67:190–197
58. Culman S, Bukowski R, Gauch H, Cadillo-Quiroz H, Buckley D (2009) T-REX: software for the processing and analysis of T-RFLP data. BMC Bioinformat-ics 10:171
59. Edgar RC (2010) Search and clustering orders of magnitude faster than BLAST. Bioinformatics 26:2460–2461
60. Shannon CE (1948) A mathematical theory of communication. Bell Syst Tech J 27:379–423
61. Pielou EC (1966) The measurement of diversity in different types of biological collections. J Theor Biol 13:131–144
62. Bray JR, Curtis JT (1957) An ordination of the upland forest communities of southern Wisconsin. Ecol Monogr 27:326–349
63. Schloss PD, Westcott SL, Ryabin T, Hall JR, Hartmann M, Hollister EB et al (2009) Introducing mothur: open-source, platform-independent, community-supported software for describing and comparing microbial communities. Appl Environ Microbiol 75:7537–7541
65. Core Team RD (2008) R: a language and environment for statistical com-puting, the R Foundation for Statistical Computing edn. Vienna, Austria 66. Lane DJ (1991) 16S/23S rRNA sequencing. In: Stackebrandt E, Goodfellow
M (eds) Nucleic acid techniques in bacterial systematics. Wiley, New York, pp 115–175
67. Weisburg WG, Barns SM, Pelletier DA, Lane DJ (1991) 16S ribosomal DNA amplification for phylogenetic study. J Bacteriol 173:697–703
68. Klindworth A, Pruesse E, Schweer T, Peplies J, Quast C, Horn M et al. (2012) Evaluation of general 16S ribosomal RNA gene PCR primers for classical and next-generation sequencing-based diversity studies. Nucleic Acids Res 41(1):e1. doi:10.1093/nar/gks808
69. Grosskopf R, Janssen PH, Liesack W (1998) Diversity and structure of the methanogenic community in anoxic rice paddy soil microcosms as examined by cultivation and direct 16S rRNA gene sequence retrieval. Appl Environ Microbiol 64:960–969
70. Lueders T, Friedrich M (2000) Archaeal population dynamics during sequential reduction processes in rice field soil. Appl Environ Microbiol 66:2732–2742
Submit your next manuscript to BioMed Central and take full advantage of:
• Convenient online submission
• Thorough peer review
• No space constraints or color figure charges
• Immediate publication on acceptance
• Inclusion in PubMed, CAS, Scopus and Google Scholar
• Research which is freely available for redistribution