Study of various characteristics of composite flour prepared
from the blend of wheat flour and gorgon nut flour
Sandeep Kumar and C.S. Saini*
Department of Food Engineering and Technology, Sant Longowal Institute of Engineering and Technology (SLIET), Longowal-148106, Sangrur, Punjab, India
*Corresponding author: charanjiv_cjs@yahoo.co.in
Paper No. 492 Received: 8-2-2016 Accepted: 19-8-2016
Abstract
The composite flour was prepared by mixing wheat flour and popped gorgon nut flour in different ratios. The composite flour was evaluated for different properties i.e. physical, functional, pasting and thermal properties. Bulk density and true density decreased wherever water absorption index and water solubility index increased with increase in percentage of popped gorgon nut flour in composite flour. In functional properties, water absorption capacity and oil absorption capacity increased but foaming capacity decreased with increase in blending proportion of popped gorgon nut flour in composite flour. Pasting temperature of composite flour ranged from 67.75°C to 67.85°C. Final viscosity of different composite flour samples ranged between 3042 to 3651 cp. Peak temperature and conclusion temperature of composite flour decreased with increase in proportion of popped gorgon nut flour.
Highlights
• Popped gorgon nut flour was mixed with wheat flour at five different levels i.e. 5%, 10%, 15%, 20% and 25% to give composite flour and different properties of composite flour were evaluated. • There was increase in water absorption index and water solubility index with increase in the blending
proportion of popped gorgon nut flour in composite flour.
• Water absorption capacity and oil absorption capacity of composite flour increased but foaming capacity decreased with increase in the level of popped gorgon nut flour.
Keywords: Gorgon nut, wheat flour, composite flour, functional properties, pasting properties
DOI Number: 10.5958/2230-732X.2016.00089.9
©2016 New Delhi Publishers. All rights reserved
AGRICULTURE ENGINEERING
Gorgon nut is the annual floating-leaved herb mostly treated as underutilized aquatic crop but is nutritious food crop growing in diverse areas from Tropics to Frigid Zone with a great importance to wide sector of rural people. India and China are the only countries where makhana is cultivated as crop. In India, it is mainly cultivated in the states of Bihar and some parts of eastern India (Mishra et al. 2003). Makhana is considered as an aquatic cash crop in India (Jha et al. 1991). The flour produced from makhana is used as substitute of arrow root. The flour is also used to make delicious dishes like sweet meat, soups, makhana kheer and as thickener in different foods preparations. In every religion,
The cereal based products made from fortified flours are widely accepted and have been commercialized in many parts of the world to improve the nutritional and other quality parameters of end products. Popped gorgon nut flour offer a potential to be incorporated in wheat flour for improvement in baked products. It has been observed that protein in gorgon nut possesses balanced amino acid profile that can meet the amino acid requirements of target populations. As makhana is now increasingly accepted as a health food all over the country, it offers significant opportunities for value addition through limited investment in primary processing and packaging facilities. The popping process of the makhana improves its rheological properties as it happens by extrusion of other grains (Sanchez et al. 2008). Wheat flour and popped gorgon nut flour have a very unique attributes. The method of preparation of different bakery products from wheat flour and their combination with other flours have been reported but the reports on the utilization of popped gorgon nut flour with wheat flours or other flours are scarce. Therefore the present work was undertaken to examine different characteristics of composite flour by supplementing wheat flour with gorgon nut flour in order to identify its potential application in different food ingredients.
Materials and Methods
Gorgon nut seed and popped gorgon nut were purchased from NCRM, Darbhanga, Bihar. The seeds and popped gorgon nut were cleaned manually by removing adhering foreign matter and packed in polyethene bags for further analysis. The popped gorgon nut flour was made from popped gorgon nut kernels after reducing the moisture content of kernels to 4%. The flour collected was sieved using mesh number 85 (0.180 mm) size and packed in polythene bags and kept at ambient room temperature for further analysis. The refined wheat flour was obtained from flour mill located at Longowal, Punjab.
Preparation of blends: Blends were prepared by mixing popped gorgon nut flour and wheat flour in different combinations. The different percentage of popped gorgon nut flour at 5%, 10%, 15%, 20% and 25% levels were taken and mixed with wheat flour to give composite flour. The composite flour was stored in airtight container. All the other ingredients were obtained from laboratory and local market.
Proximate composition of wheat flour and gorgon nut flour
The moisture, ash, crude fat, crude fibre and protein content of flour were determined according to method prescribed by AOAC (2000).The total carbohydrate content was calculated by deducting the sum of the values for moisture, ash, crude fat, crude fibre and protein content from 100 (Raghuramula et al. 1983). The energy value of the sample was calculated by formula method described by Paul and Southgate (1978).
Energy value (kJ) = 17 (protein) + 38 (fat) + 17 (carbohydrate)
Starch content was estimated by anthrone reagent method suggested by Saldivar (2012).
Physical properties of flours
The procedure of Singh et al. (2008) was used to determine the bulk density (loose and packed) of the flour. True density was calculated (Deshpande and Poshadri, 2011).
(
)
Weight of flour sampleTrue density g/ml =
Rise in toluene level
The porosity of the flour and blend was determined by the method described by Samejima et al. (1982) by the following equation:
Bulk density Porosity % = 1
True density
−
A Hunter lab Color Spectrophotometer (Gretag Macthbeth, I-5, USA) was employed to measure the color values i.e. L, a, and b of the flour samples. Total colour difference (∆E) was calculated by applying the equation:
∆E = [(LS – L* )2 + (a
S – L* )2 + (bS – L^* )2](1/2)
The whiteness index values which mathematically combine lightness and yellow-blue into a single term were calculated as described by Hsu et al. (2003) as follows:
WI = 100 – [(100 – L)2+ a2 + b2]1/2
( )
Weight of sedimentWAI g/g
Weight of flour sample
=
Weight of dissolved solids in supernatant
WSI (%) = 100
weight of flour sample ×
Functional Properties
Water absorption capacity (WAC) of flour was measured by the centrifugation method of Sosulski (1962).
Weight of centrifuge tube after drying g weight of centrifuge tube sample wt initially taken WAC
g Sample weight initially taken
−
= −
For the determination of oil absorption capacity (OAC), the method of Lin et al. (1974) was used.
(
)
weight of centrifuge tube with sample after removing oil centrifuge tube weight + Sample wt g
OAC
g Sample weight
−
=
The method described by Narayana and Narasinga Rao (1982) was used for the determination of foaming capacity (FC) and foam stability (FS). The FC was expressed as a percentage increase in volume:
( )
Increase in volume after whipping initial volume
Foaming capacity % 100
initial volume
−
= ×
The foam volume was recorded 1 hour after whipping to determine the foam stability (FS) as a percentage of the initial foam volume.
( )
Volume of foam after 1 hFoaming stability % 100
Initial volume of foam
= ×
The SDS sedimentation value and alkaline water retention capacity (AWRC) of flour was estimated by method of AACC (2000).
( ) ( )
(Tube, stopper, gel weight)
tube, stopper 86
AWRC % 1 100
Flour weight 100 flour m.c
−
= − ×
−
For the estimation of least gelation concentration (LGC), the method of Sathe et al. (1981)was used.
Solvent retention capacity profile (SRC) was obtained according to the AACC (2000).
( ) ( )
(Tube, stopper, gel weight)
tube, stopper 86
SRC % 1 100
Flour weight 100 flour m.c
−
= − × ×
−
Pasting properties of different flour samples were studied using Rapid Visco Analyzer (RVA Tech Master, Perten Instruments, Sweden). The thermal properties including the onset temperature (To), peak temperature (Tp), conclusion or end temperature (Tc) and gelatinization enthalpy (ΔH) of the popped gorgon nut flour, wheat flour and their composite flours were determined using a Differential Scanning Calorimetry (DSC-4000, Perkin Elmer, USA).
Statistical analysis
All the experiments were carried out in triplicate and results were represented as Mean±SD. The significance of differences among the values was determined using one way analysis of variance (ANOVA) followed by Duncan’s multiple-range test (Duncan, 1955). STATISTICA 7 (Stat Soft, Tusla, USA) statistical software packages (p<0.05) was used to determine which means are significantly different.
Results and Discussion
Proximate composition of composite flour
Table 1: Proximate analysis of wheat flour, popped gorgon nut flour and their blends Parameters Wheat
flour
Popped gorgon
nut flour
C1 (95:5) C2 (90 :10) C3 (85:15) C4 (80:20) C5 (75:25)
Moisture (%) Protein (%) Fat (%) Ash (%) Crude fiber (%) Carbohydrate (%) Energy Value (KJ/100 g) 13.54a±0.21 11.84c±0.10 1.23a±0.15 0.73a±0.11 0.99a±0.10 71.65bc±0.16 1466.31b ± 3.28 12.20b±0.20 12.37b±0.46 0.36b±0.05 0.79a±0.11 0.83a±0.06 73.19a±0.63 1473.66c ± 4.75 13.20ab±0.52 12.13ab±0.10 1.26a±0.15 0.86a±0.11 0.96a±0.12 71.56c±0.58 1471.03b ± 9.50 12.90bc±0.29 11.90bc±0.17 1.16ab±0.11 0.93a±0.11 0.87a±0.17 72.51ab±0.35 1479.41ab ± 4.36 12.60c±0.05 11.94bc± 0.14 1.06ac±0.05 0.89a±0.11 1.02a±0.21 72.62a± 0.66 1474.42ab ± 10.08 12.51c±0.04 11.95bc±0.10 1.0bc±0.1 0.86a±0.30 0.96a±0.28 72.69a±0.57 1477.10a ± 11.22 11.91d±0.10 12.25a±0.17 0.86c±0.05 0.66a±0.11 0.86a±0.20 73.43a±0.95 1489.60a ± 8.14
(C1 (95:5)) = 5% ; (C2 (90:10)) = 10% ; (C3 (85:15)) = 15% ; (C4 (80:20)) = 20% ; (C5 (75:25)) = 25% Mean ±S.D. with different superscripts in a row differ significantly (p<0.05) (n=3)
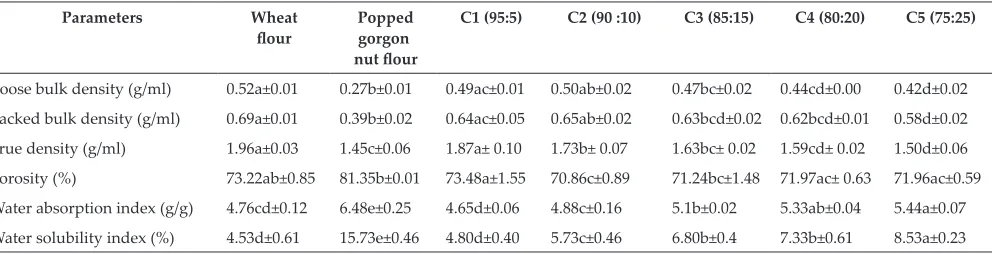
Table 2: Physical properties of wheat flour, popped gorgon nut flour and their blends
Parameters Wheat
flour Popped gorgon
nut flour
C1 (95:5) C2 (90 :10) C3 (85:15) C4 (80:20) C5 (75:25)
Loose bulk density (g/ml) Packed bulk density (g/ml) True density (g/ml) Porosity (%)
Water absorption index (g/g) Water solubility index (%)
0.52a±0.01 0.69a±0.01 1.96a±0.03 73.22ab±0.85 4.76cd±0.12 4.53d±0.61 0.27b±0.01 0.39b±0.02 1.45c±0.06 81.35b±0.01 6.48e±0.25 15.73e±0.46 0.49ac±0.01 0.64ac±0.05 1.87a± 0.10 73.48a±1.55 4.65d±0.06 4.80d±0.40 0.50ab±0.02 0.65ab±0.02 1.73b± 0.07 70.86c±0.89 4.88c±0.16 5.73c±0.46 0.47bc±0.02 0.63bcd±0.02 1.63bc± 0.02 71.24bc±1.48 5.1b±0.02 6.80b±0.4 0.44cd±0.00 0.62bcd±0.01 1.59cd± 0.02 71.97ac± 0.63 5.33ab±0.04 7.33b±0.61 0.42d±0.02 0.58d±0.02 1.50d±0.06 71.96ac±0.59 5.44a±0.07 8.53a±0.23 Mean ±S.D. with different superscripts in a row differ significantly (p<0.05) (n=3)
Table 3: Colour analysis of wheat flour, popped gorgon nut flour and their blends Parameters Wheat
flour Popped gorgon nut flour C1 (95:5) C2 (90 :10) C3 (85:15) C4 (80:20) C5 (75:25)
L* a* b* ∆E Whiteness index
92.78a±0.36 2.10c±0.05
9.79a±0.05 11.39d±0.12 87.65a±0.19
78.12f±1.50 3.30d±0.10 9.14c±0.20
21.79e±1.37
76.06f±1.41
90.92b±0.32 2.07c±0.06
9.00b±0.05 11.62d±0.23 87.04b±0.27
89.50c±0.24
2.12c±0.06
8.86bc±0.08 12.37b±0.11 86.09c±0.14
88.16d±0.23 2.33b±0.02 8.75cd±0.09 13.23c±0.22
85.09d±0.23
87.35e±0.15
2.38b±0.01 8.69cd±0.21 13.77a±0.18 84.47e±0.17
87.26e±0.70
2.47a±0.05 8.58d±0.01 13.97a±0.29 84.24e±0.33
Mean ±S.D. with different superscripts in a row differ significantly (p<0.05) (n=3)
Table 4: Functional properties of wheat flour, popped gorgon nut flour and their blends
Parameters Wheat
flour Popped gorgon
nut flour
C1 (95:5) C2 (90 :10) C3 (85:15) C4 (80:20) C5 (75:25)
Water absorption capacity (g/g) Oil absorption capacity (g/g) Foaming capacity (%) Foam stability (%)
SDS-sedimentation volume (ml) AWRC(%)
0.46d±0.03 1.19c±0.08
32.98ac±2.99 59.61a±4.48 27.03d±0.55 114.38f±4.35
4.93e±0.03
2.55d±0.11 6.90b±0.98 58.88a±7.18 37.33e±1.15
438.93g±6.29
0.65c±0.02
1.20c±0.06
37.25a±3.39 61.37a±5.57 28.06cd±0.70 128.47e±2.49
0.85b±0.01 1.33bc±0.12 33.63ab±1.43 59.80a±2.56 28.93c±0.30
159.71d±4.06
0.88b±0.10 1.45ab±0.07 30.74bcd±2.90 61.87a±3.58 30.76b±0.90 188.83c±0.98
0.96b±0.09 1.42b±0.12 28.80bcd±2.96 62.01a±4.05 32.53a±0.94 222.80b±3.45
1.14a±0.04 1.61a±0.07 27.88d±1.99 62.15a±1.97 32.63a±0.40 244.06a±1.69
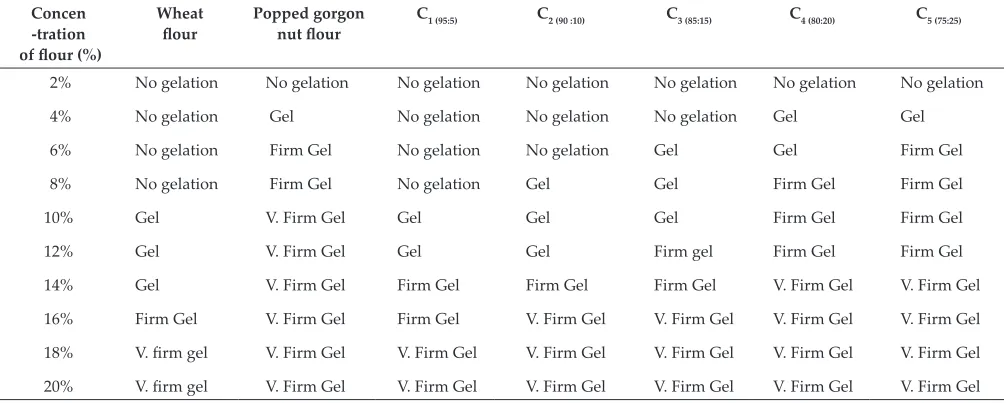
Table 5: Least gelation concentration (LGC) analysis of wheat flour, popped gorgon nut flour and their blends
Concen -tration
of flour (%)
Wheat
flour Popped gorgon nut flour C1 (95:5) C2 (90 :10) C3 (85:15) C4 (80:20) C5 (75:25)
2% 4% 6% 8% 10% 12% 14% 16% 18% 20% No gelation No gelation No gelation No gelation Gel Gel Gel Firm Gel V. firm gel V. firm gel
No gelation Gel Firm Gel Firm Gel V. Firm Gel V. Firm Gel V. Firm Gel V. Firm Gel V. Firm Gel V. Firm Gel
No gelation No gelation No gelation No gelation Gel Gel Firm Gel Firm Gel V. Firm Gel V. Firm Gel
No gelation No gelation No gelation Gel Gel Gel Firm Gel V. Firm Gel V. Firm Gel V. Firm Gel
No gelation No gelation Gel Gel Gel Firm gel Firm Gel V. Firm Gel V. Firm Gel V. Firm Gel
No gelation Gel Gel Firm Gel Firm Gel Firm Gel V. Firm Gel V. Firm Gel V. Firm Gel V. Firm Gel
No gelation Gel Firm Gel Firm Gel Firm Gel Firm Gel V. Firm Gel V. Firm Gel V. Firm Gel V. Firm Gel
Table 6: Solvent retention capacity (SRC) properties of wheat flour supplemented with different proportion of popped gorgon nut flour
Parameters Wheat
flour
Popped gorgon
nut flour
C1 (95:5) C2 (90 :10) C3 (85:15) C4 (80:20) C5 (75:25)
Sucrose (%) Lactic acid (%)
Sodium carbonate (%) Deionized water (%)
134.82g±1.01 155.50g±3.90
134.72g±2.44 115.27g±0.50
471.81f±1.42 463.78f±2.77
464.76f±10.67 456.21f±2.82
157.86e±2.31
190.89e±2.31
173.60e±1.87
136.06e±4.13
188.15d±4.60 212.21d±3.32
219.75d±3.47 156.99d±4.68
199.76c±2.30
234.18c±3.34
240.09c±2.18
181.40c±4.27
221.71b±6.06 286.48b±5.49
267.58b±1.44 205.33b±2.18
244.39a±2.98 325.42a±3.10
295.37a±1.66 239.51a±3.25
Mean ±S.D. with different superscripts in a row differ significantly (p<0.05) (n=3)
Table 7: Pasting characteristics of wheat flour, popped gorgon nut flour and their blends
Parameters Wheat
flour
Popped gorgon
nut flour
C1 (95:5) C2 (90 :10) C3 (85:15) C4 (80:20) C5 (75:25)
Peak viscosity (cP)
Trough viscosity (cP) Breakdown viscosity (cP)
Final viscosity (cP) Setback viscosity (cP) Peak time (min)
Pasting temperature(°C) 3329.00 2039.00 1290.00 3976.00 1937.00 6.13 67.75 926.00 531.00 395.00 1110.00 579.00 1.40 – 2968.00 1861.00 1107.00 3651.00 1790.00 6.00 67.75 2881.00 1797.00 1084.00 3627.00 1830.00 5.93 67.80 2674.00 1600.00 1074.00 3176.00 1576.00 5.73 67.85 2521.00 1545.00 976.00 3163.00 1618.00 5.87 67.70 2504.00 1503.00 1001.00 3042.00 1539.00 5.60 67.80
Table 8: Differential scanning calorimetry (DSC) characteristics of wheat flour, popped gorgon nut flour and their blends
Parameters Wheat
flour Popped gorgon nut flour C1 (95:5) C2 (90 :10) C3 (85:15) C4 (80:20) C5 (75:25)
Onset temperature To (°C)
Peak temperature Tp (°C)
End temperature Tc (°C)
was observed that moisture content of wheat flour was significantly different (p<0.05) from composite flour at all the levels from 10% to 25%. The protein content of popped gorgon nut substituted composite flour was found to have slightly higher value than wheat flour. Popped gorgon nut substituted flour at 25% (C5 (75:25)) had the highest protein content (12.25%). This may be due to fact that crude protein content of popped gorgon nut was slightly higher than wheat flour. The fat content of composite flour at different levels i.e. from 5% to 25% was less than wheat flour. Fat content of popped gorgon nut fortified flour varied from 1.26% to 0.86%. Reduction in fat content was observed with increase in substitution of popped gorgon nut in wheat flour. It may be due to fact that there was low fat content present in popped gorgon nut flour as compare to wheat flour. Ash is the mineral residue remaining after organic matter has been incinerated. So more is the ash content, more will be mineral content. The ash content of composite flour varied from 0.93% to 0.66%. The fiber content of composite flour varied from 0.86% to 1.02%. The fiber content of wheat flour was slightly higher than the fortified flour. As the carbohydrate content for different flour was calculated by difference method, the variation in carbohydrate content may be attributed to the differences in other constituents. Carbohydrate content gradually increased with increase in proportion of fortified flour. The similar value of carbohydrate was also reported by Islam et al. (2012) for refined wheat flour. Energy value plays an important role in daily life diet. It was found that energy value (kJ) increased with increase in percentage of popped gorgon nut flour and decrease in wheat flour content.
Physical properties of composite flour
The different physical properties of composite flour are presented in Table 2. Loose bulk density (LBD) is a reflection of the load the samples can carry if allowed to rest directly on one another. Loose bulk density represents the lowest attainable density with compression. The wheat flour sample had the highest loose bulk density value (0.52 g/ml). Increase in the level of popped gorgon nut flour in the wheat flour resulted in decrease in the loose bulk density value. This may be due to the influence of molecular structure, less weight and higher volume of popped gorgon nut flour. The composite flour with lower
values of loose bulk density are more desirable, as the samples would pack better during storage without losing volume, however, the values were comparable. Similar trend for loose bulk density was reported by Emmanuel et al. (2010) for wheat and taro flour blend at different proportions. The packed bulk density (PBD) represents the highest attainable density with compression. Increase in the level of popped gorgon nut flour in the wheat flour resulted in decrease in the packed bulk density values. These lower values indicate that popping affects the molecular integrity of the popped gorgon nut flour, thus resulting in better packing. The low density values of the formulated composite flour indicate that the volume of the blends in the package will not decrease excessively during storage or distribution. Similar trends for packed bulk density were reported by Emmanuel et al. (2010) for wheat and taro flour blend at different proportions. True density is the density of the solid material excluding the volume of any open and closed pores. Depending on the molecular arrangement of the material, the true density can equal the theoretical density of the material and therefore be indicative of how close the material is to a crystalline state or the proportions of a binary mixture. Popped gorgon nut flour addition resulted in decrease in true density of fortified flour. The decreasing trend in true density upon fortification of popped gorgon nut flour may be due to higher volume occupied by the popped gorgon nut flour. Vijayakumar and Mohankumar (2009) reported the true density of wheat and millet based composite flour at different proportions in the range from 1.19 to 2.5 g/ml. Porosity is a measure of the voids between the solid particles of a material. Pore space can be filled with fluids including gas or water. Air filled porosity allows gases to move within material. For gases to move throughout material, pores must be continuous. The variation in the porosity may be due to the different values of bulk density and true density of the fortified flour. Vijayakumar and Mohankumar (2009) reported the porosity of wheat and millet based composite flour at different proportions was in the range of 54.50% to 76.6%.
increase in the absorption. The presence of higher level of damaged starch has been suggested as another possible reason (Mariotti et al. 2006). There was increasing trend of water solubility index upon increasing the substitution of popped gorgon nut flour in wheat flour. Starch had the tendency to become soluble after different cooking treatments (Jones et al. 2000). According to Colonna et al. (1984), the increase in solubility in the extruded products is attributed to dispersion of amylose and amylopectin molecules following gelatinization under mild processing conditions and to formation of low molecular weight compounds under harsher conditions may also be the valid reason of the present study.
Colour analysis
Color parameters of wheat flour and popped gorgon nut substituted composite flour in the terms of L*, a*, b*, ∆E and whiteness index are presented in Table 3. The L* value indicates the lightness, 0-100 representing dark to light. The L* in wheat flour was observed as 92.78. The L* decreased from 90.92 (C1(95:5)) to 87.26 (C5(75:25)) with increase in the level of popped gorgon nut flour in blend. This may be due to the lower value of L* of popped gorgon nut flour than wheat flour. During statistical analysis, it was observed that the L* of wheat flour significantly differs (p<0.05) from composite flour at all the levels from 5% to 25%. a* value shows the degree of the red to green colour, with a higher positive a* value indicating more redness. The change in redness with increased in popped gorgon nut flour substitution may be due to red colour of pericarp portion adhering to popped gorgon nut flour. b* value indicates the degree of yellow to blue colour, with higher positive b* value indicating more yellowness. As the substitution increased, there was decrease in b*. The difference in the colour characteristics of different levels of substituted flour and wheat flour may be attributed to differences in colored pigments of the flours, which in turn depends on the botanical origin of the plant and also to the composition of the flour (Aboubakar et al. 2008).
Functional properties of composite flour
The functional properties of composite flour are presented in Table 4. Water absorption capacity (WAC) represents the ability of a product to associate
with water under conditions where water is limiting (Singh, 2001). It was observed that the WAC value increased as the blending proportion increased. This may be due to the popping and grinding of popped gorgon nut, where starch structures were disrupted and crystalline regions melted as the proportion increased in wheat flour. The increase in the WAC has always been associated with the increase in the amylose leaching and solubility, and loss of starch crystalline structure (Gunaratne and Hoover, 2002). Griffith et al. (1998) reported an increase in the WAC, OAC and WSI in different cereals and legume after roasting. The oil absorption capacity (OAC) of flours is also important as it improves the mouth feel and retains the flavor (Kinsella, 1976). Oil retention has been attributed to the physical entrapment of the lipid by the protein (Quin and Benchat, 1975; Padmashree et al. 1987). OAC is the ability of the flour protein to physically bind fat by capillary attraction and it is of great importance, since fat acts as flavor retainer and also increases the mouth feel of foods, especially bread and other baked foods (Kinsella, 1976).The OAC of different levels of popped gorgon nut substituted composite flours ranged from 1.20 g/g (C1(95:5)) to 1.61 g/g (C5 (75:25)). Griffith et al. (1998)also reported an increase in the WAC, OAC and WSI in different cereals and legume after roasting.
on their ability to maintain the foam as long as possible (Lin et al. 1974). Foam volume changes as a function of time for wheat and popped gorgon nut substituted composite flour. The FS of different levels of popped gorgon nut substituted composite flours ranged from 61.37% (C1(95:5)) to 62.15% (C5 (75:25)). Since FS is governed by the ability of the film formed around the entrapped air bubbles to remain intact without draining, it follows that stable foams can only be formed by the highly surface active solutes (Cherry and McWatters, 1981). Instability of foams is indicated by drainage of liquid from the lamellae and by an increase and then rupture in the size of the bubbles (Sathe et al. 1982). The good foam stability of flours suggested that the native proteins that are soluble in the continuous phase (water) are very surface-active in these flours. Sedimentation value (SV) is the indirect measurement of quality and composition of gluten protein. As popped gorgon nut flour does not contain any gluten content but with the increase of blending proportion of popped gorgon nut flour with wheat flour i.e. with the decrease in wheat flour content, the sedimentation value increased to a small extent. The increase in the SV of composite flour is due to the denser particle of popped gorgon nut flour which settles as the sediment.
Alkaline water retention capacity (AWRC) is the important parameter of cookie flour. It is directly co-related with cookie diameter. Higher AWRC indicates the smaller cookie diameter. During statistical analysis it was found that AWRC of wheat flour differs significantly from all blends of composite flour (p<0.05). The least gelation concentration (LGC) which is defined as the lowest protein concentration at which gel remained in the inverted tube was used as index of gelation capacity. In 5% substitution of gorgon nut flour, LGC was observed with 10% suspension but in 25% substitution of gorgon nut flour, LGC was observed with 4% suspension onwards (Table 5). Lower is the LGC, better is the gelating ability of the protein ingredient (Akintayo et al. 1999) and the swelling ability of the flour is enhanced. This may be due to the change of starch structure, water absorption index and the swelling ability of popped gorgon nut flour. Emmanuel et al. (2010) reported the least gelation concentration of wheat flour as 10%. Defatted cereals containing high amount of protein and starch content and the gelation capacity of flour
is influenced by physical competition for protein gelation and starch gelatinization (Singh, 2001).
Solvent retention capacity (SRC)
Solvent retention capacity (SRC) establishes a practical flour quality and functionality profile useful for prediction in baking performance. The lactic acid SRC is associated with glutenin characteristic, sodium carbonate SRC with levels of damaged starch and sucrose SRC with pentosan and gliadin characteristics. Water SRC is influenced by all the flour constituents. The substitution has been demonstrated to have a significant effect on the sodium carbonate, lactic acid and demineralized water retention capacities. SRC is useful for studying the contribution of the flour components to end-use quality and selection of wheat for production of flour with required functionality. Solvent retention capacity of wheat and popped gorgon nut substituted composite flour at different proportion are presented in Table 6. It was observed that with the increase of blending proportion, the sucrose SRC increased gradually. This may be due to increase in absorption and higher sucrose SRC of the popped gorgon nut flour. With the increase of blending proportions, the lactic acid SRC also increased gradually. Similarly, SRC for remaining two solvents i.e. sodium carbonate and deionized water increased with increase in proportion of composite flour. During statistical analysis, it was observed that all four types of SRC of wheat flour significantly differs (p<0.05) from 5% to 25% substituted popped gorgon nut composite flour and within the various composite flour blends.
Pasting properties
67.85°C (C3 (85:15)). The pasting temperatures of all the composite flour are almost same in the present study. When a sufficient number of granules become swollen, a rapid increase in viscosity occurs, known as peak viscosity (PV). There was decrease in the peak viscosity as the substitution of popped gorgon nut flour increased in the composite flour. This may be due to fact that the popped gorgon nut flour had lower viscosity than the wheat flour. It has been reported that the loosely packed starch granules with high level of damaged starch easily hydrate and swell more rapidly in the presence of heat and consequently produce less peak viscosity (Mariotti et al. 2006). Trough viscosity is influenced by the rate of amylose exudation, granule swelling, amylose-lipid complex formation and competition between exudated amylose and remaining granules for free water. Breakdown viscosity is the measure of the ease with which the swollen granules can be disintegrated. Final viscosity indicates the ability of the material to form a viscous paste. Final viscosity is largely determined by the retro gradation of soluble amylose upon cooling (Olkku and Rha, 1978). Final viscosity (FV) of different composite blends ranged between 3651 cP (C1 (95:5)) to 3042 cP (C5 (75:25)). Setback viscosity is a measure of the syneresis of starch upon cooling of cooked starch pastes. Setback value is the recovery of the viscosity during cooling of the heated starch suspension. Lowest setback value of composite flour with 25% popped gorgon nut substitution indicates its lower tendency to retrograde. The minimum tendency to retrograde is advantage in food products such as soups and sauces, which undergo loss of viscosity and precipitation (Adebowale and Lawal, 2003). The pasting time is the time required to become the paste. The pasting characteristics play an important role in the selection of a variety for use in the industry as a thickener, binder or for any other use. The viscosity of the gel formed during and after heating is an important factor in the selection process (Aryee et al. 2006). The popped gorgon nut flour had reduced RVA viscosity parameters other than pasting temperature relative to raw flour, which were influenced by molecular degradation during popping. This effect has already been observed by other authors, who attributed the decrease to early starch gelatinization (Doublier et al. 1986). The decrease in viscosity would therefore indicate the proportion of gelatinized starch. When
the extruded or popped flour was mixed with raw flour, the popped flour fragments might be quickly dispersed in the water covering the exterior of the raw flour granules or clogging the pores on the surface of raw flour granules. Chinnaswamy et al. (1989) indicated that extruded flour fragments might reassociate with the uncoiled amylopectin branches, partially limiting the water absorption. Wani et al. (2012) reported almost same trend of the RVA profile of the wheat flour. Similar trend of RVA profiles of raw corn flour and extruded corn flour mixtures was reported by Zeng et al. (2011).
Thermal properties
The thermal properties like onset temperature (To), peak temperature (Tp), end or conclusion temperature (Tc) and ΔH of wheat flour and popped gorgon nut substituted composite flour are presented in the Table 8. As the popped gorgon nut flour increased in the blend, the onset temperature decreased. Onset temperature of different composite blends ranged between 39.49°C to 41.37°C. Granfeldt et al. (2000) reported a decrease in To and ΔHgelfor roasted oat and steamed barley flakes. The peak (TP) temperature of the wheat flour was reported as 74.23°C. As the popped gorgon nut flour increased in the blend, TP decreased. Peak temperature of different composite blends ranged between 73.60°C to 67.75°C. The popping leads to gelatinization of the starch, which agrees with the observed decrease in Tp with increase in the popped gorgon nut flour in wheat flour because starch crystallites are already melted/gelatinized in the popped flour. As the popped gorgon nut flour increased in the blend, Tc decreased. As the popped gorgon nut flour increased in the blend, ∆H provided an unclear trend. ∆H of different composite blends ranged between 60.76 J/g to 142.50 J/g. Khunae et al. (2007) reported increase in To and decrease in ΔHgel of rice starches upon hydrothermal treatment.
Conclusion
packed bulk density and true density values. There was increase in water absorption index and water solubility index with increase in the substitution of popped gorgon nut flour. In functional properties, WAC and OAC values increased but foaming capacity of composite flour decreased with increase in the blending proportion. AWRC of wheat flour differs significantly from all blends of composite flour. All four types of SRC increased with increase in proportion of composite flour. In pasting properties, there was decrease in the peak viscosity, trough viscosity and breakdown viscosity as the substitution of popped gorgon nut flour increased in the composite flour. Peak temperature of different composite blends ranged between 73.60°C to 67.75°C. As the popped gorgon nut flour increased in the blend, conclusion temperature decreased.
References
AACC, 2000. Approved Methods of American Association of Cereal Chemists, 10th edition. American Association of
Cereal Chemist Inc., St. Paul, Minnesota.
Aboubakar, Njintang, Y.N., Scher, J. and Mbofung, C.M.F. 2008. Physicochemical, thermal properties and microstructure of six varieties of taro (Colocasia esculenta L. Schott) flours and starches. Journal of Food Engineering86: 294-305.
Adebowale, K.O. and Lawal, O.S. 2003. Foaming, gelation and electrophoretic characteristics of Macuna bean (Macuna pruriens) protein concentrate. Food Chemistry 83: 237-246.
Akintayo, E.T., Oshodi, A.A. and Esuoso, K.O. 1999. Effect of NaCl, ionic strength and pH on the foaming and gelation of pigeon pea (Cajanus cajan) protein concentrates. Food Chemistry66: 51-56.
Akubor, P.I. 2007. Chemical, functional and cookie baking properties of soybean/maize flour blends. Journal of Food Science and Technology44: 619-622.
Aryee, F.N.A., Oduro, I., Ellis, W.O. and Afuakwa, J.J. 2006. The physicochemical properties of flour samples from the roots of 31 varieties of cassava. Food Control 17:
916-922.
Cherry, J.P. and McWatters, K.H. 1981. Whippability an aeration. In: J.P. Cherry (ed.) Protein functionality of Foods, ACS Symposium series, American Chemical Society, Washington DC, p. 149.
Chinnaswamy, R., Hanna, M.A. and Zobel, H.F. 1989. Microstructural, physiochemical, and macromolecular changes in extrusion-cooked and retrograded maize starch. Cer Food Wor34: 415-423.
Colonna, P., Doublier, J.L., Melcion, J.P., Monredon, F. and Mercier, F. 1984. Extrusion cooking and drum
drying of wheat starch: Physical and macromolecular modifications. Cereal Chemistry61: 538-543.
Deshpande, H.W. and Poshadri, A. 2011. Physical and sensory characteristics of extruded snacks prepared from foxtail millet based composite flours. International Food Research Journal 18: 751-756.
Doublier, J.L., Colonna, P. and Mercier, C. 1986. Extrusion cooking and drum drying of wheat starch. Rheological characterization of starch pastes. Cereal Chemistry63:
240-246.
Duncan, D.B. 1955. Multiple range and multiple F-tests.
Biomet11: 1-42.
Emmanuel, C.A.I., Osuchukwu, N.C. and Oshiele, L. 2010. Functional and sensory properties of wheat (Aestivum triticium) and taro flour (Colocasia esculenta)composite
bread. African Journal of Food Science4: 248-253. Graham, D.E. and Phillips, M.C. 1976. The conformation of
proteins at the air-water interface and their role in stabilizing foam. In: Foams, B.J. Akers (ed.). Academic press, London.
Granfeldt, Y., Eliasson, A.C. and Bjorck, I. 2000. An examination of the possibility of lowering the glycemic index of oat and barley flakes by minimal processing.
Journal of Nutrition 130: 2207-2214.
Griffith, L.D., Castell-Perez, M.E. and Griffith, M.E. 1998. Effects of blend and processing method on the nutritional quality of weaning foods made from select cereals and legumes. Cereal Chemistry75: 105-112. Gunaratne, A. and Hoover, R. 2002. Effect of heat-moisture
treatment on the structure and the physicochemical properties of tuber and root starches. Carbohydrate Polymers49: 425-437.
Hermansson, A.M. and Svegmark, K. 1996. Developments in the understanding of starch functionality. Food Science and Technology Research 7: 343-353.
Hsu, C.L., Chen, W., Weng, Y.M., Tseng, C.Y. 2003. Chemical composition, physical properties and antioxidant activities of yam flours as affected by different drying methods. Food Chemistry83: 85-92.
Islam, M.Z., Taneya, M.L.Z., Din, M.S.U., Syduzzaman, M. and Haque, M.M. 2012. Physicochemical and functional properties of brown rice (Oryza sativa) and wheat (Triticum aestivum) flour and quality of composite biscuit made thereof. Agriculture 10: 20-28.
Jha, V., Barat, G.K. and Jha, U.N. 1991. A Nutritional evaluation of Euryale ferox Salisb (makhana). Journal of Food Science and Technology 8: 326-328.
Jones, D., Chinnaswamy, R., Tan, Y. and Hanna, M. 2000. Physicochemical properties of ready-to-eat breakfast cereals. World Food Safety45: 164-168.
Khunae, P., Tran, T. and Sirivongpaisal, P. 2007. Effect of heat-moisture treatment on structural and thermal properties of rice starches differing in amylose content.
Starch-Starke59: 593-599.
Kinsella, J.E. 1976. Functional properties of proteins in foods.
Critical Reviews in Food Science and Nutrition1: 219-280. Lii, C.Y., Tsai, M.L. and Tseng, K.H. 1996. Effect of amylose
content on the rheological property of rice starch. Cereal Chemistry 73: 415-420.
Lin, M.J.Y., Humbert, E.S. and Sosulski, F.W. 1974. Certain functional properties of sunflower meal products.
Journal of Food Science 39: 368-370.
Mariotti, M., Alamprese, C., Pagani, M.A. and Lucisano, M. 2006. Effect of puffing on ultrastructure and physical characteristics of cereal grains and flours. Journal of Ceramic Science 43: 47-56.
Mishra, R.K., Jha, V. and Dehadrai, P.V. 2003. ‘Makhana’. Directorate of Information and Publications of Agriculture, ICAR, New Delhi.
Moorthy, M. and Viswanathan, K. 2009. Nutritive value of extracted coconut (Cocos nucifera) meal. Research Journal of Agriculture and Biological Sciences 5: 515-517.
Narayana, K. and Narasinga Rao, M.S. 1982. Functional properties of raw and heat processed winged bean flour. Journal of Food Science47: 1534-1538.
Olkku, J. and Rha, C. 1978. Gelatinization of starch and wheat flour starch- a review. Food Chemistry 3: 293-317.
Padmashree, T.S., Vijayalakshmi, L. and Puttaraj, S. 1987. Effect of traditional processing on the functional properties of cowpea (Vigna cajan) flour. Journal of Food Science and Technology24: 221-225.
Paul, A.A. and Southgate, D.A.T. 1978. The composition of foods. McCance and Widdowson’s (4th edn.), H.M.
Stationery Office, London.
Quin, M.R. and Benchat, L.R. 1975. Functional property changes resulting from fungal fermentation of peanut flour. Journal of Food Science40: 475.
Raghuramula, N., Nair, K.M. and Kalyanasundaram, S. 1983. Food Analysis. In: A Manual of Laboratory Techniques. National Institute of Nutrition, ICMR, Hyderabad, India, pp. 31-136.
Saldivar, S.O.S. 2012. Cereal grain: laboratory reference and procedures manual. (1st edn.), CRC Press, Taylor and
Francis Group, FL, pp. 58-59.
Samejima, M., Irate, G.H. and Koida, Y. 1982. Studies on microcapsules I. Role and effect of coactivation inducing agent in the microcapsule of ascorbic acid by a phase separation method. Chemical and Pharmaceutical Bulletin 30: 2894-2899.
Sanchez, H.D., Gonzalez, R.J., Osella, C.A., Torres, R.L. and De la Torre, M.A.G. 2008. Elaboration of bread without gluten from extruded rice flour. Journal of Food Science 6: 109-116.
Sathe, S.K., Deshpande, S.S. and Salunkhe, D.K. 1981. Functional properties of lupin seed (Lupinus mutabilis) proteins and protein concentrates. Journal of Food Science47: 491-502.
Sathe, S.K., Desphande, S.S. and Salunkhe, D.K. 1982. Functional properties of winged beans (Psophocarpus tetragonolobus) protein. Journal of Food Science 47:
503-509.
Singh, S., Riar, C.S. and Saxena, D.C. 2008. Effect of incorporating sweet potato flour to wheat flour on the quality characteristics of cookies. African Journal of Food Science2: 65-72.
Singh, N., Sandhu, K.S. and Kaur, M. 2005. Physicochemical properties including granular morphology, amylose content, swelling and solubility, thermal and pasting properties of starches from normal, waxy, high amylose and sugary corn. Prog Food Biopoly Res 1: 44-54. Singh, U. 2001. Functional properties of grain legume flours.
Journal of Food Science and Technology38: 191-199. Skrbic, B. and Filipcev, B. 2008. Nutritional and sensory
evaluation of wheat breads supplemented with oleic-rich sunflower seed. Food Chemistry 108: 119-129. Sosulski, F.W. 1962. The centrifuge method for determining
flour absorption in hard red spring wheats. Cereal Chemistry 39: 344-350.
Vijayakumar, P.P. and Mohankumar, J.B. 2009. Formulation and characterization of millet flour blend incorporated composite flour. International Journal of Agriculture Sciences1: 46-54.
Wani, A.A., Sogi, D.S., Singh, P., Sharma, P., Pangal, A. 2012. Dough-handling and cookie-making properties of wheat flour–watermelon protein isolate blends. Food Biotechnology 5: 1612-1621.
![基於數字文本相關之語者驗證系統的研究與實作 (Study and Implementation on Digit-related Speaker Verification) [In Chinese]](data:image/gif;base64,R0lGODlhAQABAIAAAP///wAAACH5BAEAAAAALAAAAAABAAEAAAICRAEAOw==)