Vol.9 (2019) No. 2
ISSN: 2088-5334
An Improved Multi-layer Cooperation Routing in Visual Sensor
Network for Energy Minimization
Arif Ullah
#, Nazri Mohd Nawi
#,*, Muhammad Aamir
#, Asim Shazad
#, Sundas
Naqeeb Faisal
# #Faculty of Computer Science and Information Technology, Universiti Tun Hussein Onn Malaysia, 86400, Johor, Malaysia E-mail: *[email protected]
Abstract — Recent development on visual sensor networks (VSN) have shown the emergence of VSN as an important class of sensor-based distributed intelligent systems, with unique performance, complexity, and quality of service challenges. Furthermore, the popularity of VSN had attracted researchers and industries from many applications. Basically, VSN consists of a large number of low-power camera nodes, visual sensor networks support a great number of novel vision-based applications. The information provided by the camera nodes from a monitored site were collected data and processed in distributed and collaboratively. The use of multiple cameras in the network provides different views of the scene which enhances the reliability of the captured events. However, the cameras combined with the network's resource produce large amount of image data which require more energy consumption. Many research experts are working and publishing research papers on energy minimization in visual sensor network. However, there are no special attentions given by researchers on multi-layer cooperation routing in visual sensor network (VSN) particularly on the deficiency of forward-thinking innovation. This research proposed a new method that put forward the step and use (CO-VSN) multi-layer routing arrangement in visual sensor network. The performance of the proposed method is then compared with RASE protocol in different parameters and the result shows some meditation change in the stability of the network, increase the network life, reduce packet loss and energy drainage reduce in the VSNs. Even though, the RASE scheme used channel condition for movement of data and yet the proposed CO-VSN used cooperation and demonstrated better results.
Keywords— multi Cooperation; energy feeding; network stability; visual sensor network.
I. INTRODUCTION
Visual Sensor Networks (VSNs) is wireless networks that consist of tiny distributed wireless sensors and small battery-powered devices distributed among geographical areas to continuously collect data. Some of the VSNs-based applications are environmental monitoring, flood detection, and home automation. The collected data such as temperature, humidity, light conditions, and seismic activities are then sent to central units or base stations for processing, analysis, and decision making. Moreover, those data can be used to detect certain events and to trigger activities [1].
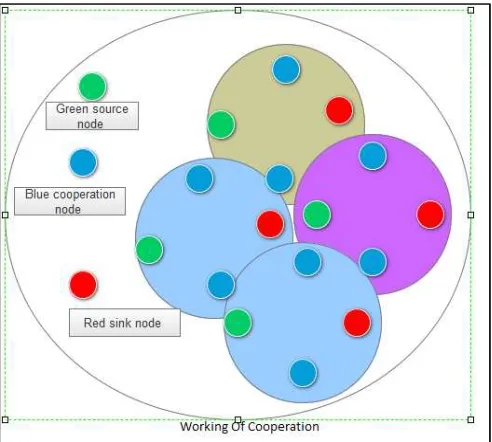
VSNs consists of different nodes installed in a large area to disclose the phenomenon of interest especially multiple-hop, ad-hoc and self-effecting and organizing network, on a large scale used for environmental, medical, military and scientific application as can be seen in Figure 1. The sensor nodes are used to detect a phenomenon and base nodes which have the responsibility to manage the network and collect the information data from the remote nodes. Also, some factors influence the design of this network such as
scalability, tolerance, operation systems, hardware constraints, sensor network topology, and consumption and transmission media.
Fig.1 Visual sensor network
consumption. In 2012 Clement et al. [2] proposed RASE protocol in the visual sensor network where the design protocol forwards the data to find a path, or it also called dynamic path selection. However, due to this property, a result showed that more energy was used for this method. In 2016, Ploumidi et al. [3] proposed a protocol known as DARE in which this scheme developed cluster for a specific number for forwarding data. Moreover, if the specific number of energy does not remain then the energy loss in the network can be worst. Walikar and Biradar [4] in 2017
designed a protocol known as SIMPLE which proposed a single relay node at a single sink node. However, the proposed method had lost energy in a short period. Therefore, the authors suggested using a mathematical formula with a single node strategy to balance up energy level and stability period of the network the problems.
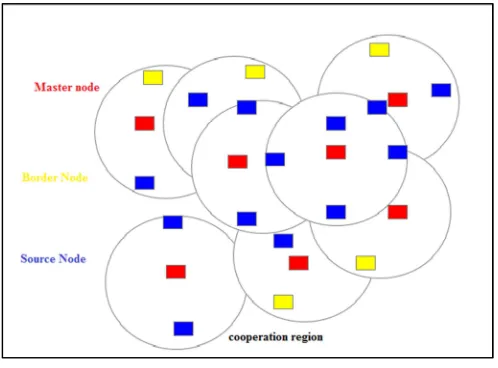
Usually, cooperation is the process of resending the message to the sink node. However, if the message does not reach the sink node accurately, then the relay re-sends the message without affecting the other node in the session. Traditionally, cooperation communication has two types which are a point to point and point to multipoint. Whenever sender node sends the message to nearest node and as well as to the relay node, or when data sent from source to destination and it did not appropriately reach, then rely on node re-send the data again. This process is known as cooperation [5]. While in the field of Cooperation mobile sensor networks [6] proposed iterated extended Kalman filter (IEKF) for the purpose to reduce the predictable energy cost of EKF algorithm. In 2017, Niculescu et al. [7] minimized the ICT infrastructure, as well as they, reduce the energy consumption by the network of smart devices and sensors that motivates the improvement of applications and e-services for several areas such as tourism, education, transportation, building management, local business, health services, etc. Figure 2 shows how cooperation works in a visual sensor network.
Fig. 2 Cooperation in a visual sensor network
There will be different phases involved used in, and the complete process of cooperative routing can be accomplished in two stages. In the first stage, the source node (s) transmitted the data to both node relay (R1, R2, R3, Rm) and sink node (D) at the same time. In the above case, if the data did not reach properly, then the relay node re-send the data to the sink node (D) again using a relay node. Figure 3 shows the working of the cooperation phase which has been proposed by Nasir et al. [8].
Fig.3 Phases of cooperation
Table 1 shows the different notations which are used for designing equations in this paper. The accept signal at relying on and end points are mathematically articulated as proposed by [9].
TABLEI NOTATION USED IN CO-VSN
( )
( )
SD SD S
f
t
=
h v t
+
z
(1)( )
( )
SR SR R
f
t
=
h v t
+
z
(2)( )
( )
SD SR D
f
t
=
h v t
+
z
(3)Where i, j=0 and G is the amplification factor using MRC, the signal at is given as:
1
( )
( )
D SD D
f t
=
f v t
+
f
(4)F = functions V = Transmitted signal
Z=Channel noise P = Phase
S = sink node D = Destination
R = Rely node R = {R1, R2 Rm}
P0 = Threshold X = Range
The above equations show the availability of the relay node in the network. In the development phase, there will be multiple paths that have been established between sources to destination especially when a node finds neighbors node. The primary objective of the path development phase is to find out the neighbors node. In order to find a multi-relay node, these nodes work as a cooperative node of data retransmission as stated by Almalkawi et al. [10].
The source node (S) is used to find his neighbor node with the help of depth information from the other node. In forwarding neighbor method (FN), those nodes are selected based on depth-first from another neighbor node (FN) in the list of (FN). According to this method, nodes that are a potential candidate for the next nope or skin node are then selected [11] after the development phase occurred when the master node selection process started.
Energy efficient depth based routing (EEDBR) is the algorithm used for the selection of the master node. This algorithm selects (FN) and a master node for the next node destination with less residual energy and less depth [12]. Moreover, master node selection can be performed in each cooperative region.
The nodes which are in the cooperative region is used for the selection of identifier relay, and with the help of these nodes, the master node is selected. The full process is shown in Figure 4. The nodes in this region are known as cooperative nodes. However, both nodes work as cooperative nodes and therefore R1, and R2 must contain the highest residual energy and minimum depth path. This process continues until the network life ends. Also, when cooperation defines in each Region of the network, then data transmission phase occurs.
Fig. 4 Cooperation region
In the data transmission phase, there are two main types of telecommunication which are digital and analog. The analog signal is affected by signal noise ratio that is represented as SNR where SNR is used to measure the ratio between the power of background noise and power of the signal. In SNR, the signal is represented from S, and noise is represented from P [13].
The signal to noise ratio can be express in logarithmic form as below:
10 10 / (5)
In the relay node, re-transmission of data in the cooperation region happens whenever the direct transmission has less SNR then XOS. A and D are normally called cooperation communication region or transmission region, and the maximum number of re-transmission depends on the number of relays present in the cooperative region, and it will be represented in an equation like this area = (A) and density = (P). ND=Node/A [19] [14]. In data transmission, it first checks the number of available relays and then starts data transmission. Also, the transmission range (x) in the cooperation region is calculated as.
2 - ds Dsd 2 2
A = 2 x c 0s 1( ) - 4 x - d (6) 2 x 2
Figure 4, shows that the two sensor transmission ranges are overlapping in the same transmission range. In order to find the overlapping region, we used SEG and the sector area is given under as follows [15]:
sector
area =
x 2
(7)
2
of
θ
The radians sector of angle is θ and to a fine of the θ SEG triangle is used the scales triangle with a height of Dsd/2 and used half identity as can be seen in Figure 5.
Fig. 5 8 outage Probability
sd sd
x
q D / 2 D
cos( ) = = (8)
2 x 2
sd
x
D we get = 2 arc cos-1 (9)
2
θ
θ
Putting Equations 6 and Equations 9 then we get:
SD SD
cos 1
X X
2
d d
= 2 arccos1( X 2 arc ( ) (10)
2 2
OUT R SR 1 D O m
i=1 (11)
P
= X (
X
+ X
≤
X
We used Pythagorean Theorem to find OSE right triangle OE. 2 2 (12) 4 SD
OE= X −d
Once, when we get OSE right triangle OE, then we can find the number of data at the sink node or commonly known as outage probability. The outage process is known as accessibility of signal D. Sun, P. [16]. In which for any given model the outage ensure that the course new cast along with all the retransmission fails to the expected threshold D.
II. MATERIAL AND METHOD
The most important support operation that is included in this phase is the coordination stage and cooperative transmission phase. In the coordination, they obtained directly from intercommunication or user feedback from the floor may be there are multi-relay protocols or math model are based on technique Cardona et al.[17]. In this research, we proposed to use Decode-and-Forward relay strategy. In which, in this strategy, the relay node decoded the received message from the source during the broadcast phase. This step must be done before sending forward step to the destination. After the successfully decoding, the received signal is forward to the destination by the relay, and there will be no amplifier noise received to the signal. For this process, the relay can cause a hard decision because there is no extra information available. At the end of the destination, relay recorded the information and then sent to the sink node [18].
The formula and equation for decode and forward relay strategy, p denote the transmit power and for each relay node I, the received signal is
Ph
i and adding powerα
i
portion ofPh
i iα that are used in information coding, and the power of relay is equal toPh
i(i -α). The whole equation is described below.min
(13)
DFi HI
SNR P i
i r
α
α
=
2 ( ( ) ) (14)
DF Hi
SNR =I Rε P i−αI gi
For forwarding process the data to the destination node where D that yrd =A (Ysr) p1 and p2 is show at the R and S factor of α can be express as:
Pr (15)
| d( R| ( )2F s
P T S N
α =
+
Gain is known as the channel state information (CSI) or assisted of relay gain. For this purpose, the relay gain node requires valuing the instant of various information channels for the SR effect of the channel.
r
(16) | d( R| ( )2F
E Es T S N
α=
+
For fading indecent time N and α are expressed below.
r
(17) | d( R| ( )2F
E
Es T S N
α =
+
Receiving a signal of D in phase 2 is written as:
2 (18)
SD h DB RD
T
Y = P R XsN
2 RD R (19)
RD D
T
P h BxsN
Y =
In the analysis method, the decoded for a receiver where Pt2 are used for the power of R, S and these are maintained different power from Ps and PR [19]. When signals are combining at the destination, this process is known as combining strategy. There are different methods of combining strategy available; however, for this purposes, we use one of them that is known as maximum ratio combining (MRC) [20].
In telecommunication, MRC is the process of diversity in the combining step in which the signal is added from a different channel, and the gain of an individual channel is made of proportional to the RMS signal level; these are inversely proportional to means square of the noise level channel. The maximum ratio of combining triumphs is the best possible performance with the multiplication of each acknowledges signal with his corresponding conjugated channel gain. The channel state information (CSI) is available at the receiver side [21].
The main advantage of maximum ratio combining is that is can produce the best possible performance due to multiplying each an individual with his corresponding conjugated channel gain. It assumes that the receiver perfectly knows the channel phase shift and attention. Moreover, the main advantage of this proposed method is that multi-hope environment can see and it considers the last hope of multi-hope link.[22].
III.RESULTS AND DISCUSSION
For simulation purpose, we used MATLAB programming language since it has high-performance language and it is used for technical computing. The programming environment consists of modern language and supporting the objective environment. The main parameters which are comparing our proposed scheme with previous scheme are giving below.
• Residual energy: The energy remains after comprehensive one cycle of the network.
• IAlive Node: The remaining node of the network after completing its one cycle.
• Dead Node: After completing its first round, the total number of a live node story about the number of the dead nodes.
In this research work, we performed a different kind of simulation to measure the performance of the proposed protocol CO-VSN, and we compare it with the existing protocol known as RASE. The simulation work performed by using MATLAB200b and the network location consists of 100 × 100 Msq. There were 30 nodes are arbitrarily arranged.
There were 6000× 8000 rounds with the base stations in the center of the network. In the relay technique, there was a decade and forward technique that is used with combinations of strategy MRC. Node initial energy power =0.5 j energy for broadcast =50*. 0001j. After the simulation process, we get a result in the graphic form that is known as NAM file. The major parameters which are compared with the exciting protocols are discussed below.
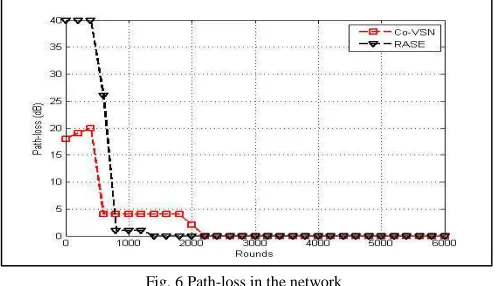
Fig. 6 Path-loss in the network
Figure 6 shows the total number of path loss in the network. This is mainly due to those data that did not reach the destination properly.
TABLEII PATH-LOSS IN THE NETWORK.
PROTOCOLS RASE CO-VSAN
Round 2000 100 49
Round 4000 49 68
Round 600 28 54
Round 800 28 54
Round 1000 25 54
Round 1600 19 54
Average 37.28 50.71
TABLEIII LIVE NODES IN THE NETWORK.
PROTOCOLS RASE CO-VSAN
Round 2000 34 22
Round 4000 40 4
Round 600 9 5
Round 800 6 4
Round 1000 8 4
Round 1600 5 4
Average 34 22
Table 2 demonstrates the number of path loss occurs in different rounds from first to the last round in the RASE
small number because there is some round where no path loss occurs. Therefore CO-VSN is better than the existing protocol.
Fig. 7: Alive nodes in the network
Figure 7 shows the alive number node in the network and Table 3 show the different value of an alive node in the network. The result consists of two protocols which are CO-VSAN and RASE protocols and collected form starting round and up to the final round. According to that result, CO-VSN is better working then RASE because the number of an alive nodes are greater then RASE protocols.
Fig. 8 Number of dead nodes
Figure 8 shows that the number of dead node in the network during the process of the network. Again, the network consists of two protocols which are Co-VSN and RASE protocols.
TABLE IV NUMBER OF DEAD NODES
PROTOCOLS RASE CO-VSAN
Round 2000 12 0
Round 4000 51 32
Round 600 72 46
Round 800 75 46
Round 1000 7 4
Round 1600 88 59
From the above Table 4, the immovability period of the network is shown. The network stability period ends when the first node of the network dies. According to the data collection, its show that proposed protocol CO-VSAN is working better than RASE protocols.
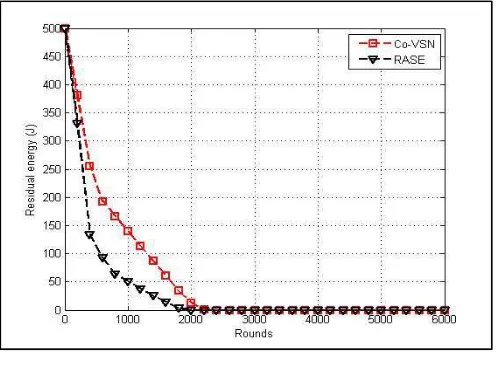
Fig. 9 Residual Energy
Figure 9 shows the result of residual energy between the two protocols which are RASE and CO-VSAN.
TABLEV RESIDUAL ENERGY IN NETWORK
PROTOCOLS RASE CO-VSAN
Round 2000 12 0
Round 4000 54 32
Round 600 72 67
Round 800 75 56
Round 1000 88 78
Round 1600 16 59
Average 12.3 16.23
For the simulation purpose, we use the same initial energy which is 0.5 Joule for the network. According to the result from Table 5, the energy level of CO –VSAN protocol is better than the RASE protocol. At last round, the remaining energy in RASE protocol is 2.01 and CO-VSN is 2.70. It means the design saved the energy 0.69 more than RASE protocol.
IV. CONCLUSION
In this research, we designed and proposed a routing scheme know as multi CO-VSN in the visual sensor network and compare the performance with the existing scheme known as RASE. Since the RASE scheme depends on the channel condition. It also depends on the path where it sends the data or sends a packet to a different level where there is no cooperation used. However, due to the multi cooperation CO-VSN, the method manages the load balance in the network and improves the network life as well as stability, reduce packet loss and reduce energy consumption. These are the main future of CO-VSAN which makes it more powerful method to use in a visual sensor network. In the upcoming study, we are planning to explore our multiple CO-VSN in a distributed application and unstructured sensor networks where it can reduce the energy and increase the
network lifetime. Furthermore, we will also compare the hardware solution, management issue and developing strategy in the visual sensor network.
ACKNOWLEDGMENT
The authors would like to thank Universiti Tun Hussein Onn Malaysia (UTHM) Ministry of Higher Education (MOHE) Malaysia for financially supporting this Research under Trans-disciplinary Research Grant Scheme (TRGS) vote no. T003. This research also supported by GATES IT Solution Sdn. Bhd under its publication scheme.
REFERENCES
[1] Akyildiz, I. F., Melodia, T., & Chowdhury, K. R. (2007). A survey on wireless multimedia sensor networks. Computer networks, 51(4), 921-960.
[2] Clement, J., Novas, N., Gázquez, J. A., & Manzano-Agugliaro, F. (2012). High-speed intelligent classifier of tomatoes by color, size, and weight. Spanish Journal of Agricultural Research, 10(2), 314-325.1
[3] Ploumidis, M., Pappas, N., & Traganitis, A. (2016). Tofra: Throughput optimal flow rate allocation with a bounded delay for random access wireless mesh networks. IEEE Transactions on Vehicular Technology.
[4] Walikar, G. A., & Biradar, R. C. (2017). A survey on hybrid routing mechanisms in mobile ad hoc networks. Journal of Network and Computer Applications, 77, 48-63. 5555
[5] Chen, Zhigang. Energy-efficient information collection and dissemination in wireless sensor networks. Diss. University of Michigan, 2009.
[6] Rafina Destiarti Ainul, Prima Kristalina and Amang Sudarsono, "Modified Iterated Extended Kalman Filter for Mobile Cooperative Tracking System," International Journal on Advanced Science, Engineering and Information Technology, vol. 7, no. 3, pp. 980-992, 2017.
[7] Niculescu, A. I., Wadhwa, B., & Quek, E. (2016). Smart City Technologies: Design and Evaluation of An Intelligent Driving Assistant for Smart Parking. International Journal on Advanced Science, Engineering and Information Technology, 6(6), 1096-1102. [8] Nasir, H., Javaid, N., Sher, M., Qasim, U., Khan, Z. A., Alrajeh, N.,
& Niaz, I. A. (2016). Exploiting Outage and Error Probability of Cooperative Incremental Relaying in Underwater Wireless Sensor Networks. Sensors, 16(7), 1076. 8888
[9] Agah, A., Das, S. K., & Basu, K. (2004, September). A non-cooperative game approach for intrusion detection in sensor networks. In Vehicular Technology Conference, 2004. VTC2004-Fall. 2004 IEEE 60th (Vol. 4, pp. 2902-2906). IEEE.
[10] Almalkawi, I. T., Guerrero Zapata, M., Al-Karaki, J. N., & Morillo-Pozo, J. (2010). Wireless multimedia sensor networks: current trends and future directions. Sensors, 10(7), 6662.
[11] Ai, F., Comfort, L. K., Dong, Y., & Znati, T. (2016). A dynamic decision support system based on geographical information and mobile social networks: a model for tsunami risk mitigation in Padang, Indonesia. Safety science, 90, 62-74. 7777.
[12] Wahid, A., Lee, S., Jeong, H. J., & Kim, D. (2011). Eedbr: Energy-efficient depth-based routing protocol for underwater wireless sensor networks. Advanced Computer Science and Information Technology, 223-234.
[13] Akyildiz, I. F., Su, W., Sankarasubramaniam, Y., & Cayirci, E. (2002). Wireless sensor networks: a survey. Computer networks, 38(4), 393-422.
[14] Baseer, S., & Umar, S. (2016, August). Role of cooperation in energy minimization in the visual sensor network. In Innovative Computing Technology (INTECH), 2016 Sixth International Conference on (pp. 447-452). IEEE.12123.
[15] Abolhasan, M., Wysocki, T., & Dutkiewicz, E. (2004). A review of routing protocols for mobile ad hoc networks. Ad hoc networks, 2(1), 1-22.
[17] Cardona, N. (Ed.). (2016). Cooperative Radio Communications for Green Smart Environments. River Publishers.2223.
[18] Popovski, P., & Koike-Akino, T. (2009). Coded bidirectional relaying in wireless networks. In New Directions in Wireless Communications Research (pp. 291-316). Springer US.77889. [19] Scaglione, A., Goeckel, D. L., & Laneman, J. N. (2006). Cooperative
communications in mobile ad hoc networks. IEEE Signal Processing Magazine, 23(5), 18-29.
[20] Barbulescu, S. A. (1996). Iterative decoding of turbo codes and other concatenated codes (Doctoral dissertation, University of South Australia). 1515.
[21] Ahmed, S., Javaid, N., Khan, F. A., Durrani, M. Y., Ali, A., Shaukat, A., & Qasim, U. (2015). Co-UWSN: cooperative energy-efficient protocol for underwater WSNs. International Journal of Distributed Sensor Networks, 2015, 75.