JOGCE
The New Capillary Number Parameterization for Simulation in
Surfactant Flooding
Mustapha Abdullahi
School of Chemical Engineering and Analytical Science, University of Manchester, Manchester M13 9PL, UK Email: [email protected], Tel: +447388119656
The Capillary number hypothesis is very empirical in Surfactant flooding Enhanced Oil Recovery (EOR) method. which is of modest experience on the North Sea and many other offshore platforms. The capillary number drives the force wetting processes, which is controlled by the balance between capillary and viscous forces. The mobilization of oil trapped in pores of water-wet rock is steered by capillary number that is typically within specific ranges (𝟏𝟎−𝟓 to 𝟏𝟎−𝟒).
There is high uncertainty and confusion in the parameterization of capillary number formula, as every quantity is given on a macroscale level. As demonstrated herein, a new microscopic capillary number parameterization was proposed. This paper is written to improve the numerical formulation of capillary number in surfactant flooding model. The new formula for capillary number was derived based on existing equations as a function of residual oil saturation and tested. Thus, the proposed mobility mechanism easily accounts for a broader critical range of capillary number (𝟏𝟎−𝟔 to 𝟏𝟎−𝟒) in comparison with available models with a critical capillary
number (𝟏𝟎−𝟓 to 𝟏𝟎−𝟒). We used an existing model to quantify the effect of capillary number on
a miscible and immiscible relative permeability curves by computing the interpolation parameter
𝑭𝒌𝒓 as a tabulated function of the Logarithm (base 10) of the capillary number using a new
capillary number formulation.
Keywords: Critical capillary number; Capillary number; capillary desaturation; miscibility; Interpolation parameter.
INTRODUCTION
Up to two-thirds of the crude oil remains trapped in the reservoirs after primary and secondary recovery in an average oil reservoir (Yan and Qiu, 2016). EOR is then required to optimise the depletion, as the remaining oil is trapped in the pore structure of the reservoir.
The fluid flow in porous media is mainly governed by three forces: gravitational force, viscous force and capillary forces. These three forces are integrated through the Capillary number (𝑁𝑐) and the bond number (𝐵𝑜) defined
by:
𝑁𝑐=
𝑢𝜇 𝜎
(1)
𝐵𝑜=
∆𝜌𝑔𝑑2
𝜎
(2)
𝑢 is Darcy’s velocity, µ is the viscosity of the displacing fluid, 𝜎 is the interfacial tension between oil and the surfactant solution, ∆p is the density difference between the phases, g is acceleration due to gravity and d is a characteristic dimension taken here as the pore diameter.
The role of interfacial tension and capillary number in a dynamic air-liquid interface during an immiscible fluid displacement flow driven by pressure was investigated by Yan & Qiu (2016). The critical capillary number was studied analytically, and they derived the theory regarding the critical capillary number with the wettability effect in a pressure-driven capillary tube. Their results show that the critical capillary number is associated with the contact angle, slip length and capillary radius. Basante (2010) conducted a laboratory experimental work using two sandstone cores to demonstrate the effect of capillary
Journal of Oil, Gas and Coal Engineering
Vol. 3(1), pp. 023-033, August, 2018. © www.premierpublishers.org.
ISSN
: 0767-0974
Abdullahi M. 024
number on mobility control. The result of the experiment shows that raising the flow rate by a factor of 10 (0.03ml/min to 0.3 ml/min) will decrease the oil recovery factor considerably. The water-oil relative permeability characterises two-phase flow, and it’s difficult to determine the functional form in a reservoir study. The addition of various chemical agents (For example, Surfactant) during chemical flooding in oil production will significantly change the interfacial tension and increase the degree of difficulty in measurement. Shen et al. developed an improved method of measuring water-oil relative permeability curves, shown that the relative permeabilities of both water and oil phases will increase with decreasing interfacial tension (Shen et al., 2006).
A logarithm relationship exists between water-oil two-phase relative permeability and interfacial tension (Shen et al., 2006).
Base on several experiments, relative permeability is considered as a function of saturation, interfacial tension, and properties of core pore only (Shen et al., 2006).
𝐾𝑟𝑤 = 𝑚𝑤(𝑆𝑤∗)𝑛𝑤
(3)
𝐾𝑟𝑜= 𝑚𝑜(1 − 𝑆𝑤∗)𝑛𝑜 (4)
where 𝑚𝑤and 𝑚𝑜are coefficients of water and oil relative
permeability functions respectively
Note that 𝑚𝑤is the water relative permeability at 𝑆𝑤∗ =
1 and 𝑚𝑜 is the oil relative permeability at 𝑆𝑤∗ = 0,
respectively.
By definition above,
𝑚𝑤= (𝐾𝑟𝑤∗ )𝑆𝑜𝑟
(5)
𝑚𝑜= (𝐾𝑟𝑜∗ )𝑆𝑤𝑐 (6)
Therefore the normalise formula can be derived from the two relative permeability equations above:
𝐾𝑟𝑤∗ = (𝑆𝑤∗)𝑛𝑤 (7)
𝐾𝑟𝑜∗ = (1 − 𝑆𝑤∗)𝑛𝑜 (8)
The exponential indexes, 𝑛𝑤 𝑎𝑛𝑑 𝑛𝑜 are found to be related
to interfacial tension and the pore size distribution parameters, 𝜆𝑤 and 𝜆𝑜 (Brooks and Corey, 1964), as
𝑛𝑜= 𝑛𝑜(𝜎𝑤𝑜,𝜆𝑜) (9)
𝑛𝑤= 𝑛𝑤(𝜎𝑤𝑜,𝜆𝑤) (10)
A particular relation between exponential constants and interfacial tension was derived, and the two-phase relative permeability model from the relative permeability equations above has the form(Shen et al., 2006):
𝐾𝑟𝑤∗ = (𝑆𝑤∗)[𝑜.9371.𝑙𝑜𝑔(𝜎𝑤𝑜)+𝜆𝑤] (11)
𝐾𝑟𝑜∗ = (1 − 𝑆𝑤∗)[0.1960.𝑙𝑜𝑔(𝜎𝑤𝑜)+𝜆𝑜] (12)
where 𝜆𝑤 and 𝜆𝑜are constants for water and oil relative
permeability, respectively, for the same rock type. With the sandstone cores associated with the fluids in Shen’s experiment, the curve fitting of the experimental data leads to 𝜆𝑜=2.006 and 𝜆𝑤=3.807 (Shen et al., 2006).
Xu et al. (2011) conducted experiments to determine the surfactant’s performance, such as the relationship between surfactant concentration and oil/water interfacial tension and the relationship between the surfactant concentration and the water viscosity. Their results show that oil/water interfacial tension will decrease as the surfactant concentration increase, surfactant flooding has the capacity of enhancing oil recovery. Their results show that the optimum surfactant concentration is 2%, which can improve oil recovery by the percentage of 0.22. Ren et al. (2018) used both numerical and analytical method to characterise the migration, trapping and accumulation of 𝐶𝑂2 in a saline aquifer during geological sequestration.
They used a 1D two-phased-flow model and solved the model equations using the method of characteristics. Their results demonstrated that the 𝐶𝑂2accumulated by
permeability hindrance is greater than that accumulated by capillary trapping.
Alquaimi et al. (2018) proposed a new capillary number definition for fractures that depends on force balance and incorporates geometrical characteristics of the fracture model. They conducted an experimental desaturation procedure to test their capillary number definition and quantify the relationship between the pressure and trapped ganglions. Bryan & Kantzas (2009) performed core flooding experiments to investigate how Alkali-Surfactant flooding can lead to improved heavy oil recovery. It was determined from their results that the performance of surfactant alone was not sufficient to emulsify oil, but can only increase the water-wetting of the glass, but the combination of alkali and surfactant can reduce the oil-water interfacial tension and oil/water emulsions will be produced. Furthermore, their results show that the mechanism of emulsification and entrainment, which occurs during high rate flow in lower permeability cores is not as efficient in recovering additional oil.
Laforce et al. (2008) used analytical solutions to study the development of multi-contact miscibility in simultaneous water and gas (SWAG) injection into a reservoir, they considered the application of 𝐶𝑂2 storage in enhanced oil
recovery using a fully compositional one-dimensional and three-phase flow through porous media. Their results demonstrate that miscibility does not develop when the fraction of water in the injection mixture is sufficiently high and define the minimum gas fraction necessary to achieve miscibility and highlights the importance of improved relative permeability models.
J. Oil, Gas Coal Engin. 025
by numerical simulations of homogeneous and heterogeneous models. Their results show that the positive effect of gravity segregation is that the oil floats up, accumulates under low permeable rocks and thereby increases the effective horizontal oil mobility. They found the magnitude of the incremental oil production to increase with increasing curvature of oil relative permeability. Hence, the positive effect of decreasing IFT is larger in mixed-wet formation than in water-wet formations. Keshtkar et al. (2016) developed an explicit composition and explicit-saturation method to study surfactant flooding sensitivity analysis on an oil production reservoir. Their results show that the addition of surfactant causes a reduction in IFT between water and oil phases and subsequently will trigger the mobility of the trapped oil and increase the oil production level.
Felix et al. (2015) carried out various experiments to implement surfactant polymer flooding. Different slugs were injected after water flooding, and their results showed different displacement efficiencies based on the mechanism chosen for the implementation of the surfactant polymer flooding. These experiments revealed the importance of selecting the right tool for the surfactant flooding as to optimise recovery. Xavier. (2011) experimentally determined the influence of surfactant concentration on hydrocarbon recovery. The interfacial tension between brine and kerosene was studied with the use of sodium dodecyl sulphate (SDS) as a means of reducing the interfacial tension. His findings were that the IFT decreases as the surfactant concentration increases and reaches a point of critical micelle concentration (CMC). Thus was able to find a critical surfactant concentration at 0.3 wt% of the surfactant.
Cheng et al. (2005) presented results on developed miscibility by gas injection in petroleum reservoir with the aim to define a minimum miscibility pressure (MMP) for the fluid system. He proposed a method for the optimum number of grid cells and time step size for numerical simulation models and verified 1D first-contact miscibility displacement. Khanamiri et al. (2015) conducted laboratory surfactant flooding experiments with aged sandstone cores, surfactant sodium dodecylbenzene sulfonate was used at a concentration of 0.05wt% and 0.2wt% to enhance oil recovery. The result shows the effect of surfactant concentration on Interfacial tension i.e. decrease in IFT with an increase in surfactant concentration. They discovered that the low salinity surfactant flooding with 0.2wt% surfactant concentration did not result in higher oil recovery that the flooding with 0.05wt% surfactant concentration in tertiary low salinity surfactant injection. This is because the tertiary low salinity surfactant injection after secondary low salinity water injection is more efficient than the tertiary surfactant injection where the surfactant is injected after high salinity (secondary) and low salinity water (tertiary) injection.
Whitson et al. (1997) proposed a mathematical formulation for relative permeability and the interpolation function for a Gas-oil system as a function of the capillary number:
𝐹𝑘𝑟 = 1 − [(𝛼𝑁𝑐)𝑛+ 1]−1 (13)
Where 𝑛 ≃ −0.75 seems to fit data they conducted by laboratory measurements. The scaling parameter α is used to fit the measured data.
Thus, by referring to the latest previously published literature on the miscibility development in surfactant flooding, it can be concluded that the capillary number and the interfacial tension plays a vital role in accurately predicting miscibility in Surfactant flooding to enhance oil recovery. The previous literature has not critically evaluated the mobility components as a function of the miscibility level between surfactant, water, and oil, most of the research and discussion conducted in the literature are focused on miscibility in gas and oil system. Therefore is need to come up with a numerical model that will accurately give a clear picture of the transport components as a function of miscibility and various formulations in surfactant-water and oil system.
METHODOLOGY AND MODEL SETUP
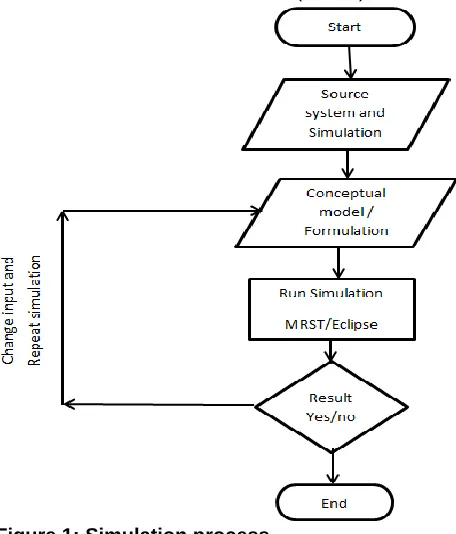
Reservoir simulation is a useful tool for estimating the future behaviour of petroleum fields. In some cases, it can also be used for identifying particular phenomena in a specific task. In this study, the investigation was performed using numerical simulation experiments. New formulation for the capillary number was derived. And Eclipse Black Oil model with surfactant option was used for simulating the displacement process to see the effect of off surfactant and to test the transport mechanism which was derived as shown in Figure 1. Another simulation was conducted to validate the implementation of surfactant flooding using Matlab Reservoir Simulation Tool (MRST).
Abdullahi M. 026
1. Proposed new capillary number equation
Capillary pressure relationship is expressed by a single dimensionless function known as the Leverett Number (Leverett, 1941):
𝑁𝐿𝑒 =
𝑃𝑐
𝜎𝑇(𝜃)√ 𝐾
𝜙 (14)
by defining 𝑇(𝜃) as:
𝑇(𝜃) = 𝑃𝑐(𝑆)𝑟𝑛
2𝜎 (15)
In a cylindrical oil mass of average radius a, the average length as proposed by (Stegemeier, 1974) is:
𝐿 = 2𝜎
𝑎𝛻𝜙 (16)
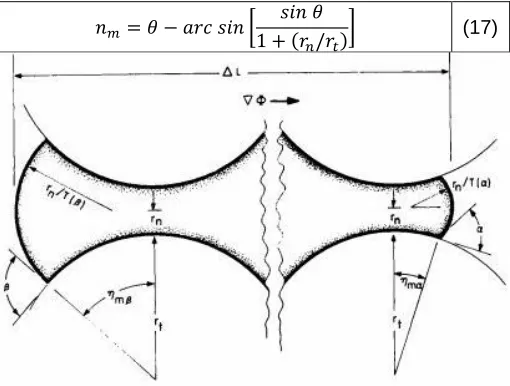
In the case of wetting phase trapping, residual fluid is held in rings, interconnected with only thin water layers as described by Basante (2010). The geometrical factor for the contact angle interface passing through the pore is:
𝑇(𝜃) = 𝑐𝑜𝑠(𝜃 − 𝜂) 1 + (𝑟𝑡/𝑟𝑛)(1 − 𝑐𝑜𝑠𝜂)
(16)
𝑇(𝜃) is the pore shape wetting factor, The maximum interface curvature exists at 𝑛𝑚 Basante (2010) is given as:
𝑛𝑚= 𝜃 − 𝑎𝑟𝑐 𝑠𝑖𝑛 [
𝑠𝑖𝑛 𝜃 1 + (𝑟𝑛/𝑟𝑡)
] (17)
Figure 2: MultiPore Model
For a nonwetting immobile (Oil) phase such as that shown in figure 2 above, a force balance demonstrating the oil will be displaced if the applied pressure exceeds the net restraining capillary pressure as proposed by (Stegemeier, 1974):
∆𝑃𝐴= 𝛻𝛷 . ∆𝐿 ˃
2𝜎 𝑟𝑛
. 𝜓 = ∆𝑃𝑐
(18)
The applied potential gradient is defined as:
𝛻𝛷 =𝑑𝑝
𝑑𝐿+ ∆𝜌𝑔(1 + 𝐺) (19)
The first term is the applied pressure gradient and the second contains gravity and other acceleration terms. The LHS of inequality is comprised of the pressure gradient and length of the alternative flow path around the trap and can be defined as a dimensionless length regarding the pore entry radius:
𝑚 = ∆𝐿/𝑟𝑛 (20)
The geometrical factor ψ for the interface front with an advancing angle α and receding angle β is similar to that given by Melrose and Brandner (Melrose, 1974):
𝜓 = 𝑇(ά) − 𝑇(𝛽)𝑟
𝑏
𝑟𝑛
⁄ (21)
𝑟𝑏
𝑟𝑛
⁄ is the pore body/ pore neck radii, 𝑟𝑏⁄ 𝑟𝑛is comparible to the Difficulty index by (Dullien et al., 1972) and its defined as:
𝐷 = [1 𝑟𝑛
−1 𝑟𝑏
] ∫ ∫ 𝛼{𝑟𝑏, 𝑟𝑛}. 𝑑𝑟𝑛 . 𝑑𝑟𝑏 0
𝑟𝑏 0
∞
(22)
The difficulty index D is an index measuring the difficulty of recovering waterflood residuals in tertiary surfactant flooding.
For special cases of 𝛼 = 𝛽 = 0, 𝜓 = 𝑟𝑛[(1/𝑟𝑛) − (1/𝑟𝑏)].
The fluid-rock only partially describes the structure of the rock k; the pore inlet size distribution can be express by combining Eq (14) and eq (15):
𝑟𝑛(𝑆) = 2√𝐾/𝜙 𝑁𝐿𝑒(𝑆)
(23)
Substituting equation Equations (21), (22) and (24) into equation (19) gives
[ 1 𝑁𝐿𝑒2(𝑆)
] . [ 1
𝜓(𝑆)] . [2𝑚(𝑆)] . [ 𝐾 𝜙
𝛻𝛷 𝜎 ] ≥ 1
(24)
m= dimensionless alternative part length (a dimensionless length regarding the pore entry radius).
We can define the dimensionless length of the entire multi-pore trapped oil mass as:
𝑓 =∆𝐿 𝑎
(25) where a is the average radius of trapped oil mass.
When equation (26) is combined with equation (16) an expression for the alternative flow path regarding interfacial tension and the pressure gradient is:
∆𝐿 = √2𝜎𝑓 𝛻𝛷
(26)
By using equation (21), (24) and (27), The dimensionless flow path will be given as:
𝑚(𝑆) = [𝑁𝐿𝑒(𝑆)] . [
𝑓 2]
1/2
. [ 𝜙𝜎 𝐾𝛻𝛷]
1/2
Trapping at a higher ratio of 𝛻𝛷
𝜎 will result from the
separation at both original and at weaker filament
locations. The new pattern will have smaller, but still closely fitting pieces, so that in the low viscous/capillary
J. Oil, Gas Coal Engin. 027
ratio region, residual saturation may be practically unchanged.
By combining equations (25) and (28), the ratio of the viscous to capillary forces originally proposed by Brooks and Corey (1964) is equated to three properties of the fluid-rock system:
𝑁𝑐1(𝑆) =
𝐾𝛻𝛷
𝜎 ≥ [𝜙𝑁𝐿𝑒
2(𝑆)] . [𝜓2(𝑆)]. [1/2𝑓]
(28)
The first right-hand side of the inequality defines the geometric of the rock pore network, the second term defines pore body/pore neck radii and its connection with a contact angle, and the third is a constant fluid geometric property.
Another dimensionless number 𝑁𝑉𝐶 is obtained by
substituting Darcy’s law into Equation (29) and placing relative permeability in the rock-fluid property term, these results in the equation below:
𝑁𝑐(𝑆) =
𝑢𝜇
𝜎 ≥ [𝜙𝑁𝐿𝑒
2(𝑆)] . [𝐾
𝑟𝑤(𝑆)𝜓2(𝑆)]. [1/2𝑓] (29)
This number, which differs from 𝑁𝑐1 by a factor of 𝐾𝑟𝑤,
segregates all rock properties to the Right-hand Side and thereby provides a good measure for comparative ease of recovery from different rocks.
Although 𝑁𝐿𝑒(S) in equation (30) was derived as a function
of initial saturations, it can be expressed in terms of normalized residual oil,𝑆𝑅 = 𝑆𝑜𝑟𝑐⁄𝑆𝑜𝑟, because 𝑆𝑜𝑟𝑐itself is
a single function of initial saturation (S). 𝑆𝑜𝑟 is defined as
the maximum trapped saturation or the residual saturation at a small 𝑁𝑐.
𝑆𝑜𝑟is a rock property only, the relative permeability to
water, 𝐾𝑟𝑤, can be expressed in terms of normalized
saturation , when we substitute this function into Equation (30) relates normalized residual oil and capillary number:
𝑁𝐶(𝑆𝑅) = 𝑢𝜇
𝜎 ≥ [𝜙𝑁𝐿𝑒 2(𝑆
𝑅)] . [𝐾𝑟𝑤(𝑆𝑅)𝜓2(𝑆𝑅)] . [1/2𝑓] (30)
The above is the Capillary number equation derived as a function of the residual saturation or initial saturation depending on availability of experimental data.
The parameters in the proposed capillary number equation are given as follows:
𝑁𝐿𝑒 Leverett Number
ϕ Porosity
𝜓 Geometrical factor for curvature K Permeability
𝑆𝑤 Water saturation
𝑁𝑐 Capillary number
f Dimensionless length of the entire pore
The Leverett Number is:
𝑁𝐿𝑒 =
𝑃𝑐
𝜎√ 𝐾
𝜙 (31)
The geometrical factor for curvature is:
𝜓 = 𝑇(𝛼) − 𝑇(𝛽)
𝑟𝑏⁄𝑟𝑛 (32)
where 𝛼 is the advancing contact angle of oil/water interface, 𝛽 is the receding contact angle of oil/water interface, 𝑟𝑏 is pore body radii, 𝑟𝑛 is pore neck radii
And the Dimensionless length of the entire pore is given as:
𝑓 = 𝐿
𝑎 (33
where 𝐿 is Length of multi pore oil mass, 𝑎 is the average radius of a multi pore oil mass.
The geometrical factor and the dimensionless length (f) values can only be obtained experimentally. To test the proposed equation, various parameters may be used as proposed by Melrose and Brandner (1975). Thereby given the value of 𝜓 = 0.35 and 𝑓 = 2.7, the capillary number and the interpolation parameters of various sample computed and given in
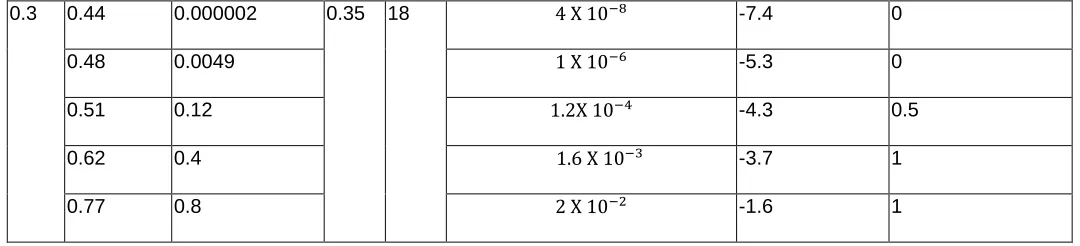
Table 1: Calculations of Capillary number and the interpolation parameter using the proposed formulation
Calculations of Capillary number and the interpolation parameter 𝑭𝒌𝒓
ϕ NLe Krw(Sw) ψ f
NC=
ϕNLe2 Krw((Sw))ψ2
2f
0.3 0.44 0.000002 0.35 18 4 X 10⁻⁸ -7.4 0
0.48 0.0049 1 X 10⁻⁶ -5.3 0
0.51 0.12 1.2X 10⁻⁴ -4.3 0.5
0.62 0.4 1.6 X 10⁻³ -3.7 1
0.77 0.8 2 X 10⁻² -1.6 1
Abdullahi M. 028
2. Numerical Simulation model for surfactant flooding
The purpose of the numerical simulation is to verify the adaptability of the new formulation and the reliability of the parameters used. Also to identify miscibility from capillary number dynamics and the effect of relative permeability interpolation to numerically replicate miscibility. To demonstrate the development effect of surfactant flooding, analyse the model-based calculated capillary number by studying the dynamic changes in Velocity, interfacial tension, and local adsorption. Also to examine the various effect of transport component as a function of miscibility.
The surfactant flooding simulation was implemented on MRST. The surfactant model in Eclipse assumes black-oil fluid representation. However, in MRST the surfactant is assumed to be only dissolved in the aqueous phase and is added to the injected water as a mass per volume concentration (Kg/Sm3). The geological model used in the
simulation is a modified 1-D surfactant data file from the MRST. The surfactant specific data consisting of tabulated values are obtained from experimental work done by Xu et al. (2011) as tabulated in Table 2. The reservoir physical properties and fluid properties used in the simulation are given in Table 3 and Table 4 respectively.
Table 2: Surfactant properties used [5]
Csurf
(Kg sm⁄ 3)
IFT(N m⁄ ) 𝜇𝑤 (cP) Adsorption
(Kg Kg)⁄
0 0.05 0.61 0
30 1E-05 0.8 0.0005
100 1E-06 1 0.0005
Table 3: Reservoir physical parameters (Jørgensen, 2013)
Porosity Φ 0.3
Permeability X 𝐾𝑥𝑥 100 mD
Permeability Y 𝐾𝑦𝑦 100 mD
Permeability Z 𝐾𝑧𝑧 20 mD
Initial pressure 𝑃𝑖 300 bar
Top depth 1000 m
Table 4: Reservoir Fluid parameters (Jørgensen, 2013) Initial water saturation 𝑆𝑤,𝑖 0.2
Surface Density of water 𝜌𝜔,𝑠𝑐 1080 Kg sm⁄ 3
Surface Density of oil 𝜌𝑜,𝑠𝑐 800 Kg sm⁄ 3
Reference viscosity of oil 𝜇𝑜,𝑟𝑒𝑓 0.61 mPa s
Reference viscosity of water 𝜇𝑤,𝑟𝑒𝑓 5.0 mPa s
Reference pressure 𝑃𝑟𝑒𝑓 300 bar
SIMULATION RESULTS AND DISCUSSION
The simulation is carried out using MRST by comparing various parameters including the capillary number between cases of zero surfactants (𝐶 = 0𝑘𝑔/𝑠𝑚3) and fifty
surfactant concentration (𝐶 = 50𝑘𝑔/𝑠𝑚3) along a reservoir
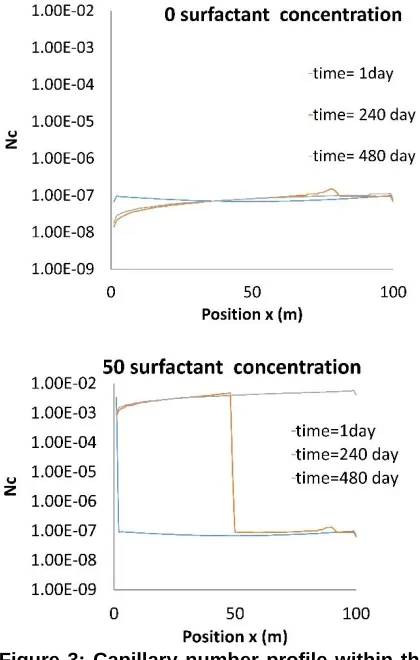
Figure 3: Capillary number profile within the grid with surfactant concentration of 0𝒌𝒈/𝒔𝒎𝟑 and 50𝒌𝒈/𝒔𝒎𝟑
J. Oil, Gas Coal Engin. 029
Figure 4: Interfacial tension profile within the grid with surfactant concentration of 0𝒌𝒈/𝒔𝒎𝟑 and 50𝒌𝒈/𝒔𝒎𝟑
0.00 0.01 0.02 0.03 0.04 0.05 0.06
0 50 100
IFT
Position x (m)
0 surfactant concentration
time= 1day
time= 240 day
time= 480
day 0
0.01 0.02 0.03 0.04 0.05 0.06
0 50 100
IFT
Position x(m)
50 surfactant concentration
time= 1day
time= 240days
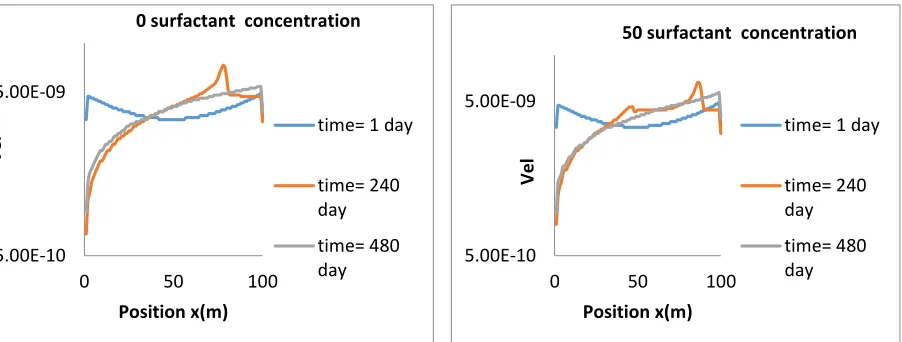
Figure 5: Absolute velocity profile within the grid with surfactant concentration of 0𝒌𝒈/𝒔𝒎𝟑 and 50𝒌𝒈/𝒔𝒎𝟑
Figure 6: Oil saturation distribution map after flooding with surfactant concentration of 0𝒌𝒈/𝒔𝒎𝟑 and 50𝒌𝒈/𝒔𝒎𝟑
The capillary numbers in each grid cell were calculated using the equation 𝑁𝑐 =
𝑢𝜇
𝜎 in MRST. The flow regime
pattern in each grid cells is defined, and each cell has its unique 𝑁𝑐 value. From Figure 3, The capillary number can
be seen increasing from 10−8 to 10−2. The interfacial
tension decreases along the grid cells from 0.05𝑁/𝑚 to 10−6𝑁/𝑚 as seen in Figure 4. Figure 4 shows the velocity
profiles and it can be deduced that the velocity remain constant within the grids cell and does not changes. This
clearly indicates that the velocity of the phases does not affect the miscibility development. It can be observed that both the capillary number and interfacial tension profiles shows a sharp front and smeared front as the simulation time increases at a certain point along the grid block which is caused by the presence of surfactant in the injecting fluid added from the injector well located in the first grid. There is no transition zone on the profile because there is no diffusion in the block and the permeability is constant. The
Abdullahi M. 030
sharp front on the figures indicates the miscible zone, and the smeared front is the immiscible zone.
Figure 6 show different distribution maps after flooding with a surfactant concentration of 0𝑘𝑔/𝑠𝑚3 and 50𝑘𝑔/𝑠𝑚3.
The figure clearly show the influence of surfactant in EOR flooding as the model with surfactant concentration of 50𝑘𝑔/𝑠𝑚3 produces larger oil recovery after flooding.
5.00E-10 5.00E-09
0 50 100
Vel
Position x(m)
0 surfactant concentration
time= 1 day
time= 240 day
time= 480
day 5.00E-10
5.00E-09
0 50 100
Vel
Position x(m)
50 surfactant concentration
time= 1 day
time= 240 day
time= 480 day
Figure 7: Interpolation parameter against the Log(Nc) to identify miscibility from capillary number dynamics
Miscibility is achieved by interpolation between the immiscible relative permeability curves and the miscible relative permeability curves. The Interpolation parameter 𝐹𝑘𝑟 values must span between the range value of [0, 1].
Miscibility is the function of the interpolation parameter. The interpolation parameter is described by a function (log10𝑁𝑐). This logarithmic function is defined with an
equation:
𝐹𝑘𝑟=
log10𝑁𝑐− log10𝑁𝑐 𝑁𝑜𝑠𝑢𝑟𝑓
log10𝑁𝑐 𝑠𝑢𝑟𝑓
− log10𝑁𝑐 𝑁𝑜𝑠𝑢𝑟𝑓
(34)
where 𝑁𝑐 is the model-based capillary number, 𝑁𝑐 𝑁𝑜𝑠𝑢𝑟𝑓
is the minimal values of the capillary numbers, 𝑁𝑐 𝑠𝑢𝑟𝑓
is the maximal values of the capillary numbers.
The interpolation parameter 𝐹𝑘𝑟 value of 0 implies
immiscible conditions and a value of 1 implies miscible conditions. The interpolation parameter 𝐹𝑘𝑟 is computed to
identify miscibility from capillary number dynamics and show the effect of relative permeability interpolation function to numerically replicate miscibility. From Figure 7 is can be clearly seen that the model is immiscible at the first timesteps in the grid cells during the surfactant flooding, partially miscible at median timesteps and fully miscible at the end of the grid. The gradual miscibility development of the model at every timestep is caused by the increasing level of the surfactant concentration during the flooding. This means miscibility develops gradually as we flood.
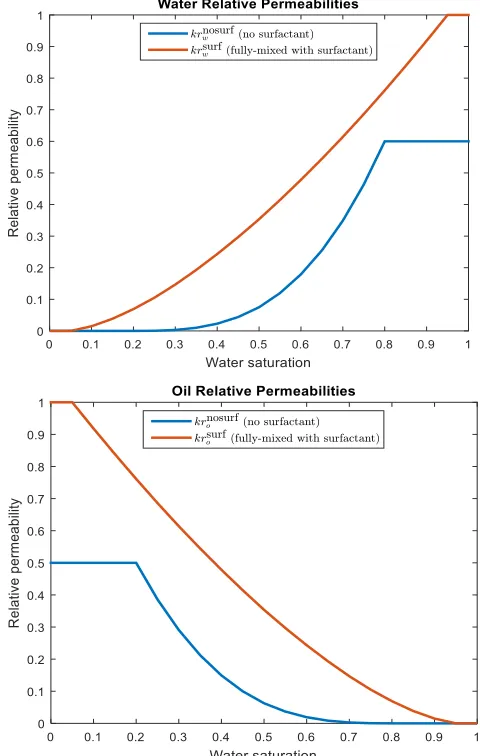
Figure 8: Water and Oil miscible/immiscible relative permeability curves
Figure 8 represents the two sets of relative permeability curves for water and oil, one curve for immiscible conditions (𝐹𝑘𝑟=0) and one curve for fully conditions
(𝐹𝑘𝑟=1). Once the value for 𝐹𝑘𝑟 is determined, the two
relative permeability are scaled and averaged according to a specific method. The lower and upper end-points on the two relative permeability curves are used to calculate new end-point saturations by a weighted average with 𝐹𝑘𝑟=1.
As 𝐹𝑘𝑟 vary between 0 and 1, the relative permeability
calculations vary. Since the relative permeability defined in the input deck consist of some discrete points and is not defined by a continuous function. Instead, new saturation variables will be created, and these two saturation values are used to calculate the relative permeability for both miscible and immiscible conditions at the target saturation, 𝑆𝑤.
Using these new saturation values, the relative permeability is interpolated in the miscible and immiscible table.
The effective relative permeability in the grid cell with saturation 𝑆𝑤and miscibility factor 𝐹𝑘𝑟 is then the weighted
average of the two curves (Equation below).
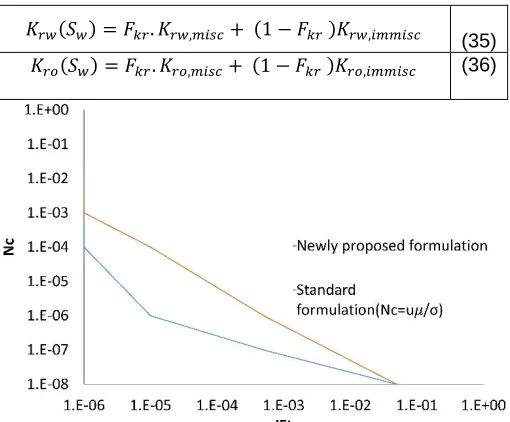
𝐾𝑟𝑤(𝑆𝑤) = 𝐹𝑘𝑟. 𝐾𝑟𝑤,𝑚𝑖𝑠𝑐+ (1 − 𝐹𝑘𝑟 )𝐾𝑟𝑤,𝑖𝑚𝑚𝑖𝑠𝑐 (35)
𝐾𝑟𝑜(𝑆𝑤) = 𝐹𝑘𝑟. 𝐾𝑟𝑜,𝑚𝑖𝑠𝑐+ (1 − 𝐹𝑘𝑟 )𝐾𝑟𝑜,𝑖𝑚𝑚𝑖𝑠𝑐 (36)
Figure 9: Comparison between the influences of Interfacial tension on Capillary number computed using standard formulation in MRST and the newly proposed formulation for capillary number
Figure 9 shows a comparison between the newly derived formulation proposed and the standard formulation. The capillary number was plotted against interfacial tension computed from the new formulation proposed and the standard formulation. At first, the interfacial tension σ is introduced at a pore level, the effect of surfactant is to modify the interfacial tension to make σ a function of the surfactant concentration, C. At an upscale level, the change in relative permeability 𝐾𝑟 will depend on the
capillary number 𝑁𝑐 which measures the ratio between the
viscous and capillary forces and is defined as
𝑁𝑐 =
𝑢𝜇
𝜎 (37)
As the surfactant concentration is increased during the flooding, the interfacial tension reduces, thus the residual oil or trapped oil is forced to move. From the Proposed formulation and standard formulation lines, the maximum capillary number reached is greater using the newly proposed formulation.
Figure 10 Comparison between the new and standard capillary desaturation curve
Figure 10 shows the capillary desaturation curve, this shows the relation between the capillary number 𝑁𝑐 and
the residual oil saturation of the model. The residual oil saturation is deduced from the relation 𝑆𝑜𝑟=
1
1+(𝑁𝑐𝜆)𝛽
(Jørgensen, 2013). Given average values to be used in sandstone as λ = 0.0012 and 𝛽 = 1.25. From figure 9, the oil mobility is observed to have begun at 𝑁𝑐 = 10−6 which
is known as the critical value of 𝑁𝑐 when the newly
proposed formulation is used. Using the standard formulation or model-based calculated capillary number, the mobility is seen to have begun at 𝑁𝑐 = 10−5. Literature
study has shown that critical value of 𝑁𝑐 in most capillary
desaturation curves is between 10−5 and 10−4. Thus the
new 𝑁𝑐 formulation provides a broader critical value range
than the standard formulation.
The recovery factor of the simulations using MRST and Eclipse@ is computed as:
𝑅𝑒𝑐𝑜𝑣𝑒𝑟𝑦 𝑓𝑎𝑐𝑡𝑜𝑟 = 𝑟𝑒𝑐𝑜𝑣𝑒𝑟𝑎𝑏𝑙𝑒 𝑜𝑖𝑙 𝑂𝑟𝑖𝑔𝑖𝑛𝑎𝑙 𝑖𝑛 − 𝑝𝑙𝑎𝑐𝑒 𝑜𝑖𝑙
Table 5: Comparison between the recovery factor of Eclipse@ and MRST
Eclipse® MRST
OIL(recovery) 107.39 sm3 112.67 sm3
Recovery factor 0.191 0.2
By studying the total oil recovered in the two models above, the production data for oil is well matched. The small discrepancy may relate to errors by the simulator as the eclipse@ indicated few warnings during the simulation process, among was convergence issue, and also numerical dispersion issue may cause the small difference in the recovery factor. The oil bank seems to moves faster and has a higher oil recovery factor in MRST than in Eclipse@ as it gave a higher recovery factor as seen in . MRST is thus a vital and optimised tool for enhanced oil recovery simulation.
CONCLUSIONS AND RECOMMENDATIONS
CONCLUSIONS
A new equation for calculation of capillary number as a major transport component and mechanism for oil mobilisation was derived. The equation was tested and proven reasonable. The equation can be accepted as a working hypothesis since the result of the capillary numbers obtained all fell within the range of 𝑁𝑐 as
observed experimentally in various papers and models available. Thus, the proposed mechanism easily accounts for a broader critical range of capillary number (10−6 to 10−4) as compare with the standard models
with less broad critical capillary number ranges (10−5 to 10−4).
Miscibility was identified clearly from capillary number dynamics, and the effect of relative permeability interpolation parameter was used to replicate miscibility.
Absolute velocity of the phases was seen not to have any influence on the capillary number distribution during the flooding. Therefore, the addition of surfactant in flooding doesn’t change the velocities of the phases in the grid block.
An empirical performance of miscibility was certainly seen in the two relative permeability curves plotted, also seen in the plot of capillary number against the interpolation parameter which shows how miscibility develops and finally seen from the capillary desaturation curve. These certainly illustrated the effect of miscibility in the surfactant flooding in enhance recovery compared to the water flooding.
The surfactant model in MRST produced significantly higher oil (recovery) and a higher recovery factor in the surfactant model implemented in MRST than Eclipse®.
RECOMMENDATIONS
To investigate other methods that capture miscibility effects on relative permeability curves
Experimental works should be carried out to describe the phase behaviour of oil/water system containing surfactant and published data validation.
Full-scale modeling of a 3-phase system (Oil-Water-Gas) to study the effect of miscibility and hysteresis simultaneously.
NOMENCLATURE
𝑁𝐿𝑒 Leverett Number
𝑁𝑉𝐶 Capillary number
𝑃𝑐 Capillary pressure
P Pressure q Flow rate r radius
R Ratio of maximum pore radius/average pore radius determined by
resistivity
S Saturation of nonwetting phase 𝑆𝑅 Normalized residual oil saturation
T(θ) geometric factor for contact angle of interface passing through toroidal pore
u Darcy’s velocity α
̂ Dullien pore volume distribution function α Advancing contact angle of oil/ water interface β Receding contact angle of oil/water interface ∇Φ Potential gradient
ϕ Porosity
ᵑ pore angle interface ∆ρ density difference σ Interfacial tension
θ Advancing contact angle of fluid used to determine rock property
ψ The geometrical factor for curvature b pore body
c cylinder d drainage m maximum n pore neck
or Immobile nonwetting phase at maximum trapping orc immobile nonwetting phase below maximum trapping wr immobile wetting phase at maximum trapping
wrc immobile wetting phase below maximum trapping 𝑉𝑏 Bulk volume
f Dimensionless length of the entire pore K Permeability
μ Viscosity L Core length A area
𝜆 Mobility of phase 𝐾𝑟 Relative permeability
𝑆𝑛 Normalized saturation
𝑆𝑔𝑟 Residual gas saturation
𝑆𝑔𝑟 Initial gas saturation
C Trapping characteristic of the porous media M Mobility ratio
ω Todd-Longstaff mixing parameter 𝑁𝑐 Capillary number
X Fractional distance of current saturation between drainage curve end point and hysteresis saturation
REFERENCES
AlQuaimi BI, Rossen WR (2018). Capillary Desaturation Curve for Residual Nonwetting Phase in Natural Fractures, SPE Journal, Preprint(September 2017), pp. 1–15. doi: 10.2118/189448-PA.
Basante VA (2010). Effect of Capillary Number on the Oil Recovery using Oil-Water Emulsion Injection in Coreflooding, in 13th Brazilian Congress of Thermal Sciences and Engineering. Uberlândia, MG, Brazil. Brooks RH, Corey AT (1964). Hydraulic properties of
porous media, Hydrol Pap Fort Collins CO Colo State Univ, 3(3), p. 27 pgs. doi: citeulike-article-id:711012. Bryan J, Kantzas A (2009). Potential for alkali-surfactant
flooding in heavy oil reservoirs through oil-in-water emulsification, Journal of Canadian Petroleum Technology, 48(2), pp. 37–46. doi: 10.2118/09-02-37. Cheng N (2005). Special Topics On Developed Miscibility
Special Topics On Developed Miscibility, October, https://core.ac.uk/download/pdf/52100024.pdf.
Dullien FAL, Dhawan G K, Gurak N, Babjak L (1972). A relationship between pore structure and residual oil saturation in tertiary surfactant floods, Society of Petroleum Engineers Journal, 12(04), pp. 289–296. Felix U, Ayodele TO, Olalekan O, (2015).
Surfactant-Polymer Flooding Schemes (A Comparative Analysis), Nigeria Annual International Conference and Exhibition held in Lagos, Nigiria.
Jørgensen K, (2013). Implementation of a Surfactant Model in MRST With Basis in Schlumberger ’ s Eclipse, (June).
Keshtkar S, Sabeti M, Mohammadi AH (2016). Numerical approach for enhanced oil recovery with surfactant flooding, Petroleum. Elsevier Ltd, 2(1), pp. 98–107. doi: 10.1016/j.petlm.2015.11.002.
Khanamiri HH, Torsæter O, Stensen JÅ, (2015). Experimental Study of Low Salinity and Optimal Salinity Surfactant Injection, Europec 2015. doi: 10.2118/174367-MS.
Laforce T, London IC, Orr FM (2008). SPE 116119 Development of Gas/Oil Miscibility in Water and Gas Injection, in, pp. 21–24.
Leverett MC (1941) Capillary Behavior in Porous Solids, Transactions of the AIME, 142(01), pp. 152–169. doi: 10.2118/941152-G.
Lohne A, Purwanto EY, Fjelde I (2012). SPE 154495 Gravity Segregated Flow in Surfactant Flooding, (June), pp. 4–7.
Melrose JC (1974). Role of Capillary Forces In Detennining Microscopic Displacement Efficiency For Oil Recovery By Waterflooding, Journal of Canadian Petroleum Technology, 13(04), p. 9. doi: dx.doi.org/10.2118/74-04-05.
Ren B, Delaney JM, Lake LW, Bryant SL (2018). Interplay Between Permeability Retardation and Capillary Trapping of Rising Carbon Dioxide in Storage Reservoirs, in SPE Annual Technical Conference and Exhibition. Texas, pp. 9–11.
Shen P, Zhu B, Li X, Wu Y, (2006). The Influence of Interfacial Tension on Water / Oil Two-Phase Relative Permeability, SPE/DOE Symposium on Improved Oil Recovery, (1), pp. 1–8.
Stegemeier GL (1974). Relationship of Trapped Oil Saturation to Petrophysical Properties of Porous Media, SPE Improved Oil Recovery Symposium. doi: 10.2118/4754-MS.
Whitson CH, Fevang O (1997). Generalized Pseudopressure Well Treatment in Reservoir Simulation, in.
Xavier JA (2011). Effect of Varying Surfactant Concentration on Interfacial Tension in Tertiary Recovery of Crude Oil.
Xu F, Guo X, Wang W, Zhang N, Jia S, Wang X, Key S (2011). SPE 145036 Case Study : Numerical Simulation of Surfactant Flooding in Low Permeability Oil Field’. doi:10.2118/145036-MS.
Yan C, Qiu H (2016) Critical Capillary Number of Interfacial Film Displacement in a Capillary Tube, pp. 1–17. 1610.07749.pdf
Accepted 26 July 2018
Citation: Abdullahi M (2018). The New Capillary Number Parameterization for Simulation in Surfactant Flooding. Journal of Oil, Gas and Coal Engineering. 3(1): 023-033.