17
Egypt. J. Soil Sci. Vol. 56, No. 2, pp. 295 - 312 (2016)Water Use Efficiency of Soybean under Different
Tillage and Irrigation Methods
Manal A. El-Nady* and Wafa M. Hadad**
*
Soil Science Department, Faculty of Agriculture, Cairo University, Giza and **Ministry of Water Resources and Irrigation, Irrigation Development Sector, Cairo, Egypt.
FIELD study was carried out during two growing seasons of 2012/2013 and 2013/2014 at the Water Requirements Research Station, Water Management Research Institute, Kafer El-Sheikh Governorate to compare two irrigation methods, surge (SI) and alternate (AI) with traditional furrow irrigation method (FI) in relation to two tillage systems, conventional (CT) and no-tillage (NT) on water use efficiency and crop yield production of soybean. In both seasons, the lowest amount of irrigation water was applied with AI treatments, whereas, the highest amount of irrigation water was applied with FI treatments. The irrigation water amounts were saved by using AI and SI methods. The AI and SI saved about 29.0 % and 15.0 % of water applied in comparison with FI under CT and NT systems. Irrigation water productivity (IWP) and crop water use efficiency (CWUE) were higher when applying AI compared to SI and FI under both tillage systems. Surge irrigation had the potential to improve irrigation application efficiency (AE) followed by AI compared to FI. The highest seed yield and yield attributes were obtained with FI followed by SI and AI in both seasons, respectively. Significant differences in seed yield, yield attributes and plant growth characteristics were found only between FI and AI under CT and NT. The SI surpasses the AI in obtaining higher seed yield, yield attributes without any significant reduction of soybean yield. These results suggesting that an extra irrigation water amount may be saved without any significant loss in yield of soybean when applying SI method under both tillage systems. The results also showed the effect of CT on reducing applied water and increasing irrigation water productivity and crop water consumptive use compared to NT. However, no significant difference between the two tillage systems in yield and yield attributes was found. Values of ETc should be adjusted according to the used irrigation and tillage methods. The crop water stress index (CWSI) has proven to be a good indicator for monitoring and quantifying water stress of soybean with different irrigation methods and tillage systems.
Keywords: Surge irrigation, Alternative irrigation, Furrow irrigation, Conventional tillage, No- tillage, Water productivity, Crop water use efficiency, Yield, Yield attribut ETc, Soybean.
Irrigation and seedbed preparation are major factors in crop production. Any chosen irrigation and tillage methods should aims at maximizing crop yield.
properties required for successful growth of agricultural crops. In recent years, soybean production has gained importance and it is produced in largest amounts in the world, it is an annual legume that is primarily produced to be used as food or as a source of edible oil for human consumption (Liener, 1994 and Balat & Balat, 2010). The integration of appropriate tillage and irrigation systems is a challenge in order to maximize their benefits on soil productivity. The objectives of this study were to compare the effect of three irrigation methods in relation to two tillage systems on water productivity, crop water use efficiency, yield and yield attributes of soybean crop.
Material and Methods
Description of the study area
A field experiment was carried out at El-Karada ,Water Requirements Research Station, Water Management Research Institute, Kafer El-Sheikh Governorate during the two successive summer seasons of 2012/2013 and 2013/2014. The station is located at 31o N to 30o E and at an altitude of 6.0 m above sea level. The soil at the experimental site is predominantly clay.
Experimental design and general preparations
The experimental area was 600 m2 designed as randomized complete block design with three replications. The area of study was divided into two blocks each of the blocks was further divided into three subplots of 20 m long and 5 m wide. A buffer of 1.5m in width was between plots.
Soil sampling
The soil physical and chemical properties were measured at the initiation of the experiment. Soil samples were taken randomly from depths of 0-20, 20-40 and 40-60 cm, respectively. The physical properties: bulk density, field capacity and wilting point (Table 1) were determined according to Klute (1986). The chemical properties: pH, electrical conductivity and organic matter content (Table 2) were determined according to page et al. (1982).
Irrigation and tillage treatments
The adopted treatments were as follows: 1-Main- plot (tillage systems)
I- Conventional tillage (CT). II- No-tillage (NT).
2- Sub-plot (irrigation methods)
I- Traditional furrow irrigation (FI), in which every furrow is irrigated.
II- Surge-furrow irrigation (SI), in which the water is cycled on and off (15 min-on –times and 10 min – off – times) during each irrigatimin-on.
TABLE 1. Particle size distribution, bulk density (Bd), field capacity (F.C) and wilting point (W.P) of the experimental soil (average of the two seasons) Soil
characteristics
Soil depth (cm)
0-20 20-40 40-60
Sand % 20.6 18.9 20.8
Silt % 28.1 25.3 30.2
Clay % 51.3 55.8 49.0
Texture class Clay Clay Clay
Bd (Kg. m-3) 1.12 1.21 1.30
F.C (vol.%) 45.2 42.3 39.2
W.P (vol.%) 24.2 23.8 21.5
TABLE 2. Chemical properties of the experimental soils (average of the two seasons) Soil
depth (cm)
pH 1:2.5 EC
dS.m-1
Cation (meq.L-1) Anion(meq.L-1) Growth Season
2012/2013 2013/2014 Ca++ Mg++ Na+ K+ Hco3
--Cl- So4
--0-20 98.7 18.3 1.98 1.45 3.15 3.80 0.15 2.35 2.70 3.50
20-40 7.49 7.52 1.91 2.00 1.60 6.50 0.16 3.75 2.90 3.61
40-60 7.23 7.21 0.88 1.90 2.20 7.40 0.16 2.25 3.00 6.41
Irrigation water applied (IWa)
Irrigation water applied (IWa) was controlled through measurements of the soil moisture content in the subsequent soil depths [0 -20, 20-40 and 40-60 cm] by using the gravimetric method. All the plots were irrigated when the soil available moisture content in the soil profiles was depleted to 50%. The irrigation water amounts were measured using a rectangular shape crested weir. The discharge of irrigation water was calculated using the following formula according to Massoud (1967).
Q = CL H3/2 where,
Q : The discharge (m3. S-1) L : The length of the crest (m)
H : The measured head above the crest (m)
C : Discharge coefficient, 0.6, empirically obtained.
Irrigation water productivity (IWP)
Irrigation water productivity (IWP) was calculated according to Jensen (1983), as follows:
IWP = where,
Water consumptive use (WCU)
Water consumptive use (WCU) was calculated using the following equation according to Hansen et al. (1979).
where,
WCU = Water consumptive use in the effective root zone (0.60 m). Di = Soil layer depth (0.20 m).
Dbi = Soil bulk density, (Kg. m-3) for the 0.60 m soil depth. θ1 = Soil moisture % before irrigation.
θ2 = Soil moisture % 48 hours after irrigation. I = Number of soil layers.
Crop water use efficiency (CWUE)
Crop water use efficiency (CWUE) was calculated according to Jensen (1983), as follows:
where,
Y = Total seed yield (kg/fed.) WCU = Water consumptive use (m3/fed.)
Water stored at the root zone (Ws)
Water stored at the root zone (Ws) was determined by taking soil sample two weeks after tillage application and at 10 days intervals until harvest. Samples were taken by auger from each layer then the volumetric water content was multiplied by the thicknesses of the respective soil layers.
Irrigation application efficiency (AE)
Irrigation application efficiency (AE) was calculated according to James (1988), as follows:
where,
Ws = Amount of water stored in the root zone, m3 IWa = Irrigation water applied, m3
Reference evapotranspiration (ETo)
The climatic data collected from the meteorological station close to the experimental crop field. The reference evapotranspiration (ETo) calculated using The FAO Penman-Monteith equation (Table 3) according to Allen et al. (1998).
Crop water requirements (ETc)
Crop water requirements (ETc) were estimated according to Allen et al. (1998) using the following equation:
ETc = ETo × Kc where,
Kc = Crop coefficient.
ETo = Reference evapotranspiration, mm.
TABLE 3.The meteorological data and average ETo (mm/day) of 2012/2013 and 2013/2014 seasons.
Month 2012/2013 2013/2014
Tmax C°
Tmin C°
Wind-sp Km/h
RH %
ETo mm
Tmax C°
Tmin C°
Wind-sp Km/h
RH %
ETo mm
May 31.3 19.7 4.2 50.9 5.55 29.6 19.6 4.6 52.5 5.46
June 33.6 22.7 4.2 55.5 6.21 30.8 21.5 5.1 56.5 6.05
July 35.6 25.1 4.4 57.6 6.51 31.1 22.8 5.3 59.6 6.10
Aug. 35.9 26.0 4.0 56.1 6.33 32.7 24.1 4.5 59.5 6.01
Sep. 32.8 25.0 4.1 57.2 5.01 31.1 24.6 6.8 60.6 5.30
Crop coefficient (Kc)
Crop coefficient (Kc) was calculated using the following equation according to Allen et al. (1998):
Kc = ETa/ ETo where,
ETa = actual evapotranspiration.
Crop water stress index (CWSI)
Crop water stress index (CWSI) expressed in terms of evapotranspiration based on Jackson et al. (1981).
CWSI=1- ETc/ ETo where,
ETc = The actual crop evapotranspiration. ETo= The reference evapotranspiration.
In theory, CWSI progress from zero for non-stressed plants to 1 for severely stressed plants.
Planting
Soybean (Glycine max L.) seeds variety of (Giza 111) were sown on 3 and 10 May of the first and second seasons, respectively, and harvested on September 1 and 5 of the first and second seasons, respectively. The seeds were sown at a row spacing of 20 cm. All recommended agricultural practices and fertilization regime for soybean production were done according to the recommendation of the Ministry of Agriculture.
(cm) and shoot weight (gm). The seed yield (kg/fed.) was estimated from an area of (1 m2).
Statistical analysis
Data of the different treatments was subjected to analysis of variance (ANOVA) and the treatments means were compared using the LSD at 0.05 level according to Gomez and Gomez (1984). The t- test was also used to establish the significant difference of Kc, ETc and CWSI for the different treatments. CROPWAT for Windows Version 8.0 was used to estimates ETo from the weather station data.
Results and Discussions
Irrigation water applied (IWa)and water consumptive use (WCU)
(R2 =0.98) was found. The regression equation was as follows: WCU = 179.10+0.72 IWa .
TABLE 4. Irrigation water applied (IWa) and water consumptive use (WCU) as affected by different irrigation methods and tillage systems of 2012/2013 and 2013/2014 seasons.
Tillage systems
Irrigation methods
2012/2013 2013/2014
IWa ( m3/fed.)
WCU (m3 /fed.)
IWa ( m3/fed.)
WCU (m3 /fed.)
CT FI 2930 2265 3000 2280
SI 2530 2020 2595 2040
AI 2083 1661 2106 1679
Mean 2514 1982 2567 1999
NT FI 3005 2360 3060 2380
SI 2550 2070 2600 2091
AI 2130 1702 2170 1723
Mean 2561 2044 2610 2064
LSD 5% 64.69 101.87 81.51 123.15
Irrigation water productivity (IWP)
Effect of irrigation methods and tillage systems on IWP is shown in Table 5. The IWP evaluates the efficiency of water utilization by the crop, depending upon the total water applied and seed yield obtained. The highest IWP (0.62 and 0.59 in the first season and 0.58 and 0.55 in second ones under CT and NT, respectively) was obtained with AI in comparison to FI and SI. The AI increased IWP by about 26.0% and 12.0% compared to FI and SI, respectively under both tillage systems. The AI yielded higher IWP values since AI consumed less water than FI and SI methods. These results concluded that the effect of AI on increasing IWP was more than the effect of SI. Significant differences among irrigation methods on IWP under both tillage systems were found. Arora et al. (2011) indicated that the IWP of soybean was affected by irrigation and tillage methods. On the other hand, IWP under CT was higher than under NT; the increase in IWP was about 7.8% and 8.2% compared to NT in the first and second seasons, respectively. However, no significant difference in IWP was found between the two tillage systems. Howell (2001) indicated that depletion of water resources has led to improvements in water productivity through enhanced management practices and irrigation. The regression equation for the relationship between IWP and irrigation water applied (IWa) was obtained as follows:
IWP = 0.878 – 0.00014 IWa. A highly significant inverse relationship between them was obtained (R2 = 0.92).
Crop water use efficiency (CWUE)
results demonstrated that the crop water use efficiency increased with the decrease of water applied and the increase of water consumption. Therefore, applying AI method could enhance CWUE followed by SI method for soybean crop. This was in agreement with Okasha et al. (2013). The increase in CWUE with AI and SI may be due to reducing transpiration water loss of soybean plants and soil water consumption compared to FI. The CWUE was affected by the tillage methods; CWUE was higher with CT treatments than NT. Statistically, a significant difference was found in CWUE between the two tillage systems. The results indicated that AI and SI optimizing crop water use efficiency under both tillage systems compared to FI method. This result agreed with Rosegrant et al. (2002).
TABLE 5. Irrigation water productivity (IWP) and crop water use efficiency (CWUE) as affected by different irrigation methods and tillage systems in 2012/2013 and 2013/2014 seasons.
Tillage systems
Irrigation methods
2012/2013 2013/2014
IWP (kg.m-3 )
CWUE (kg. m-3 )
IWP (kg.m-3 )
CWUE (kg. m-3 )
CT FI 0.49 0.63 0.47 0.62
SI 0.55 0.69 0.53 0.68
AI 0.62 0.78 0.59 0.75
Mean 0.55 0.70 0.53 0.68
NT FI 0.46 0.58 0.45 0.57
SI 0.52 0.64 0.51 0.63
AI 0.58 0.72 0.55 0.70
Mean 0.52 0.65 0.50 0.63
LSD 5%
0.043 0.043 0.039 0.047
Water stored in the root zone (WS)
Data of soil water stored (WS) in the upper 60 cm of soil depth, is presented in Fig. 1. The WS in the root zone increased as the irrigation amounts increased. Water stored in the root zone followed the order of FI > SI > AI under both tillage systems in both seasons. Stored water under FI was higher by 11.5 % and 39.2 % under CT and by 14.7 % and 41.9 % under NT as compared to SI and AI, respectively. The WS under NT treatments was higher than WS under CT treatments. The increase in water stored under NT treatments was due to the effect of NT on retaining more water in the root zone of the soil. Hatfield et al. (2001) explained that in no-tillage system, WS in the soil profile is generally more as compared to CT, due to reduced soil evaporation, increased infiltration, reduced deep percolation and due also to the increase in soil organic matter. Statistically, significant differences between FI and each of SI and AI and also between SI and AI were obtained, (LSD 5% 90.58). Moreover, the WS of the first season was lower than those of the second
0 500 1000 1500 2000 2500 3000
CT NT CT NT
2012 2013
Tillage systems WS (m3/fed.)
FI
SI
AI
Fig. 1. Water stored (WS) in the root zone under different irrigation methods and tillage treatments of 2012/2013 and 2013/2014 seasons.
Irrigation application efficiency (AE)
Table 6 illustrates irrigation application efficiency (AE) for irrigation methods under tillage and no-tillage systems. The highest AE (80 and 81 in the first season and 81 and 82 in the second one) was recorded with SI, whereas the lowest AE was recorded with FI (74 and 76 in the first season and 76 and 78 in the second one). These results are in agreement with Mohmed et al. (2014) and Horst et al. (2007). The highest AE obtained with SI revealed that lower amount of applied water was wasted or was not available for the crop as compared to FI. This result may be attributed by the fact that surge technique offered greater opportunity time for water to infiltrate in the soil.In contrast, the lowest AE of FI resulted from the non uniform distribution and excessive waste of water. The increase in AE was also obtained with AI as compared to FI. A significant difference between FI and AI was found under both tillage systems in both seasons. In respect to tillage systems, AE increased with NT treatments as compared with CT treatments. However, no significant difference in AE between CT and NT treatments was found. These results indicated that surge irrigation proved to be more effective to improve water irrigation efficiency for soybean crop.
TABLE 6. Irrigation application efficiency % as affected by different irrigation methods and tillage systems in 2012/2013 and 2013/2014 seasons
Season
Tillage systems
Irrigation methods
FI SI AI Mean LSD
5%
2012/2013 CT 74 80 78 77 2.96
NT 76 81 80 79
2013/2014 CT 76 81 79 78 2.52
Yield of soybean
Figure 2 shows the effect of different irrigation and tillage methods on yields of soybean during the two studied seasons. The seed yield ranged from 1421 to 1235 Kg/fed. in the first season and from 1410 to 1206 Kg/fed. in the second one for the different irrigation and tillage methods. Data illustrated that seed yield was higher when applied irrigation water increased. The increase in seed yield followed the order of FI >SI > AI under both tillage systems in both seasons. As for the effect of SI, the seed yield was insignificantly reduced in comparison to FI. On the other hand, seed yield with SI was higher than the seed yield obtained with AI. The increase in seed yield with SI was 8.12 % and 7.37 % in the first season and 10.10% and 9.20% in the second one under CT and NT, respectively in comparison to AI. Dealing with the effect of AI on seed yield, under CT, AI reduced seed yields by 9.4% and 7.5% in the first season and by 11.2% and 9.1% in the second ones as compared to FI and SI, respectively. The same results were obtained with the second season. A significant difference between FI and AI was found whereas, no significant difference was found between FI and SI or between SI and AI in both seasons. These results revealed that soybean crop will suffer yield loss when applying alternative method due to water deficit compared to FI and SI. The SI maintained a reasonable crop yield as compared with AI therefore; surge irrigation method is beneficial for saving water without significant yield loss. The increase in seed yield under FI is mainly due to enough existence soil moisture in the root zone, whereas, the reduction of soybean yield with SI and AI could be attributed to soil water shortage with these methods. The yield of soybean responded positively (R2=0.69) to irrigation water applied (IWa) as follows: Yield = 918.40 + 0.16 IWa. A positive linear relationship (R2= 0.68 ) was also obtained between the water consumptive use (WCU) and yield of soybean for the two seasons as follows: Yield= 886.40+ 220.2 WCU . Dealing with the effect of tillage systems, the seed yield under CT, increased by 6.2 % and 5.4% over NT in the first and second seasons, respectively. This may be explained that tillage improves soil conditions by altering soil structure, moisture holding capacity, mechanical impedance to root penetration, aggregate size distribution and hydraulic conductivity which in turn, affects plant growth. The combination between FI and CT recorded the highest seed yield in both seasons. Whereas, the combination between AI and NT recorded the lowest seed yield.
1050 1100 1150 1200 1250 1300 1350 1400 1450
Yield (Kg / fed.)
CT NT CT NT
2012 2013
Tillage systems
FI SI AI
Yield attributes
The effect of irrigation methods and tillage systems on some plant growth characteristics (plant height and shoot weight) and yield attributes (number of pods/plant and 100 seed weight) of soybean during the two growing seasons are shown in Table 7. The changes in yield attributes with irrigation methods were due to the changes in irrigation method performance. The FI might have favored the progressive growth of plant as better soil moisture was maintained and significantly increased the studied components of soybean as compared to SI and AI. Applying AI method enlarged the reduction percentage at all studied plant characteristics and yield attributes of soybean with respect to FI and SI methods. A significant difference between FI and AI was found in plant height and shoot weight, no of pods and 100- seed weight in both seasons while, the difference between SI and AI was not significant under both tillage systems in both seasons.
TABLE 7. Some plant growth characteristics and yield attributes of soybean affected by irrigation methods and tillage systems in 2012/2013 and 2013/2014 seasons Tillage systems Irrigation methods 2012 / 2013 2013/2014 Plant height (cm) Shoot weight (gm) No.of pods/ plant 100-seed weight (gm) Plant height (cm) Shoot weight (gm) No.of pods/ plant 100 seed weight (gm)
CT FI 127 152.54 128.00 23.74 124 155.23 124 23.48
SI 122 140.00 95.67 20.73 120 145.75 97 21.74
AI 117 127.30 86.00 19.16 114 124.45 83 19.30
Mean 122 139.95 103.22 21.21 119.3 141.81 101.33 21.51
NT FI 108 123.15 112.67 22.51 107 119.70 102 21.40
SI 103 117.32 84.70 18.85 101 115.00 82 19.60
AI 99 101.65 79.00 17.26 97 103.15 75 17.92
Mean 103 114.04 92.12 19.54 101.7 112.62 86.33 19.64
LSD 5%
8.86 23.12 17.32 4.17 7.69 14.68 15.04 3.32
However, a consistent trend for higher no.of pods and 100-seed weight obtained with CT compared to NT, no significant difference between the two tillage systems was found. The effect of CT on yield attributes may be due to the good seed bed providing for cultivated plant under CT (Latifi et al., 2009).
Crop coefficients (Kc) and crop water requirement (ETc)
the lowest ETc value was recorded with AI. The reduction in crop water requirement with AI is a way of saving amount of applied water. The data also showed that the ETc values is modified by the tillage system, the ETc under NT were higher than CT. Also the estimated ETc for the second season was higher than the first one. This is mainly attributed to the lower values of ETo in the second season compared to the first one. A significant difference in ETc values among irrigation methods was obtained as shown in Table 9.
Crop water stress index (CWSI)
Table 8 shows the crop water stress index (CWSI) for the different irrigation and tillage treatments. The CWSI is an index detecting crop water stress and it quantifies the combined effects of soil water, atmospheric and crop conditions on crop water status. The CWSI should progress from zero for non-stressed plants, to 1 for severely stressed plants. The obtained CWSI values ranged from 0.24 to 0.46 for the first season and 0.18 to 0.42 for the second one with different irrigation methods under the two tillage systems. The obtained CWSI values indicated that plants of soybean were subjected to appropriate irrigation conditions. However, AI treatments had the highest CWSI values. The lowest CWSI values were recorded with FI and SI treatments, respectively under both tillage systems in the first and second seasons.
TABLE 8. Crop coefficient (Kc) ,crop water requirement (ETc) and crop water stress index (CWSI) under different irrigation and tillage methods for 2012/2013 and 2013/2014 seasons
Tillage systems
Irrigation methods
2012/2013 2013/2014
Kc ETc CWSI Kc ETc CWSI
CT FI 0.73 539.62 0.27 0.78 540.24 0.22
SI 0.65 480.48 0.35 0.70 484.83 0.29
AI 0.54 399.17 0.46 0.58 401.71 0.42
Mean 0.64 473.09 0.36 0.69 475.59 0.31
NT FI 0.76 561.79 0.24 0.82 567.94 0.18
SI 0.67 495.26 0.33 0.72 498.68 0.28
AI 0.55 406.56 0.45 0.59 408.64 0.41
Mean 0.66 487.87 0.34 0.71 491.75 0.29
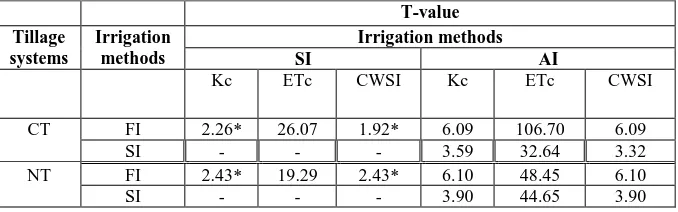
TABLE 9. T-test values (over the two seasons) for the difference between irrigation methods on (Kc, ETc and CWSI) under the two tillage systems
T-value Tillage
systems
Irrigation methods
Irrigation methods
SI AI
Kc ETc CWSI Kc ETc CWSI
CT FI 2.26* 26.07 1.92* 6.09 106.70 6.09
SI - - - 3.59 32.64 3.32
NT FI 2.43* 19.29 2.43* 6.10 48.45 6.10
SI - - - 3.90 44.65 3.90
*Not significant
Conclusion
The results concluded that soybean yield depends on the total water applied during the growing season. The FI had higher yields than SI and AI due to sufficient supplied water in FI. Surge and alternative irrigation prove to be a water saving methods. The two methods increased irrigation water productivity, crop water use efficiency and irrigation application efficiency in comparison to continuous irrigation. However, AI increased IWP and CWUE, it may not be a beneficial practice in increasing soybean yield significantly in comparison with FI method whereas, surge flow irrigation method maintained yield comparable with continuous flow irrigation method. The results also showed that no-tillage system can be applied as it reduces production costs relative to conventional tillage (CT).
References
Abdel-Maksoud, H.H., Othman, Sanaa, A., and El-Tawil, A.Y. (2002) Improving water and N-use utilization for field crops via alternate furrow irrigation technique 1-Maize crop. J. Agric. Sci., Mansoura Univ., 27(12), 8761-8769.
Agele, S.O., Olufayo, A., Iremiren, G.O. (2002) Effects of season of sowing on water use and yield of tomato in the humid south of Nigeria. African Crop Sci. J. 10, 231-237.
Agriculture and Rural Development (2004) Tillage effects on soil moisture. Available at: http://www1.agric.gov.ab.ca/$department/ deptdocs.nsf/all/ eng8174/$file// Tillage_ Effects_on_Soil_Moisture.pdf ?OpenElement. [Accessed June 14, 2006].
Ali, M. H. and Talukder , M. S. U. (2008) Review increasing water productivity in crop production-A synthesis. Agric. Water Manage. 95, 1201-12013. DOI: 10.1016/j.agwat. 2008.06.008.
Arora, V. K., Singh, C. B., Sidhu, A. S. and Thind, S. S. (2011) Irrigation, tillage and mulching effects on soybean yield and water productivity in relation to soil texture. Agric. Water Manage. 98, 563–568.
Balat, M. and Balat, H. (2010) Progress in biodiesel processing. Applied Energy, 87(6), pp 18151835.
Benjamine, J.G., Porter, L.K., Duke, H.R. and Ahuja, L.R. (1997) Corn growth and nitrogen uptake with furrow irrigation and fertilizer bands. Agron. J. 89, 609 - 612.
Du, T. S., Kang, S. Z., Zhang, J. H. and Li, F. S. (2006) Yield and physiological responses of cotton to partial root-zone irrigation in the oasis field of northwest China. Agric. Water Manage. 84, 41–52.
El-Sherbeny, A. M., Ward, M.I.H. and El-Behery, A. A. (1997) Evaluation of alternate irrigation technique under furrow irrigation system. Proc. 5th Conf.of Misr Soc.of Agric. Eng. Towards a National Strategy for Agr. Eng. In Egypt for the Next Decade. 161-172.
FAO (2012) Guidelines for designing and evaluating surface irrigation systems. FAO Corporate Document Repository, Available: http:// www.fao.org
Fecak, O., Sarikova, D. and Cerny, I. (2010) Influence of tillage system and starting N fertilization on seed yield and quality of soybean Glycine max (L.) Merrill. Plant, Soil and Environ. 56, 105-110.
Ghazanfar, M., Asoodar, M. A. and Alami Saeed, K. H. (2010) The effect of conservation tillage, planting and irrigation methods on water use efficiency and wheat grain yield in north of Ahwaz. Journal of Engineering and Appl. Sci. 5(2), 101-105.
Gomez, K. A. and Gomez, A. A. (1984) Statistical Procedures for Agriculture Research. A Wiley-Inter Science Publication, john Wiley &Sons, Inc. New York, USA.
Hansen, V. W., Israelsen, D. W. and Stringharm, Q. E. (1979) Irrigation Principle and Practices, 4th ed. John Wiley & Sons., New York.
Hatfield, J. L., Sauer, T. J. and Prueger, J. H. (2001) Managing soils to archive greater water use efficiency: A review. Agron. J. 93, 271–280.
Horst, M. G., Shamutalov, Sh. S., Goncalves, J. M. and Pereira, L. S. (2007) Assessing impacts of surge-flow irrigation on water saving and productivity of cotton. Agric. Water Manage. 87, 115–127.
Howell, T. A. (2001) Enhancing water use efficiency in irrigated agriculture. Agron. J. 93, 281–289.
Jabro, J.D., Stevens, W.B., Evans, R.G. and Invrsen, W.M. (2009) Tillage effects on Physical properties in two soils of the Northern Great Plains. Appl. Eng. Agric. 25 (3), 377-382.
James, L.G. (1988) Principles of Farm Irrigation System Design. Jone Willey & Sons, PP. 543. New York, USA.
Jensen, L. and Shock, C. C. (2001) Strategies for reducing irrigation water use, Oregon state University, EM 8783, www. extension.oregonstate.edu/catalog/pdf/em/em 8783. Pdf.
Jensen, M. E. (1983) Design and operations of farm irrigation systems. The Amer. Soci. of Agric. Engin. An ASAE monogram No 3.
Kang, S. Z. and Zhang, J. H. (2004) Controlled alternate partial root zone irrigation: its physiological consequences and impact on water use efficiency. J. Exp. Bot. 55 (407), 2437–2446.
Khan, A. Z,, Shah, P., Khalil, S. K. and Taj, F. H. (2003) Influence of planting date and plant density on morphological traits of determinate and indeterminate soybean cultivars under temperate environment. J. Agron. 2,146-152
Klute, A. (1986) Methods of Soil Analysis. Part 1. 2nd ed. ASA and SSSA. Madison,
Wisconsin, USA.
Lasisi, D. and Aluko, O. B. (2009) Effects of tillage methods on soybean growth and yield in a tropical sandy loam soil. Inter. Agroph., 23, 147-153.
Latifi, N., Siyahmarguei, A., Akram-Ghaderi, F. and Yones-Abadi, M. ( 2009) Effect of tillage methods on weed population dynamics in the cotton fields (Gossypium hirsutum L) Planted after canola.(Brassica napus) J. Agric. Res. 7 (1), 195-203. Li, F., Liang, J., Kang, S. and Zhang, J. (2007) Benefits of alternate partial root-zone
irrigation on growth, water and nitrogen use efficiencies modified by fertilization and soil water status in maize. Plant Soil, 295, 279–291.
Liener, I.E. (1994) Implications of antinutritional components in soybean foods. Critical Reviews in Food Science and Nutrition, 34(1), pp 3167.
Massoud, F. l. (1967) Water Soil and Plant Relationship. New Publication-House, Alexandria.
Mohmed, A. E. E., Abd –Elmonem, E. M. and Salah, A. S. (2014) Effect of some techniques on long furrow irrigation efficiency. International Conference on Biological, Civil and Environmental Engineering (BCEE-2014) March 17-18, Dubai (UAE)
Mostafazadeh – Fard, B., Osroosh, Y. and Eslamion, S. (2006) Development and Evaluation of an Automatic Surge Flow Irrigation System. J. Agric. and Social Sci. 2 (3), 129-132.
Norwood, C.A. (1999) Water use and yield of dry land row crops as affected by tillage. Agron. J. 91, 108-115.
Okasha , E. M., Abdelraouf , R. E. and Abdou, M. A. A. (2013) Effect of Land Leveling and Water Applied Methods on Yield and Irrigation Water Use efficiency of Maize (Zea mays L.) Grown under Clay Soil Conditions. World Appl. Sci. J. 27 (2), 183-190. ISSN 1818-4952. © IDOSI Publications, 2013. DOI: 10.5829/idosi.wasj. 2013. 27.02.13614.
Öz, M. (2008) Nitrogen rate and plant population effects on yield and yield components in soybean. African J. of Biotec. 7 (24), 4464-4470.
Page, A. L., Miller, R. H. and Keeney, D. R. (1982) Methods of Soil Analysis Part 2: Chemical and Microbiological Properties, 2nd ed., Amer. Soc. of Agron., Madison, Wisconsin, USA.
Pereira, L.S., Oweis, T. and Zairi, A. (2002) Irrigation management under water scarcity.Agric. Water Manag. 57, 175-206.
Rashidi, M., Keshavarzpour, F. and Gholami, M. (2010) Effect of different tillage methods on yield and yield components of tomato (Lycoperiscon esculentum). J. of Agric. and Bio. Sci. 5(2), 26 - 30.
Rodríguez, J. A., Díaz, A., Reyes, J. A. and Pujols, R. (2004) Comparison between surge irrigation and conventional furrow irrigation for covered black tobacco cultivation in Ferralsol soil. Spanish J. Agric. Res. 2(3), 445-458.
Rosegrant, M. W., Cai, X. and Cline, S. A. )2002( Global Water Outlook to 2025, Averting an impending Crisis, Food Policy Report, A 2020 Vision for Food, Agriculture, and the Environment Initiative. International Food Policy Research Institute (IFPRI) and International Water Management Institute (IWMI). Colombo, Srilanka.
Sial, J. K., Khan, M. A. and Ahmd, N. (2006) Performance of surge irrigation under Borders. Pak. J. Agri. Sci. 43 (3-4), 186-192.
Singer, J.W., Logsdon, S. D. and Meek, D.W. (2008) Soybean growth and seed yield response to tillage and compost. Agron. J.100, 1039-1046.
Temperly, R. J. and Borges, R. (2006) Tillage and crop rotation impact on soybean grain yield and composition. Agron. J. 98, 999-1004.
Tang, L. S., Li, Y. and Zhang, J. H. (2005) Physiological and yield responses of cotton under partial root-zone irrigation. Field Crops Res. 94, 214–223.
Xiao, J., Lei, T.W., Jiang, P. F. and Yu, Y. D. (2004) Effects of water quality in furrow irrigation on corn yield and soil salinity. An ASAE/CSAE Meeting presentation Paper No. 042037, 1-4 August Ottawa, Ontario, Canada.
(Received 17/5/2015; accepted 30/10/2015)
ايملا مادختسإ ةءافك
ه
ةفلتخم ىرو ةمدخ قرط تحت ايوصلا لوفل
ىدانلا ىطاعملا وبأ لانم
*
و دادح دومحم ءافو
** * يضارلأا مسق – ةعارزلا ةيلك – لا ةعماج ةرهاق – ةزيجلا و ** ةيئاملا دراوملا ةرازو
ىرلاو – ىرلا ريوطت عاطق –
ةرهاقلا – رصم 8
ىماعل فيصلا ىمسوم للاخ ةيلقحلا ةبرجتلا تيرجأ 2112 / 2112 و 2112 / 2112 ىضبنلا ىرلا امه ىرلل نيتقيرط ريثأت ةنراقمل (
SI ) ىرلاو
طوطخلل ىلدابتلا (
AI ) ا ىرلا ةقيرطب طوطخلاب ةيداعل
( FI ) نيماظن تحت كلذو
ةبرتلا ةمدخل :
ةيديلقتلا ةمدخلا ماظن (
CT ) ةمدخلا مدع ماظنو (
NT ) ةءافك ىلع
هتانوكمو ايوصلا لوف لوصحم ةيجاتنإو ىرلا هايم مادختسا 8
للاخ جئاتنلا ترهظأ
ةقيرط قيبطت دنع تناك ةفاضم ىر هايم ةيمك لقأ نأ ىناثلاو لولأا ومنلا مسوم لا ةفاضم ىر هايم ةيمك ىلعأ امنيب ىلدابتلا ىر ىرلا ةقيرط قيبطت دنع تناك
طوطخلاب 8 ىرلا هايم ريفوت ىلا ىدأ ىضبنلا ىرلاو ىلدابتلا ىرلا ىتقيرط قيبطت
ةبسنب 27 % و 11 % ىماظن تحت طوطخلاب ىرلاب ةنراقملاب كلذو ىلاوتلا ىلع
عبتملا ةمدخلا 8
مادختسا دنع هايملل لوصحملا مادختسإ ةءافك و هايملا ةيجاتنأ تداز
لا ىرلا ةقيرط ماظن تحت طوطخلاب ىرلاب ةنراقملاب ىضبنلا ىرلا اهيلي ىلدابت
ىلاوتلا ىلع ةمدخلا مدع ماظنو ةيديلقتلا ةمدخلا 8
ىرلا ةقيرطل ةءافك ىلعأ تناك
ىرلا ةقيرطب ةنراقملاب كلذو ىلدابتلا ىرلا ةقيرط اهيلي ىضبنلا ىرلا ماظن تحت نيمسوملا لاك ىف طوطخلاب 8
لاب ىرلا ةقيرط تطعأ دقو ةيجاتنإ لضفأ طوطخ
ىلاوتلا ىلع ىلدابتلا ىرلا مث ىضبنلا ىرلا اهيلي لوصحملل 8
ىرلا ةقيرط تقوفت
نودب هتانوكمو ايوصلا لوف لوصحم ةدايز ىف ىلدابتلا ىرلا ةقيرط ىلع ىضبنلا ةبرتلل ةمدخلا مدع ماظنو ةمدخلا ماظن تحت ىونعم صقن 8
نأ جئاتنلا ةذه حضوت
بنلا ىرلا ةقيرط مادختسإ صقن دوجو مدع عم ىرلا هايم ريفوت ىلا ىدؤي ىض
ةمدختسملا ةمدخلا ىماظن تحت ايوصلا لوف لوصحمل ىونعم 8
ةمدخلا ماظن ىدأ
مادختسإ ةءافكو ىرلا ةايم ةيجاتنأ ةدايز ىلاو ىرلا ةايم ةيمك صقن ىلا ةيديلقتلا ةمدخلا مدع ماظنب ةنراقملاب ىرلا هايمل لوصحملا 8
دجوي مل، مغرلا ىلع يونعم قرف
مدختسملا ةمدخلا ىماظن نيب هتانوكم وأ لوصحملا ىف 8
ميق تدمتعأ ETc
ىلع
ميق لدعت نأ بجي كلذل مدختسملا ةمدخلا ماظنو ىرلا ةقيرط Kc
ماظنل اقبط ىرلا
مدختسملا ةمدخلاو 8
سايقو دصرل ديج رشؤم ةنأ ىلع ىئاملا داهجلأا ليلد تبثأ
ا قرط عم لوصحملل يئاملا داهجلأا ةفلتخملا ةبرتلا ةمدخو ىرل