70
ISSN 1392-2785 ENGINEERING ECONOMICS. 2007. No 4 (54) WORK HUMANISM
Application of Strategic Management Tools in Lithuania: Managers’ Knowledge
and Experience
Sigitas Vaitkevičius
Kauno technologijos universitetas Laisvės al. 55, LT-44309, Kaunas
Application of strategic management (SM) tools has been addressed by various researchers. Some of them aimed at defining it, while others discussed the suitability of certain tools for management practices used by spe-cific organisations. The scope of these studies varied from one to several countries. Such variation of research contexts suggests the multidimensional nature of this is-sue. A number of studies addressed the aspects of SM tools’ application in organisations of different types and sizes.
This paper discusses the experience of Lithuanian managers in application of various SM tools. Research findings are based on the questionnaire survey aimed at uncovering respondents’ views, attitudes towards and experience of application of twelve SM tools in business practice. To ensure statistical comparability the propor-tion of SME managers was reduced to 89 percent of the entire sample, while SMEs constitute 99.7 percent of all Lithuanian businesses. This enabled us to compare the experience of managers of big companies with that of managers of SMEs.
The responses were validated using psychometric statistics and consistency analysis, which enabled achiev-ing relatively high psychometric quality of the results. The structure of the questionnaire and the indicators of the psychometric quality generated by cluster analysis resulted in classification of the SM tools into two relative groups. The latter were subjected to qualitative interpre-tation taking into account the logical links of the cluster components and the percentage of approval.
The questionnaire consisted of semi-open questions. The data they produced was processed using the manifest and hermeneutic content analysis methods. The manifest content analysis revealed the areas of application of spe-cific tools, while hermeneutic content analysis allowed relating managers’ responses to specific attitudes to-wards strategic management. Analysis also revealed the SM tools, which are applied by Lithuanian managers most frequently, and whether they are applied correctly.
Keywords: tools, strategic analysis, strategic manage-ment, strategic planning, strategy.
Introduction
Application of SM tools in various countries has been discussed in numerous studies (Webster et. al., 1989; Clark and Scott, 1995; Clark, 1997; Miles et. al., 1997; Stonerhouse and Pemberton, 2002; Fuentes M. C. et. al., 2003; Rigby, 2001a, 2001b, 2005). Various scholars
fo-cused on its different aspects, ranging from development of taxonomies of tools’ application to its frequency and satisfaction. Many of these studies gave organisations the tools to select SM tools relevant to their needs.
Webster et al (1989) were among the first to analyse practical application of SM tools. They have developed taxonomy of 30 SM tools and techniques based on nine attributes. This taxonomy included tools and techniques, which can be defined as strategic management tools in a broader context. It covered such aspects as tool relevant data entry definition in terms of content and form, time, human and financial resources, skills and computer re-sources necessary for tool application. Being one of the first taxonomies of SM tools and techniques, it provided broad range of information on the criteria of tool selec-tion.
Clark developed another taxonomy of SM tools in 1997, even if he did not regard it as taxonomy. Clark and Scott (1995) researched and Clark (1997) later replicated the application of 66 SM tools in the New Zealand and UK companies. Clark (1997) discovered that companies mainly used 33 tools in strategic management and he de-scribed them using 32 stages of strategic management process, assigning to each stage five tools used by the surveyed companies for that particular purpose most fre-quently. This taxonomy was based on the practical appli-cation of SM tools at different stages of strategic man-agement process. Clark’s taxonomy is similar to that de-veloped by Webster et al (1989) – both of these taxono-mies have a defined relationship with the strategic man-agement (planning) process. It should be noted however that these authors use different structures of strategic management process: Clark’s view of the process is more detailed, so it can be argued that he expanded the taxon-omy developed by Webster et al, at the same time reveal-ing some additional aspects of practical application of SM tools.
Miles et al (1997) studied application of seven strate-gic planning techniques in the US agricultural sector. Differently from the above-mentioned taxonomies, in this case application of SM tools was compared between agri-cultural firms and other companies. The established sta-tistically significant differences between tools surveyed by Miles et al (1997) suggest that SM tools can be classi-fied not only by their role in the strategic management or strategic planning process, but also by industry.
71
tools include a number of SM tools. Since, like in Clark’s (1997) case, Rigby’s taxonomy was based on the tools’ practical application, he classified them based on a cer-tain rating, namely: frequency of tool’s application in the surveyed organisations, satisfaction of using it, and effort required for tool’s application. Thus, Rigby’s taxonomy is distinctive from the others in that he used such ‘sophis-tic’ criteria as satisfaction and effort. To some extent ‘ef-fort’ in this case can be regarded as a category integrating the criteria suggested by Webster et al (1989): time, hu-man and financial resources, skills and computer re-sources necessary for tool’s application.Summarising the literature review, it can be argued that each of the above-mentioned taxonomies reflects a different context of SM tools’ application, which suggests that the need for SM tools may be caused by different reasons.
The current study was aimed at uncovering Lithua-nian managers’ experience related to application of SM tools and at determining the patterns of this application in Lithuanian organisations.
Research methods used included questionnaire sur-vey and testing of managers using semi-open questions.
Questionnaire Survey Method: Sample and
Research Design
Demographic characteristics of the research sample Questionnaire survey was used to reveal respondents’ views and attitudes. Out of 500 copies of the question-naire 436 were distributed and 216 were returned. The number of valid questionnaires was 212, i.e. the return ratio came to 48.6%, which can be regarded as average.
The working concept of ‘managers’ included busi-ness owners who in many cases are also managers, mid-dle level managers and key specialists.
Out of 210 respondents 30% were owners, 33% top managers and 37% middle level managers and specialists. 95 companies represented in the sample were from the services sector, 47 – from wholesale or retail, 17 – from manufacturing, and 53 were involved in several sectors.
Although the sample included only relatively few manufacturing companies, their proportion reflects the real situation, as there are not many companies in Lithua-nia engaged in purely manufacturing activities. Despite a relatively smaller number, manufacturing companies are represented in the sample, not least because a few of them were assigned to the category ‘other’ in case they were also operating in other sectors, e.g. wholesale or retail.
An important characteristic is the number of employ-ees, which is one of the key indicators of the company size in many countries. Figure 1 shows distribution of cumulative frequencies that show the number of employ-ees of the surveyed companies.
One can see from Figure 1 that about 70% of the sur-veyed companies employ 50 or fewer employees. In order to achieve higher dispersion and comparability of the surveyed attributes, the sample included a larger propor-tion of big companies and organisapropor-tion (24 or 11%) than that actually found in Lithuania (0.3%).
Respondents were also asked to classify their compa-nies by size and type, and distribution of their responses is similar to that portrayed in Figure 1: 19% of the sur-veyed companies were classified as micro-enterprises, 37% as small enterprises, 35% as medium enterprises, and 9% as large enterprises. It should also be noted that respondents’ classification of their companies by size was related to the actual classification based on the number of employees and the EU enterprise definition.
0,0 10,0 20,0 30,0 40,0 50,0 60,0 70,0 80,0 90,0 100,0
0 4 8 14 22 26 35 48 55 69 85
106 136 155 243 500
1
.2
0
0
1
4
.0
0
0
Darbuotojų skaičius respondento įmonėje
R
e
s
p
o
n
d
e
n
tų
s
k
a
ič
iu
s
(p
ro
c
.)
Figure 1. Distribution of the number of respondents by the num-ber of employees in the enterprise, N=204
The measure of contingency between respondents’ evaluation and formal classification reached the limit of 0.564. Specifically, Cramers V was calculated. The rate of determination reached the limit of 0.563.
This suggests a rather adequate evaluation of com-pany size and status by respondents. It could be assumed that part of the dispersion unexplained by the coefficient of determination could be explained by the annual turn-over. However the questionnaire did not include this question for the sake of confidentiality.
Research tool and measured attributes
The questionnaire contained 12 open-ended and 12 close-ended questions related to application of SM tools and managers’ knowledge and experience. In addition, extra four open questions were asked. The overall struc-ture (dimensions) of measured attributes is presented in Table 1, which also shows scales and subscales, con-structed using factorial validation. In this case, ‘dimen-sion’, ‘scale’ and/or ‘subscale’ are used as synonyms.
Table 1
The Structure of Measured Attributes
Scales and sub-scales Number of test items
Application of SM tools: managers’ knowl-edge and experience
In total 12 attributes
Application of SM tools 6
Application of strategic analysis tools 6
Ratio of open and closed questions in the questionnaire
Number of closed questions 12
Number of open questions 12 (+4*)
* Four questions had an additional open question.
R
es
po
nd
en
ts
, %
72
This way of presenting questions and responses has certain advantages. Firstly, it allows diagnosing not only formal knowledge of respondents about strategy, but also its actual application. Secondly, it provides possibilities for open responses and comments, which give indirect indication about knowledge and ability to apply it. Fi-nally, open responses can be processed by content analy-sis (Šaparnis and Merkys, 2000), whether using quantita-tive or qualitaquantita-tive methodology.1. What is PORTER’s 5 FORCES model? If yes, briefly explain this model and the benefits of apply-ing it to business.
o
This is the first time I find out about ito
I have known about it but I do not have enoughknowl-edge to discuss it
o
Yes, I have heard about it; PORTER’s 5 FORCESmodel is:
Figure 2. An example of test segment illustrating typical question and response format
To determine the actual application of SM tools by Lithuanian businesses a test was constructed. The
classi-cal test theory is based on dichotomous responses, i.e. either the question has been answered correctly or not. However, for the purposes of this study, this response format was too schematic, therefore a three-stage re-sponse format was used allowing a possibility to provide written comment (Figure 2). This kind of test was sub-jected to factorial validation and control of internal con-sistency of responses (Table 2).
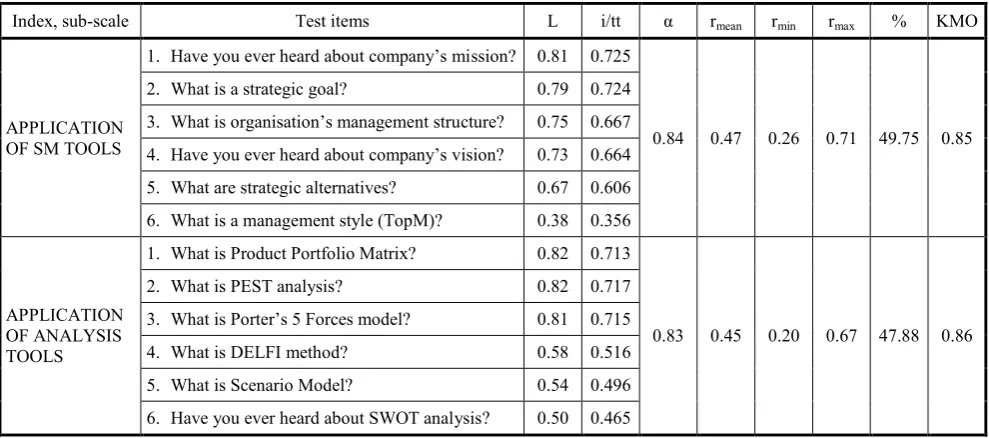
As one can see from the factor analysis, two theoreti-cally meaningful dimensions – ‘application of SM tools’ and ‘application of analysis tools’ – have been identified. Although both sub-tests were not long, they have a rather high internal consistency of responses, as suggested by Crobach’s Alpha coefficients 0.83 and 0.84. Differential capacity of test items is also rather high.
Content analysis of open and semi-open questions al-lowed assessing and summarising the experience of prac-tical application of SM and analysis tools by managers. Content analysis was conducted in two stages. Firstly, using manifest content analysis the statements were grouped based on similarity, later grouping the most similar statements into sub-categories. In the second stage, we conducted hermeneutic (latent) content analysis of sub-categories and individual attributes and con-structed the meaning categories defining the application of specific tools. Content analysis was used to analyse SWOT, Vision, Porter’s 5 Forces Model, Product Portfo-lio, Scenarios, PEST and DELFI tools.
Based on the findings of the study, it can be argued that the tool and the test used in the research are of high methodological quality or, in some cases, at least tolerable.
Table 2
Application of SM Tools: Managers’ Knowledge and Experience, N=212
Index, sub-scale Test items L i/tt α rmean rmin rmax % KMO
APPLICATION OF SM TOOLS
1. Have you ever heard about company’s mission? 0.81 0.725
0.84 0.47 0.26 0.71 49.75 0.85
2. What is a strategic goal? 0.79 0.724
3. What is organisation’s management structure? 0.75 0.667
4. Have you ever heard about company’s vision? 0.73 0.664
5. What are strategic alternatives? 0.67 0.606
6. What is a management style (TopM)? 0.38 0.356
APPLICATION OF ANALYSIS TOOLS
1. What is Product Portfolio Matrix? 0.82 0.713
0.83 0.45 0.20 0.67 47.88 0.86
2. What is PEST analysis? 0.82 0.717
3. What is Porter’s 5 Forces model? 0.81 0.715
4. What is DELFI method? 0.58 0.516
5. What is Scenario Model? 0.54 0.496
6. Have you ever heard about SWOT analysis? 0.50 0.465
L – Factor; i/tt –Corrected Item-Total Correlation (Item-total-correlation); α – Cronbach’s Alpha Based on Standardized Items;
rmean –Inter-Item Correlation, mean; rmin –Inter-Item Correlation, minimum; rmax –Inter-Item Correlation, maximum; % –
Extrac-tion Sums of Squared Loadings % of Variance; KMO –Kaiser-Meyer-Olkin Measure of Sampling Adequacy. Calculating Tool: The principal analysis of components
The surveyed managers’ knowledge and experience with regard to SM tools have been classified using hier-archical cluster analysis. Cluster model featured in Figure 3 was constructed using Ward’s method.
Managers’ survey results: knowledge and
ex-perience
classi-73
fied by two criteria: 1) management and 2) analysis (Ta-ble 2). More detailed analysis of the cluster model (Ta(Ta-ble 4) suggests that, based on the index mean, it can be di-vided into two static categories: 1) tools, which are fre-quently applied and 2) tools, which are rarely applied. It should be noted that, according to distribution of the positive responses, SWOT analysis is more frequently used in strategic management of Lithuanian organisations than analysis of organisation’s management structure. For this reason, SWOT analysis appeared in the cluster of strategic management and not that of strategic analysis methods.Figure 3. Cluster model of SM methods (variable names are presented in Table 3)
The cluster model suggests that strategic analysis tools are less frequently applied in the strategic manage-ment practice. At the same time, based on the literature review and results of this study, it can be argued that SWOT is the most frequently used strategic analysis tool in Lithuania, similarly to the UK and New Zealand. However the possibility of directly comparing application of tools across these countries is limited due to the use of different research methodologies.
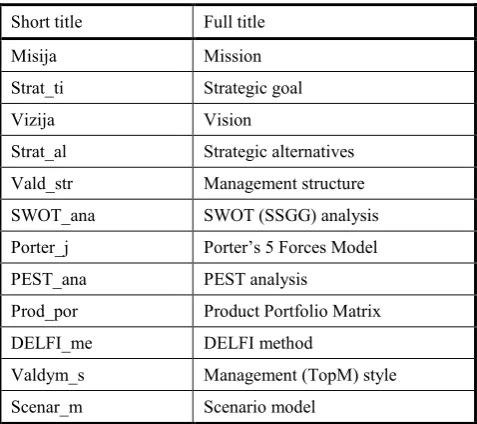
Table 3
Abbreviations Used in the Cluster Model
Short title Full title
Misija Mission
Strat_ti Strategic goal
Vizija Vision
Strat_al Strategic alternatives
Vald_str Management structure
SWOT_ana SWOT (SSGG) analysis
Porter_j Porter’s 5 Forces Model
PEST_ana PEST analysis
Prod_por Product Portfolio Matrix
DELFI_me DELFI method
Valdym_s Management (TopM) style
Scenar_m Scenario model
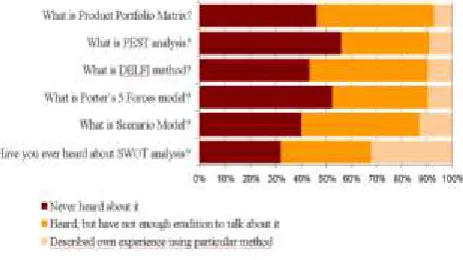
Cluster analysis showed that Lithuanian managers are more familiar with SM tools than with strategic analysis tools (Figures 4 and 5).
As illustrated in Figure 4, over half of the surveyed managers described their experience in relation to vision development (~59%) and strategic goals (~52%). Slightly less than half (~48%) shared their experience in relation to practical application of mission. The least number of the surveyed managers (~14%) told about their experi-ence of applying management style (TopM). Overall, findings suggest that a rather high proportion of manag-ers, when developing organisational strategy, are apply-ing SM tools and that only a small number of managers have never heard about specific SM tools before.
Table 4
Application of Strategic Management and Analysis Tools in Practice
(Results of Hierarchical Cluster Analysis, Nmanagers = 212)
Clus-ter/type
number Mean Type
1
Have you ever heard about
com-pany’s vision? 2.55
Frequently applied What is a strategic goal? 2.48
What is organisation’s management
structure? 2.40
Have you ever heard about
com-pany’s mission? 2.39
What are strategic alternatives? 2.20
Have you ever heard about SWOT
analysis? 2.00
2.34
2
What is a management style (TopM)? 1.82
Rarely applied What is Scenario Model? 1.73
What is DELFI method 1.66
What is Product Portfolio Matrix? 1.61
What is Porter’s 5 Forces model? 1.57
What is PEST analysis? 1.53
1.65
Figure 4. Application of SM tools, work out of separate tasks, percent, N=212
74
argued that analysis in Lithuanian organisations is much less common activity than ‘overall’ strategic manage-ment.Figure 5. Application of analysis tools, work out of separate tasks, percent, N=212
Summarising the findings of the study, it can be ar-gued that strategic management in Lithuanian organisa-tions is only to low extent based on formal analysis. In-tuitive application of SM tools is accompanied by par-ticularly sophistic strategic analysis (not based on hard data). This claim is partly confirmed by high frequency of SWOT analysis application in Lithuanian organisa-tions.
Strategic management and analysis tools:
areas of practical application
Content analysis revealed that Lithuanian organisa-tions often confuse company’s mission with goals and/or vision. This suggests that a number of the surveyed man-agers use mission either rarely or incorrectly. Relatively few surveyed managers have defined mission correctly, identifying it with company’s role in society. A number of managers defined it as an expression of competitive-ness. In one case, a manager expressed his disappoint-ment with mission in these words: ‘nice statement which often has nothing in common with the quality of com-pany’s services, number of clients or sales...’
To summarise, Lithuanian managers have difficulties with developing organisational mission due to the rather rapid changes in the market and frequent adjustment of their companies’ operation areas. Also, it should be noted that mission is not common in Lithuanian organisations in terms of being a part of company’s identity.
The situation with vision is completely different however. Content analysis suggests that vision was rather often described as an imaginary model of the company or its operation – in quite a few cases vision was identified with the notions of ‘place’ and ‘operation’. In other words, vision was often described as an imaginary posi-tioning of an organisation in relation to space and opera-tion. It was also frequently identified with formal plan-ning procedures, managers regarding it as a step in the planning process. It must be noted that a much larger per-centage of managers have correctly described the notion of the vision as opposed to the mission. This may indicate that Lithuanian managers are more concerned with posi-tioning their businesses in the future, which suggests
rela-tive orientation to the process approach1. It is based on
the view that it is important to know the aims, while the environment will adjust to them.
Content analysis of responses to the question ‘What is a strategic goal?’ further confirmed the assumption about relative preference for the process approach. Some managers tend to focus on one specific goal at a certain point in time, suggesting that the aspired aim is seen as more static than company’s environment.
Analysis of perception of a strategic goal also re-vealed that a number of managers related it to the formal planning procedures. This suggests that some Lithuanian managers use classical approach to strategy. As it was mentioned, features of formal planning have also been identified in the analysis of mission and vision. Some managers related all these concepts to each other and in-dicated their logical sequence. However, calling this a classical approach is complicated by a relatively small number of statements indicating company’s focus on profit maximisation, for example: ‘business expansion, growth of financial capacity’, ‘a goal that company must reach in a certain period of time, e.g. financial goal, posi-tion in the market’. Some statements could be classified as suggesting systemic approach to strategy, e.g. ‘A long-term goal defining organisation’s future and politics. Benefits: clearly defined direction’. Responses of a num-ber of managers also indicate evolutionary approach to strategy, e.g. ‘a goal which in a certain period of time is a priority goal for the company. The extent of achieving this goal will make a major impact on the other goals of the company (profit, turnover, etc.)’. Another example: ‘To achieve business development and profitability the goals must be strategic, planned and consistent; only then they will be achieved.’
To summarise, responses of the majority of managers seem to be representing the process approach to strategy, while other approaches are represented to a lesser extent. However the research sample was not big enough to make claims about clear patterns characteristic to small, medium and large companies. This could be a question for further research.
In terms of the strategic analysis tools, content analy-sis related to SWOT shows that this method is in most cases perceived as helping to identify company’s strengths, weaknesses, opportunities and threats. This suggests that a number of the surveyed managers referred to the theoretical knowledge of the SWOT rather than its practical application experience while others probably failed to focus on the question, which resulted in a partial and very academic description of this method. Some managers have not clearly defined the SWOT method. Part of them described it as a method used for analysing organisation’s internal environment while others indi-cated that it is used for analysing the external environ-ment. These statements suggest that although these man-agers have heard about SWOT, having not applied it in practice they described it only in part. Only a small part of the managers indicated the subject of SWOT analysis.
SME managers have willingly shared their
75
ences of practical application of the SWOT method. A rather large number of managers use SWOT for assessing their business competitiveness, and many of these man-agers reported its everyday use. Some manman-agers use SWOT to analyse their competitors. Content analysis suggests that SWOT is frequently used in the formal organisational planning, which could be explained by Lithuanian SMEs increasingly working on a project basis.Porter’s 5 Forces model was known to relatively few managers and was defined as a method for assessing competitiveness. Although the method is aimed at analys-ing five forces, some definitions suggest that it overlaps with SWOT analysis, e.g. ‘this method is used for identi-fying company’s threats and opportunities under the ef-fect of the following environments: suppliers’ and cli-ents’ power, threat of substitutes and new competitors, existing competition…’. This can be explained by the fact that the data collected using Porter’s model can be further analysed using SWOT.
Product Portfolio Matrix, likewise Porter’s model, was identified with company’s competitiveness, only in this case in relation to products and their positioning in the market. In some cases managers related it to product positioning in relation to all company’s products: ‘Rela-tive importance of company’s certain products/ services. Benefits: developing certain products, giving up the non-profitable ones’. In other cases it was related to the prod-ucts on the market: ‘All prodprod-ucts on the market. It is im-portant to maintain our position in all parts of the matrix in relation to our competitors.’ This suggests that Lithua-nian managers are rather well informed about the Product Portfolio method.
However a rather low number of responses to this question suggest that this method, likewise Porter’s model, is relatively rarely applied in strategic manage-ment by Lithuanian organisations.
Scenario model was described by managers as an tool for modelling the expected events and advanced decision-making, e.g. ‘a model of forecasted situations’, ‘simula-tion of future activities – forecasting of future results: forecast of several future ‘scenarios’ and their possible results’. Differently from other methods, some managers assigned the scenario model to formal strategic planning, e.g. ‘it is recording company’s actions related to the fu-ture’, ‘when a certain plan is developed and followed’, ‘outlining the actions and measures of achieving com-pany’s strategic goal’.
Content analysis of PEST descriptions showed that this method, although rarely, is used by Lithuanian or-ganisations in strategic management. Nevertheless, some statements emphasising globalisation suggest that larger companies more commonly apply PEST analysis: ‘analy-sis of political, economic, social, technological and edu-cational trends and challenges in the global and national context.’ It should be noted however that in this case a manager is referring to a modified version of PEST ad-justed for educational institutions. A rather small number of responses in relation to PEST make it difficult to de-termine the relationship of PEST application to the com-pany size.
Certain distinctions can be noticed in relation to
managers’ description of the DELFI method. Differently from other tools, DELFI method was defined as relevant for decision-making, e.g. ‘this is a decision-making method, using which decisions are made by a certain group. Its benefit for organisation is that this group can arrive at the best decision through discussion.’ This sug-gests that some managers have good knowledge about application of the strategic analysis methods. For example, some of them correctly pointed out such details of this method as expert survey by post, advance data collection, etc. (‘data is collected from experts by post and later compared several times’, ‘expert evaluation method; results of questionnaires given to pundits of certain areas are summarised and given to experts to evaluate’).
Content analysis of the open questions revealed the ability of Lithuanian managers, including those of SMEs, to use strategic analysis tools on a professional level. At the same time, it can be concluded that managers apply strategic management methods relatively more frequently than strategic analysis methods, although they made mistakes more frequently when defining strategic man-agement methods. One possible way to explain this could be that knowledge gained through general education is not sufficient to engage in effective strategy develop-ment.
Conclusions
1. Findings of the study suggest that strategic man-agement in Lithuanian organisations is to a little extent based on formal analysis. It is characterised by intuitive application of strategic management tools accompanied by especially sophistic strategic analysis (not based on hard data). This claim is partly confirmed by an especially frequent applica-tion of SWOT analysis in strategic management of Lithuanian organisations.
2. Cluster analysis showed that the surveyed tools applied in Lithuanian strategic management prac-tice can be classified based on two relatively theo-retically significant criteria: 1) management, and 2) analysis.
3. Based on the index mean, strategic management tools can be classified into the two static catego-ries: 1) those relatively frequently applied in strategic management, and 2) those relatively ig-nored.
76
References1. Clark, D. N. Strategic Level MS/OR Tool Usage in the United Kingdom: an Empirical Survey / D. N. Clark, J.L. Scott // Journal of the operational research society, 1995, Vol. 46, p. 1041-1051. 2. Clark, D. N. Strategic management tool usage: a comparative study
// Strategic Change, 1997, Vol. 6, p. 417-427.
3. Fuentes, C.M. New Research ISO 9000-based Quality Assurance Approaches and Their Relationship with Strategic Analysis / C. M. Fuentes, F. B. Benavent, M. A. E. Moreno, T. F. G. Cruz, M. P. del Val // International Journal of Quality & Reliability Management, 2003, Vol. 20, issue 6, p. 664-690.
4. Miles, M.P. Strategic planning and agribusiness: an exploratory study of the adoption of strategic planning techniques by co-operatives / M.P. Miles, J.B. White, L.S. Munilla // British food Journal, 1997, Vol. 99, issue 11, p. 401-408.
5. Rigby D. K. Management Tools 2001-Global // Paper presented at the meeting on the Two Copley Place Boston, Massachusetts. 2001a, June.
6. Rigby D. K. Management tools 2005. Bain&company. Retrieved November 5, 2005, from http://www.bain.com/management_tools/ 2005_tools_strategy_brief.pdf
7. Rigby D. K. Putting Tools to the Test: Senior Executives Rate 25 Top Management Tools // Strategy and leadership, 2001b. Vol. 3, issue 29, p. 4-12.
8. Stonehouse, G. Strategic Planning in SMEs – Some Empirical Findings / G. Stonehouse, J. Pemberton // Management Decision, 2002, Vol. 9, issue 40, p. 853–861.
9. Šaparnis, G. Kokybinių ir kiekybinių metodų derinimas mokyklinės vadybos diagnostikoje: hipotezė ir pirmieji rezultatai / G. Šaparnis, G. Merkys // Socialiniai mokslai, 2000, Vol. 2, issue 23, p. 43-55. 10. Webster, J.L. The Managers Guide to Strategic Planning Tools and
Techniques / J.L. Webster, W.E. Reif, J.S. Bracker // Planning re-view, 1989, Vol. 22, p. 1-9.
11. Whittington, R. What is Strategy and Does It Matter? UK: Thom-son Learning, 2001
Sigitas Vaitkevičius
Strateginio valdymo instrumentų taikymas Lietuvoje: vadovų žinios ir patirtis
Santrauka
Šiame straipsnyje aptariama praktinė Lietuvos vadovų patirtis taikant strateginio valdymo instrumentus bei įvertinamos jų pastarųjų instrumentų naudojimo žinios. Ligi šio straipsnio strateginio valdymo instrumentų taikymas tirtas įvairių studijų metu. Vienos jų buvo skir-tos instrumentų taikymui apibrėžti, kiskir-tos įvertinti konkrečių instru-mentų patrauklumui organizacijose vykdomai valdymo praktikai. Dalis šių tyrimų buvo atlikti vienoje šalyje, kitų dėka apžvelgtas instrumentų taikymas bent keliose skirtingose šalyse. Toks tyrimo konteksto kaitaliojimas byloja apie tyrimo problemos įvairialypišku-mą. Atlikti tyrimai leido pažinti instrumentų taikymo aspektus pri-klausomai nuo organizacijos dydžio ir tipo.
Literatūros analizė atskleidė faktą, jog ligi šiol jau sukaupta daug duomenų apie strateginio valdymo instrumentų taikymo prakti-ką įvairiose šalyse (Webster et. al., 1989; Clark ir Scott, 1995; Clark, 1997; Miles et. al., 1997; Stonerhouse ir Pemberton, 2002; Fuentes M. C. et. al., 2003; Rigby, 2001a, 2001b, 2005). Iki straipsnyje apta-riamo tyrimo strateginio valdymo instrumentų taikymo praktika tirta ir apžvelgta įvairiais aspektais: pradedant instrumentų taikymo takso-nomijų formavimu ir baigiant instrumentų taikymo dažnumu bei pasitenkinimu tirtose organizacijose. Minėti tyrimai, sudarė galimy-bes organizacijoms lengviau pasirinkti praktiniam strateginiam val-dymui tinkamus instrumentus.
Literatūros apžvalgos rezultatai leido teigti, kad kiekviena aptar-ta aptar-taksonomija perteikia skirtingą strateginio valdymo instrumentų taikymo kontekstą, kurio specifiškumas byloja, jog strateginio
val-dymo instrumentų poreikis gali priklausyti nuo įvairių priežasčių. Šių taksonomijų lyginamoji analizė rodo, kad gali būti ir daugiau priežas-čių, lemiančių strateginio valdymo instrumentų pasirinkimą, kurių ligi šiol išskirti neleido tyrėjų naudoti tyrimo metodai. Be to, iki šio tyrimo strateginio valdymo instrumentų taikymas Lietuvos organiza-cijose nebuvo tirtas, todėl šis tyrimas įgalino pažinti Lietuvos organi-zacijų gebėjimus taikyti strateginio valdymo instrumentus savo veik-loje.
Šio tyrimo tikslas buvo ištirti Lietuvos vadovų patirtį taikant strateginio valdymo instrumentus ir nustatyti strateginio valdymo instrumentų taikymo dėsningumus Lietuvos organizacijose.
Tyrimo objektas – strateginio valdymo instrumentai.
Tyrimo metodai: vadovų anketinė apklausa ir testavimas nau-dojant pusiau atviro tipo klausimus.
Klausimyne buvo 12 klausimų, atskleidžiančių Strateginio val-dymo instrumentų taikymą: vadovų žinias ir patirtį. Visi jie uždaro tipo ir buvo papildyti to paties turinio atvirais klausimais. Taip pat buvo užduoti keturi papildomi atviro tipo klausimai.
Faktinio strateginio valdymo instrumentų taikymo Lietuvos verslo praktikoje tyrimui sukonstruotas specialus testas. Jis skyrėsi nuo klasikinėje testų teorijoje priimtinų testų konstravimo principų tuo, jog sukonstruoto testo atveju pritaikytas trijų pakopų atsakymo formatas, kai trečioje atsakymo kategorijoje numatyta papildoma galimybė atsakymą pateikti raštu. Tokia užduočių ir atsakymų patei-kimo forma pasirinkta dėl kelių priežasčių. Pirma, diagnozuotas ne tik formalus respondentų informuotumas apie strategiją, bet ir fakti-nis jos taikymas. Antra, atsirado galimybė pateikti atvirą atsakymą, komentarą, iš kurio netiesiogiai jau galima spręsti apie žinias ir pasi-rengimą taikyti strateginio valdymo instrumentus. Galiausiai atviri atsakymai vėliau galėjo būti apdorojami taikant kontentinę analizę. Savo ruožtu kontentinė analizė gali būti atliekama kiekybinės ir ko-kybinės metodikos priemonėmis.
Sudarytas testas buvo tikrinamas faktorinės validacijos ir atsa-kymų vidinės konsistencijos kontrolės būdu. Rezultatas – išskirtos dvi teoriškai prasmingos dimensijos – „strateginio valdymo instru-mentų taikymas“ ir „analizės instruinstru-mentų taikymas“.
Į sudarytą klausimyną įtrauktų atvirų ir pusiau atvirų klausimų kontentinė analizė leido geriau įvertinti ir apibendrinti vadovų strate-ginio valdymo ir analizės instrumentų praktinio taikymo patirtį. Kon-tentinė analizė vyko dviem etapais. Pirmajame etape buvo atliekama manifestinė kontentinė analizė. Ją atliekant sugrupuoti teiginiai pagal panašumą. Vėliau panašiausi teiginiai sujungti į subkategorijas. Ant-rajame etape atlikta hermeneutinė (latentinė) subkategorijų ir pavie-nių požymių kontentinė analizė ir sudarytos prasminės kategorijos, apibrėžiančios konkrečių instrumentų naudojimą įmonės veikloje. Pasitelkus kontentinę analizę, apžvelgti SWOT, Misija, Vizija, Porte-rio 5 jėgų, Produktų portfelio, Scenarijų, PEST ir Delfi instrumentai.
Galima teigti, kad pavyko sukurti nuomonių ir nuostatų tyrimo instrumentą bei testą, kurio metodinė kokybė yra aukšta arba atskirais atvejais bent jau toleruotina.
Apklaustų vadovų žinios apie strateginio valdymo instrumentus ir praktinio jų taikymo patirtis klasifikuoti naudojant klasterinės analizės hierarchinį modelį. Klasterinės dendrogramos analizė paro-dė, kad tirti Lietuvos organizacijų strateginio valdymo praktikoje naudojami instrumentai remiantis respondentų atsakymais gali būti suklasifikuoti pagal du sąlyginius kriterijus: 1) valdymo ir 2) analizės (žr. 2 lentelę). Atliekant detalesnę analizę nustatyta, kad klasterinį modelį pagal indekso vidurkį galima skirti į dvi statistines kategori-jas: 1) organizacijos strateginiame valdyme realizuojamus instrumen-tus ir 2) apleisinstrumen-tus.
Sudarytas klasterinis modelis parodė, kad analizės instrumentai rečiau naudojami tirtų organizacijų strateginio valdymo praktikoje. Atlikus tyrimą paaiškėjo, kad daugelis vadovų, formuodami įmonės strategiją, praktiškai taiko strateginio valdymo instrumentus, ir tik nedidelė dalis vadovų apie konkrečius strateginio valdymo instru-mentus girdėjo pirmą kartą.
77
instrumentų taikymo patirtį. Atlikto tyrimo rezultatai rodo, kad anali-zės veiksmai Lietuvos organizacijose kur kas labiau apleista sritis nei „bendrai paėmus“ strateginis valdymas.Atvirų atsakymų kontentinė analizė parodė Lietuvos organizaci-jų vadovų, taip pat ir MVĮ vadovų, gebėjimą naudoti strateginės ana-lizės instrumentus profesionaliai. Be to, šia analize nustatyta, jog vadovai palyginti dažniau naudoja strateginio valdymo, o ne analizės metodus. Tai patvirtino palyginti didesnis apibūdinusių strateginio valdymo instrumentų naudojimą vadovų skaičius. Vertinant šį teiginį paradoksaliai atrodo kitas faktas – Lietuvos organizacijų vadovai dažniau klydo apibūdindami strateginio valdymo, o ne strateginės analizės metodus. Hipotetiškai tai gali būti paaiškinta tuo, kad ben-drojo išsilavinimo žinių sėkmingam įmonės strategavimui nepakanka.
Atliktas strateginio valdymo instrumentų taikymo tyrimas Lietu-vos organizacijose leido daryti šias pagrindines išvadas:
1. Tyrimo rezultatai parodė, jog Lietuvos organizacijose vyk-domas strateginis valdymas yra beveik nepagrįstas formalia analize. Jam būdingas strateginio valdymo instrumentų nau-dojimas. Šiuos instrumentus taikant intuityviai atliekama itin sofistikuota (formaliais faktais nepagrįsta) strateginė analizė. Šį teiginį iš dalies patvirtina ir ypač aukštas SWOT analizės taikymas Lietuvos organizacijų strateginio valdymo
praktikoje.
2. Iš klasterinės dendrogramos analizės paaiškėjo, kad tirti Lie-tuvos organizacijų strateginio valdymo praktikoje naudojami instrumentai gali būti klasifikuojami pagal du sąlyginius teo-riškai reikšmingus kriterijus: 1) valdymo ir 2) analizės. 3. Analizuojant klasterinį modelį nustatyta, kad pagal indekso
vidurkį strateginio valdymo instrumentus galima skirti į dvi statistines kategorijas: 1) sąlygiškai realizuojamus organiza-cijos strateginiame valdyme instrumentus ir 2) sąlygiškai ap-leistus.
4. Atvirų atsakymų kontentinė analizė parodė Lietuvos organi-zacijų vadovų, taip pat ir MVĮ vadovų, gebėjimą naudoti strateginės analizės instrumentus profesionaliai. Šia analize nustatyta, jog vadovai palyginti dažniau naudoja strateginio valdymo, o ne analizės metodus. Pastarojo teiginio šviesoje paradoksaliai atrodo faktas, kad Lietuvos organizacijų vado-vai dažniau klydo apibūdindami strateginio valdymo, o ne strateginės analizės metodus. Hipotetiškai tai gali būti paaiš-kinta tuo, kad, matyt, vien bendrojo išsilavinimo žinių sėk-mingam įmonės strategavimui nepakanka.
Raktažodžiai: instrumentai, strateginė analizė, strateginis valdymas, strate-ginis planavimas, strategija.
The article has been reviewed.