DETECTION OF OIL-SPILLAGE DISASTERS IN NIGERIA
Bakpo, F. S.and Agu, M. N.
Department of Computer Science University of Nigeria, Nsukka
email: [email protected]
ABSTRACT
Oil-spillage disaster is a phenomenon that has thrived and come to stay especially in the Niger Delta region in Nigeria where crude oil is produced both on-shored and off-shored resulting in the loss of billions of crude oils and corresponding loss of income every year. Such disasters can occur at any point within the entire oil-pipeline topology, which is geographically dispersed across the country spanning from the extreme south-south through south-east and south-west to the north central. A major cause of oil spillage disaster is oil-pipeline vandalism, which has recently become one of the primary means of defrauding the Nation by oil bunkers and even angry youths of the host communities. Currently in Nigeria oil spillage disaster is monitored manually under the auspices of the National Emergency Management Agency (NEMA) and involves huge human labor as gathering of useful data has proven to be difficult and untimely using traditional data collection methods given the peculiarity of the operational terrain. An automated data collection design (ADCD) for real-time data collection on oil spillages in the on-shore, mangrove, thick forest and off-shore areas of the Nation offers the much needed solution. This paper examined some current procedures for data collection and highlighted inherent pitfalls. It further presented a robust architecture and model for real-time detection of oil-spillage and discussed incorporated contemporary technological requirements. The major advantages and disadvantages of the proposed system were also discussed.
Keywords: Data collection, wireless networks, detection, neural networks, oil- spills
1. INTRODUCTION
Nigeria is the largest oil producer in Africa and the sixth largest oil exporter in the world [1]. The mainstay of Nigeria’s economy is the petroleum sector, contributing about 90% of the nation’s foreign exchange earnings and about 25% of the Gross Domestic Products [2]. A significant proportion of the nation’s oil is produced onshore, although recently oil production has witnessed increased activities in the off-shores. The crude oil
growth, studies have shown that it presents increased potential for environmental pollution and degradation [3, 4]. It has also been observed that thousands of barrels of oil have been spilled into the environment through oil pipelines and storage facilities’ failure in Nigeria [5]. The causes of pipeline damage and leakage vary greatly from material defects, pipe corrosion and contact with ship anchors in the offshore operations to vandalism of pipeline onshore.
Oil spillage disaster through pipeline vandalism is a phenomenon that has thrived and come to stay especially in the Niger Delta region in Nigeria, where crude oil is produced both on-shored and off-shored. This has resulted to the loss of billions of crude oils and corresponding loss of income every year. An average of 35,000 barrels of
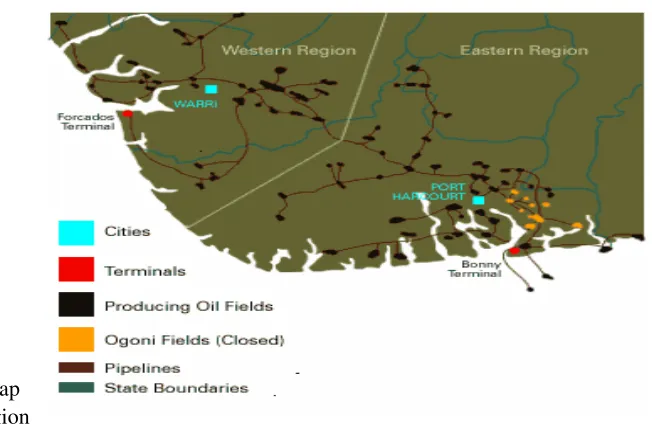
crude oil is stolen per day in circumstances that threaten lives and the environment [5]. Apart from the lost of lives and property through pipeline fire, the run-off from impacted sites usually degrade the quality of the fresh water sources which serves the domestic rural water supply needs of most communities in Nigeria. The enormous oil installations deployed in the Niger Delta region explains their vulnerability to vandalism. Presently, the Niger Delta region plays host to 606 oil fields of which 355 fields are onshore while 251 are offshore with over 3,000 kilometers of pipelines crisscrossing the region and linking some 275 flow stations to various export terminals. Figure 1, shows the map of the Niger Delta region in Nigeria.
Fig. 1 Map showing Niger
Delta Region in Nigeria
Oil spillage disasters resulting from pipeline vandalism have continued to be a challenge to spill management in Nigeria and at the moment has defiled all contingency arrangements of oil industry operators with most incidents occurring along major pipelines and manifolds. The major reasons attributed to vandalism of pipeline vary ranging form economic to political. Some of the attacks are carried out by militants who say they are fighting for a fairer share of the natural wealth, others by criminal gangs engaged in a multi-million-dollar trade in stolen oil. It was also discovered in a recent released by security experts that groups of local community youths alias “area youths” frustrated by poverty and a lack of job opportunities, sabotage pipelines in the hope of wining repair contracts [6]. In 2006 Shell Petroleum Development Company- one of the major oil operators in Nigeria recorded 241 oil spill incidents. Of this number sabotage accounted for 165 (69%), while 50 (20%) were controllable incidents (resulting from equipment failure, corrosion or human error). The remaining 26 incidents are yet to be classified due to access restrictions either by communities or the current insecurity in the Niger Delta. Measures taken so far by the Government to manage oil spillages in
Nigeria include the setting up of various legislative frameworks to govern the petroleum industry such as: Federal Environmental Protection Agency Act, 1990; National Oil Spill Detection and Response Agency Act, 2006, National Emergency Management Agency (NEMA), Ministry of Niger Delta, etc. Currently, oil spillage is monitored manually under the provision of the above acts and involves huge human labor as gathering of useful data has proven to be difficult and untimely using traditional data collection method. The rising tide of violence, hostage taking in the Niger Delta region also has significant consequences on oil spill management acts particularly in the area of quick access to spill sites. In this paper, we proposed an automatic data collection design for real-time detection of oil spillage in on-shore, offshore and mangrove forests of the country.
2. COMPARISON OF CURRENT DATA COLLECTION PROCEDURES
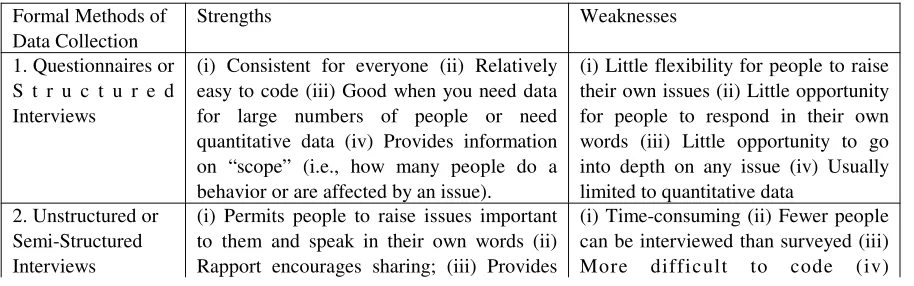
This section attempts to compare the formal data collection procedures [7]. The strengths and limitations of each method are summarized in Table 1
Table 1: Formal Data Collection Procedures
Formal Methods of Data Collection
Strengths Weaknesses
1. Questionnaires or S t r u c t u r e d Interviews
(i) Consistent for everyone (ii) Relatively easy to code (iii) Good when you need data for large numbers of people or need quantitative data (iv) Provides information on “scope” (i.e., how many people do a behavior or are affected by an issue).
(i) Little flexibility for people to raise their own issues (ii) Little opportunity for people to respond in their own words (iii) Little opportunity to go into depth on any issue (iv) Usually limited to quantitative data
2. Unstructured or Semi-Structured Interviews
(i) Permits people to raise issues important to them and speak in their own words (ii) Rapport encourages sharing; (iii) Provides
information on “dept” (why do people feel or act as they do and what does it mean to them) (iv) Open-ended responses can be analyzed qualitatively or quantitatively
Interviewers need in-dept training to interview well
3. Focus Groups (i) Interaction encourages people to elaborate on their responses (ii) Ideas can be shared (iii) More people can be interviewed in groups than one-to-one (iv) Program staff can get a lot of good suggestions in a short period of time.
(i) Some people do not speak well in groups and others may dominate discussions (ii) Will only work if moderator has good facilitation skills (iii) Not good if you need data from individuals or if topic is sensitive (iv) Scheduling can be problematic for busy people or those with family responsibilities
4. Journals (i) Provide an ongoing record of people’s felt experiences with the program (ii) Focus participants and others on their experiences as they happen (iii) Can provide extensive detailed data to be used in analyses or as ideas for interviews or focus groups
(i) Time-consuming to keep (ii) Some people do not communicate well in written English (iii) Some people may feel uncomfortable writing about themselves or feel they are giving up their privacy.
5. Observation (i) Provides data other than verbal self-report (ii) Provides an opportunity for in-depth study of behavior, nonverbal communication and the physical and social environment (iii) Allows immersion in the whole context of the program.
(i) Time-consuming and often expensive (ii) May seem intrusive to program staff and participants (iii) Observers need extensive training (iv) Conflict over role may arise (e.g. to what extent can observer be a participant?).
6. Population Statistics
(i) Provide information about change on a broad scale (ii) Useful if program is geared to a large population
(iii) Usually are easily available and regularly collected (though government-spending cuts have led to less availability of some stats or higher charges for accessing the data)
(i) Limited to quantitative data (ii) Are influenced by many non-program factors (iii) Short-term changes may be chance fluctuations rather than trends (iv) Only useful if large samples from large populations.
3. A R C H I T E C T U R E F O R AUTOMATIC DATA COLLECTION DESIGN
• Functions Description
The major functionalities of the automatic data collection design are as follows: (i) to facilitate real-time data collection and (ii) to react to a suspicious pipeline cut or leakage. Consequently, the design of the architecture is based on the following conditions:
(i) The system provides a non-stop monitoring of pipeline topology within a piloted community of operation. (ii) The entire pipeline topology within the
the segment as they relate to a generic set of functions supported such as; sensor identification (SID), sensor location (SL), oil pressure level (OPL), system time, etc.
(iii) The set of wireless sensors known as wireless sensor network covering the piloted community is monitored by a dedicated satellite, which is connected via GPRS modem to a server in one central office. Real-time data collected by the office are further preprocessed using a technique of artificial neural network known as self-organizing neural network for a better pattern (event) recognition and classification. (iv) For a pipeline cut or leakage to occur,
a third-party (or an intruder) must apply a certain degree of force to a cross-section of the pipeline. If the degree of forces applied exceeds a preset threshold value, the sensor node of the affected segment sends an alarm to the server, which in turn is detected by the central office. The system is interrupt-driven. This enables appropriate service routines to be deployed for inspection without was t i ng t i m e. Th e propos ed architecture is shown in Figure 2.
Fig . 2 Oil -Pip elin e cut det ecti on system
• Model Description
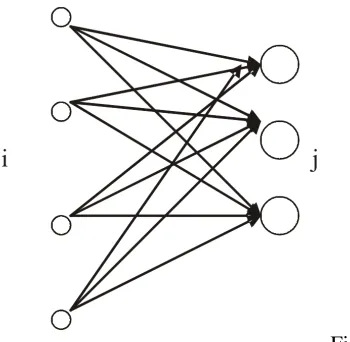
An example of self-organizing map or unsupervised learning algorithm, which solves the well known pattern classification problem, is shown in figure 3. A common self-organizing principle is to search for clusters in the input data distribution. The idea is to find the set of center locations wk, or cluster centers, that best describe the data set.
The network is fully connected with weights wij connecting neuron j in the output layer to neuron i in the input layer. The activation of neuron j in the output layer is given by
(1)
Here, wij = (w11, w1j, w21, wij) is the weight vector, xi = (x1, x2, …, xi) is the input feature vector and each component of w and x lies in 0 to 1 (i.e., normalized). The augmented weight vector wij is to be estimated based on the available training data. If ai = (a1, a2,
…., an) is the corresponding class label,
then Equation (1) becomes the model:
(2)
Solution to Equation (2) is possible by searching for clusters in the input data distribution.
Let x1, x2, …., xn be a set of n samples and w1, w2 are some labels representing low and high risk clusters. The goal is to use these training samples to determine the weights in Equation (2) such that
(3)
If the conditions in Equation (3) are met, the data set x1, x2, …, xn are called linearly
separable. We then find the set of centre locations wk, or cluster centres, that best
describe the data set. This is done by
minimizing e.g. the reconstruction error or Mean Squared Error (MSE):
(4) Subject to the constraint that k << N (k can be either fixed or adaptive). Here vk[x(n)] is a membership function that takes the values:
...(5) The MSE solution has the advantage of guaranteeing convergence. Gradient descent on Equation (4) leads to the updating equation.
...(6) Where 0 - is a small learning constant. It should be noted that from the identity: wk=wk+0(x–wk)=(1–0)wk+0x (7)
provides a certain separability safety margin. During training neurons whose weights change chaotically are discarded, since their output may not provide any essential clustering information. The weights of remaining neurons should settle at values that are indicative of clusters.
• Advantages and Disadvantages of ADCD
The major advantages of the proposed system over existing ones include:
(i) Automatic data collection
(ii) Real-time detection and localization of pipeline cut
(iii) Large data handling (iv) Parallel detection (v) Good visualization (v) Indigenous system design
On the other hand, some of the disadvantages are:
(i) Requirement of constant power supply at the centre
(ii) Requirement of human experts for 24 hours monitoring
(iii) Equipment failure
4.0 PERFORMANCE ANALYSIS
This section outlined the performance benchmark used for validating the model and compared the performance of ADCD with other oil leak detection models.
4.1 PERFORMANCE BENCHMARK
The proposed architecture relies on a piece of software for real- time detection of oil pipeline cut or leakages. The principles underlying detection software are grounded in classical statistical decision theory. There are two sources that generate inputs to the detection software: pipeline cut (H0) and no cut (H1). The goal of the detection software
is to classify each encroachment as cut or
no cut. Two types of errors can occur in this classification:
(i) Classification of a fraudulent encroachment as legal (false negative); and
(ii) Classification of a legal encroachment as fraudulent (false positive).
We define:
Probability of detection PD = Pr (classify into H1*H1 is true), or
Probability of false negative = 1– PD.
Probability of false positive PF = Pr
(classify into H1|H0 is true).
Let the numerical values for the no cut (n) and cut (c) encroachments follow exponential distributions with parameters lN and lC, lN > lC, respectively. Then we can
write the probability of detection PD and
probability of false positive PF as
(8)
(9) PD can be expressed as a function of PC as
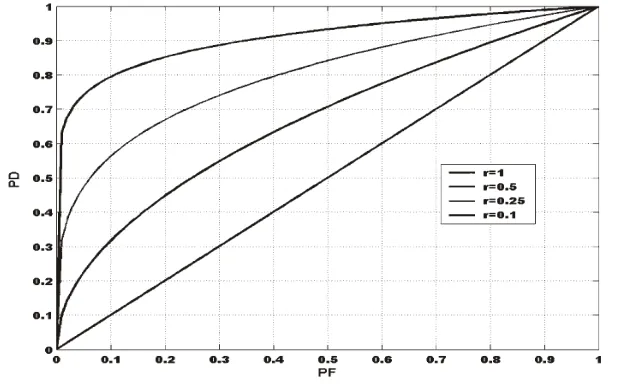
(10) Where r = lC /lN is between 0 and 1.
Consequently, the quality profile of most detection software is characterized by a curve that relates its PD and PC, known as
for various values of r. The smaller the value of r the steeper the ROC curve and
hence the better the performance.
Fig. 4 ROC curves for different r
4. 2 Comparison of ADCD with Two other oil Leak Detection Models
The ROC curve is also used for this comparison. As stated in section 3, if the degree of forces exacted at a cross-section of the pipeline exceeds a certain threshold value, leakage is said to occur. For the analysis, we simulated such degree of
Figure 5 Leak characteristics (Source: [10]) Two different available products such as
PIPENET [10] and ATMOS pipe [11, 12] were selected to test the feasibility of the proposed ADCD tool for this purpose. The performance analysis of the respective
detection algorithms was carried out using MATLAB software package [13] and the results compared with the proposed ADCD model as shown in Figure 6.
Fig 6 Comparison of ADCD with two other oil-leak detection systems
Explanations: From figure 6, the ROC curve for ADCD detects over 70% of pipeline cut cases without causing false alarms. This is followed by the ROC curve for PIPENET with 50% detection with no false alarms. The least is the ROC curve for ATMOS pipe with 35% detection. Figure 6, again shows that the performance of ADCD is in agreement with other detection software, but performs better. This relative advantage of ADCD over others is as a result of combining neural networks with crude flow rules. Using two software products enabled us to illustrate different
vendor user interfaces available, alternative approaches to neural networks models, design for decision making, and the performance metrics of different models. Comparison of performance of neural network model with other statistical methods increased our confidence in the ability of ADCD in successful modeling pipeline cuts.
5.0 Conclusion
oil in the Niger Delta region of the country and argued that the rising tide of violence, hostage taking in the Niger Delta impaired the use of known formal data collection procedures. As a way forward to provide prompt detection and response to oil spillage, we presented an architecture based on interrupt-driven, which provides communications of wireless sensor network with a satellite connected to a central office to automatically track instances of encroachments or pipeline cut. With the use of a neural network learning capability for preprocessing and pipeline operational rules, the proposed system is able to detect 70% of pipeline violation far above other leak detection systems.
References
[1] Daily Times (October, 2003). Nigeria ranked second most corrupt Nation. http:/www.dailytimesofnigeria.com/D ailyTimes/2003/October/8/Nigeriarank ed.asp/
[2] L . P . E yo - E s s i e n , “ O i l s p i l l management in Nigeria: challenges of pipeline vandalism in the Niger Delta region of Nigeria” unpublished.
[3] P. C. Nwilo, K. O. Peters, and O. T. Bodeji, “Sustainable Management of oil spill incidents along the Nigerian Coastal areas, 2000.” unpublished. [4] Niger Delta Environmental Survey
(NDES ), “Envi ronm ent al and Socioeconomic characteristics, 1997.” unpublished.
[5] B. Ojediran, and J. Ndibe, “Oil Spill Management: S P DC and t he Environment, 2005.” Unpublished. [6] B. A. Ajakaiye, “Welcome address
presented at the international workshop on review and update of the
National Oil Spill Contingency Plan, 2006.” unpublished.
[7] T. Horne, “Summary of Data G a t h e r i n g M e t h o d s , 1 9 9 5 . ” http://www. web .net / tamhorne / data.htm
[8] H. V. Trees, Detection, Estimation and Modulation Theory –Part I. John Wiley, New York, 2001.
[9] C. Huseyin, and R. Srinivasan, “Configuration of detection software: a comparison of decision and game theory approaches .” Decision Analysis, vol. 1, No. 3, 2004, pp131-148.
[10] I. Stoianov, L. Nachman, and S. Madden, “PIPENET: A wireless s e n s or net work for pi pel i n e monitoring, 2007.” http; //db.csail. mit.edu/pubs/ipsn278-nachman.pdf [11] W. Al-Rafai, and R. J. Barnes,
“Underlying the performance of real-time software-based pipeline leak-detection systems.” Pipe &Pipelines International, December, 1999. [12] J. Zhang, and L. Xu, “Real-time
pipeline leak detection on Shell’s North Western Ethylene Pipeline.” IMechE Conference Transactions 1999-8, [Ageing Pipelines, Optimizing the Management and Operation: Low Pressure-High Pressure.]
[13] MATLABR The MATLAB compiler
user’s guide. [In Mathworks Handbook; Math works.]