Vol.8 (2018) No. 4-2
ISSN: 2088-5334
Spatial Clustering based Meteorological Fields Construction
for Regional Vulnerability Assessment
Taemin Lee
#1, Woosung Choi
#2, Jongryuel Sohn
*3, Kyongwhan Moon
*4,
Sanghoon Byeon
*5, Wookyun Lee
%6, Soonyoung Jung
#7✉# Department of Computer Science and Engineering, College of Informatics, Korea University, Seoul 02841, Republic of Korea
E-mail: 1 taeminlee@korea.ac.kr, 2 ws_choi@korea.ac.kr, 7 jsy@korea.ac.kr
*
Department of Health and Environmental Science, College of Health Science, Korea University, Seoul 02841, Republic of Korea E-mail: 3 sohn1956@korea.ac.kr, 4 kwmoon@korea.ac.kr, 5 shbyeon@korea.ac.kr
%
Department of Environmental Science and Ecological Engineering, Korea University, Seoul 02841, Republic of Korea E-mail: 6 leewk@korea.ac.kr
Abstract— Chemical accidents have affected the social-environmental system. For the regional vulnerability assessment, which is the
baseline work to assess the impact on the environment, a meteorological field is needed to determine how chemicals from multiple adjacent companies are propagated. In this study, we present the method of meteorological field based on the spatial cluster which is the main component of vulnerability assessment on regional chemical accident scenario. To integrate spatially dense chemical companies into a cluster, we adopt spatial clustering algorithms. Experiment result shows that DBSCAN-based approach reduces 80.5% total area of the meteorological field against brute-force algorithm, and shows good performance on the average of the overlap ratio, and utility ratio for clustering results.
Keywords— spatial clustering; vulnerability assessment; meteorological field; DBSCAN.
I. INTRODUCTION
Chemicals are continuously increasing in usage in industries such as agriculture and manufacturing.[1] Chemical accidents have affected social-enviromnental system. For example, the 2015 Tianjin chemical explosion caused 173 deaths, 8 missing persons, 797 injured persons, and atmospheric and water pollution, all of which had a devastating effect on the surrounding environment. The overall direct and indirect losses were estimated at more than 31 million US dollars[2]. In addition, the frequency of accidents is increasing as the use of chemical compounds increases. In South Korea, the number of reported chemical accidents are increased from 6 in 2005 to 113 in 2015.[3] Due to these risks, a study on the high risk of chemical materials proceeded[4].
Vulnerability Assessment is a technology that numerically expresses the environmental and human impacts of chemical accident scenarios[5]. Depending on the scenarios in which the incident situation is assumed, vulnerability assessments of chemical companies can be conducted to determine the impact on the social-environmental system prior to the
accident. Pre-accident assessments can be used to license, manage and supervise chemical handling companies. Most vulnerability assessment studies have been based on statistical information, but some studies have limitations that do not take into account the spatial distribution of chemicals [6].
In order to determine the regional effects, the spatial analysis of chemical substances of various companies should be performed[7]-[10]. In other words, the impact on the environment should be analyzed synthetically from the influence of adjacent companies rather than one.
In the event of a chemical accident, chemicals are released to the atmosphere, so it is essential to construct a meteorological field, which is a model simulating atmospheric motion, for precise vulnerability analysis. This study suggests an efficient method of generating a meteorological field for determining the regional impacts.
II. MATERIAL AND METHOD
The construction of the meteorological fields is the first step of the vulnerability assessment. It is generated by simulating based on the meteorological observation information which collected from AWS(Automatic Weather Station) distributed through country and the DEM(Digital Elevation Model).
Fig. 1 example of a meteorological field
In order to simulate the vulnerability assessment in the case of an accident scenario of a specific chemical company, constructing meteorological fields for the period from the accident point to the end point is necessary. The construction of a meteorological field generates a large amount of data. For example, construction square meteorological field for one chemical company with a radius of 5km and 6-hour duration using 50m DEM and 1-minute interval, 114,400,000 weather cells should be generated.
Fig. 2 Nearest neighbor distance for chemical companies
For regional vulnerability assessment, a perimeter meteorological field is required for each company, which means an increase of the amount of data generated and the amount of computation. Using a brute-force method, have to
construct a separate meteorological field for each chemical company, but this is not efficient. An understanding of the underlying data is needed to do an effective regional vulnerability assessment.
Distribution of chemical companies does not follow uniform distribution. This is due to the national development plan, which creates industrial complexes and collects related companies by tying similar industrial groups in the process of industrialization. In other words, chemical companies can be regarded as a collection of clusters where a number of companies have a certain distance based on a cluster centroid.
A. Proposed Method
Our proposed method is automatically generating clusters of chemical companies based on data. Then construct a meteorological field for the cluster to minimize the cost of redundant operations. Pseudo code of the proposed method is shown in fig 1.
[Algorithm] Construct Meteorological Fields Input. C, Chemical Companies
Output. M, meteorological fields Method
begin
CS = SpatialClustering(C) numCS = |CS|
M = [numCS]
for i = 0 until numCS do
begin
cs= CS[i]
M[i] = ConstuctionMeteorologicalField(c)
end end
Fig. 3 pseudo code of spatial cluster based meteorological field constructing method
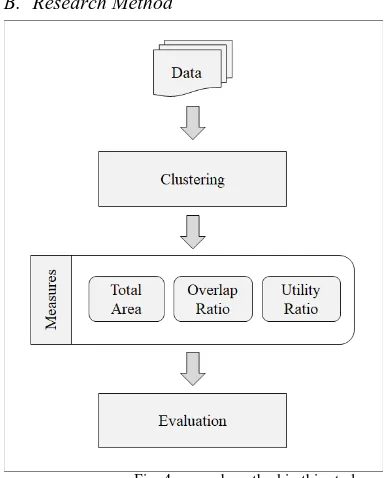
B. Research Method
Fig. 4 research method in this study
the clustering, which deals with the clustering using the geographical distribution of chemical companies for the creation of regional meteorological fields. The third phase is measuring with measurement tools for qualitatively evaluating the results of clustering. Finally, in the evaluation phase, the results obtained by clustering collected data are analyzed to verify the validity of this study.
C. Data
The dataset of this study is consists of 626 chemical companies around Seoul, South Korea from the list of chemicals handling companies of the Ministry of Environment. Data collection dates and times are 2015. The dataset includes the name of the company, handling chemical substance, location, etc. In this study, the location information was mainly used.
The location of each chemical company in the dataset is an address made up of natural language, so it should be coded into a point on a two-dimensional plane. In this study, hybrid geocoding [11] was applied. Hybrid geocoding is a method that corrects values after synthesizing various geocoding results, and has a feature of being more accurate than a single geocoding method. We use Google, Naver, Tmap, and vworld which are service providers providing geocoding in the South Korea. Nonetheless, the geocoding results are not 100% accurate, so they have been modified by experts to ensure that each chemical company is on the actual location. The location coordinate system is used to convert WGS84, which consists of latitude / longitude, into the EPSG3857 coordinate system conforming to the unit of meter.
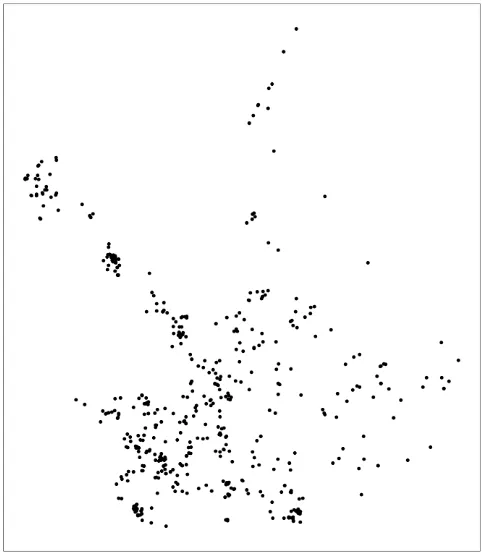
Fig. 5 distribution of chemical companies on the dataset
The distribution of the companies can be seen in the following [figure 3]. Each point in the picture is a different chemical company. In addition, we can intuitively see the chemical companies takes a non-uniform distribution.
D. Clustering
This study aims to create a common meteorological field for companies that can influence each other when performing a regional vulnerability assessment. The smaller the total size of the generated meteorological field, the lower the computation cost. However, if we only just aim to minimize the total size of the meteorological field, we will have a huge multi polygon that union all the metamorphic sites. This leads to another overcost in performing parallel processing of the distributed environment when performing the vulnerability evaluation after construction of the meteorological field. Therefore, we need a technique to divide a dataset into multiple subsets, and clustering is appropriate for this due to the non-uniform distribution of chemical companies.
Clustering is a method for generating subset of data based on the distribution of data. Clustering is the analysis of data itself without supervised by experts, which minimizes the intervention of the experts and has a cost advantage. Clustering can be divided into non-hierarchical clustering and hierarchical clustering [12]. In the case of hierarchical clustering, additional costs arise due to the additional efforts of the experts to divide into non-overlapping subsets, and expert intervention is required whenever the data set changes. In this study, we use two clustering method of non-hierarchical method. Clustering has its own significance, but it is also used as a pre-processing step when performing complex analyses such as predicting [13].
Firstly, we chose DBSCAN(Density-Based Spatial Clustering of Applications with Noise) algorithm[14] to cluster chemical companies. DBSCAN is suitable algorithm to group adjacent chemical plants into one cluster. Because DBSCAN cluster based on the density, the cluster size is adapted to the distribution of data. Three parameters
)
,
s
min_sample
,
(
ε
f
are required to run a DBSCAN. Firstly,ε
is maximum distance within a cluster. Secondly,s
min_sample
is lower bound on the number of entities in the cluster. Secondly,f
is distance computation function between entity pair. Since the shape of the target meteorological field is rectangle, We select L1-distance function forf
. If the spatial index is used, the cost ofclustering is
Ο
(
n
log
n
)
.E. Measures
We need measurements to perform a qualitative evaluation of clusters generated in the clustering phase of this study. In this study, clusters are evaluated based on three measures: total area (TA), overlap ratio (OR), and utility ratio (UR). The total area is the sum of the sizes of the meteorological fields created by the MBR(Minimum Bounding Rectangle) of each cluster. The smaller the total area of the meteorological fields, the smaller the cost of computation. The overlap ratio is a measure of how much the sub meteorological field of each company of the clusters overlaps with that of other companies. The higher the overlap ratio, the higher the efficiency of the meteorological field generated by each cluster. The utility ratio is the percentage of the meteorological field used in the actual operation in the MBR of the cluster. If the utility ratio is low, the area of the unused meteorological field will increase. The best clustering results are when the total area is low and the overlap ratio and utility ratio are high.
For total area (TA), let cluster i
cs
be a set of bufferedpoints,
mbr
i be a minimum bounding rectangle of ics
,x
mbr
mini andmbr
miniy
be the minimum values of thex
and
y
axes, andmbr
maxix
andmbr
maxiy
be the maximumvalues of the
x
andy
axes, then the value is calculated as follows:
−
−
=
CS i i i i iy
mbr
y
mbr
x
mbr
x
mbr
CS
TA
(
)
(
max min)
*
(
max min)
(1)For overlap ratio (OR), let
p
i be a buffered point in acluster
cs
and set of point paircs
combi is defined by setbuilder form as follows:
}
,
|
,
{
p
cs
p
cs
x
y
x
y
cs
combi=
x∈
y∈
≠
>
(2)area
be a function that takes the area of multipolygon, ∪ be a spartial union operation andintersecti
on
be a spatial intersection operation then the overlap area OA of a clustercs
is calculated using as follows:∪
combi CS i y xc
c
on
intersecti
area
cs
OA
(
)
=
(
(
,
))
(3)using OA, overlap ratio OR of a cluster
cs
is calculated as follows:
=
CS i CS i cs j i j i ip
area
cs
OA
CS
OR
(
)
(
(
))
/
(
(
∪
))
(4)Utility ratio UR is calculated as the ratio of the MBR of the cluster to the buffered points as follows:
=
CS i cs j i j iCS
TA
p
area
CS
UR
(
)
(
(
∪
))
/
(
)
(5)III.RESULT AND DISCUSSION
The experiment was conducted by a program written in the python language. Experiments were carried out on the construction of artificial regional meteorological fields for 626 chemical companies in Republic of Korea as described in Ⅱ. The size of the meteorological field for a company is
assumed to be 10km^2, extending 5km from East / West / South / North based on the center of the company.
In this section, the results of the proposed spatial cluster based method using DBSCAN and grid partitioning. In addition, we used the brute force method as the baseline method for comparing and evaluating the experimental results. For each experience, the total area (TA), overlap ratio (OR) and utility ratio (UR) were obtained.
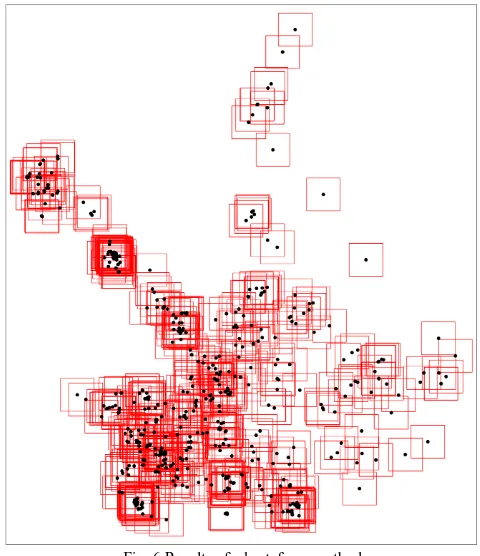
A. Result of Bruteforce Method
The bruteforce way to construct meteorological fields on region is to create a different meteorological field for each of the chemical company. A total of 626 meteorological fields are constructed as shown in figure 5. The bruteforce methodology has a total area of 62,600 km^2. Since no clusters are formed, the overlap ratio and the utility ratio can not be obtained.
Fig. 6 Results of a bruteforce method
B. Result of Proposed Method
TABLEI
PARAMETERS FOR SPATIAL CLUSTERING EXPERIMENT parameter values
ε 4000,5000,6000
s
min_sample 2,3,4
f L1 distance
The following table Ⅱ shows the total area (TA), overlap
ratio (OR), utility ratio (UR), and mean value of OR and UR
for the experiments.
TABLE II
RESULT OF THE TA,OR,UR FOR THE METHODOLOGIES method TA
( 2
km) OR UR 2
UR OR+
brute force 62,600 N/A N/A N/A
DS(4000,2) 14932.9 55.8% 89.9% 72.8%
DS(4000,3) 15900.9 45.0% 90.7% 67.8%
DS(4000,4) 17862.0 33.1% 92.9% 63.0%
DS(5000,2) 12267.6 64.1% 86.2% 75.1%
DS(5000,3) 12751.7 56.6% 86.8% 71.7%
DS(5000,4) 13766.5 46.0% 89.3% 67.7%
DS(6000,2) 12871.3 68.2% 74.8% 71.5%
DS(6000,3) 13298.0 60.5% 75.8% 68.2%
DS(6000,4) 14085.6 52.1% 77.2% 64.6%
GRID(2,2) 16252.3 78.2% 52.1% 65.2%
GRID(2,3) 17714.5 76.9% 50.8% 63.9%
GRID(2,4) 15965.4 76.8% 57.0% 66.9%
GRID(3,2) 14812.8 77.2% 58.1% 67.0% GRID(3,3) 16642.6 76.3% 54.9% 65.6%
GRID(3,4) 15149.7 74.9% 61.2% 68.1%
GRID(4,2) 14541.6 75.7% 62.1% 68.9%
GRID(4,3) 15995.5 74.4% 59.8% 67.1%
GRID(4,4) 14525.3 74.5% 66.5% 70.5%
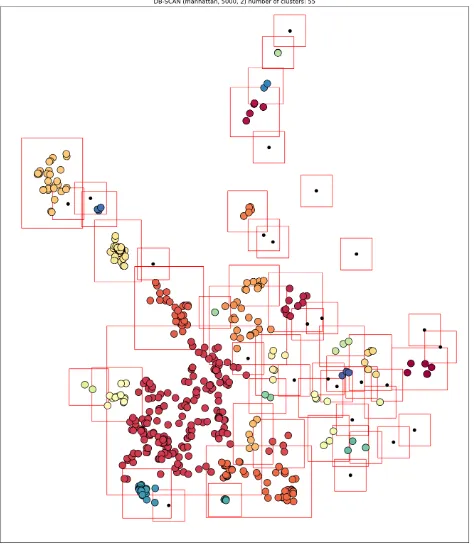
The method with the lowest total area was DBSCAN(5000, 2). Figure 7 shows the distribution of a clustering results of DBSCAN (5000,2). The small point in the figure is a nonclustered chemical company, and large points with the same color represent chemical companies within a cluster. The bounding box of the cluster represents a meteorological field with a 5 km buffer, each of which is
represented by a red solid box in the figure. The value of e is the equal to the size of the buffer of a meteorological field.
Interestingly for
e
, it shows the lowest TA at 5,000, which is the same as the size of the buffer of meteorological field. If the size of thee
is smaller than the size of the buffer, the chemical companies that affects each other may not be formed as a cluster. If the size of the $e$ is larger than the size of the buffer, a large cluster which has a high probability of overlap may be generated. Therefore, setting $e$ equal to the size of the buffer has caused a reduction in the total area. Amin_sample
s
of 2 means that the formation of clusters when at least two companies' weather stations influence each other. This means that when the formation conditions of the cluster are relaxed the total area is reduced.Fig. 7 Clustering result of DBSCAN(5000, 2)
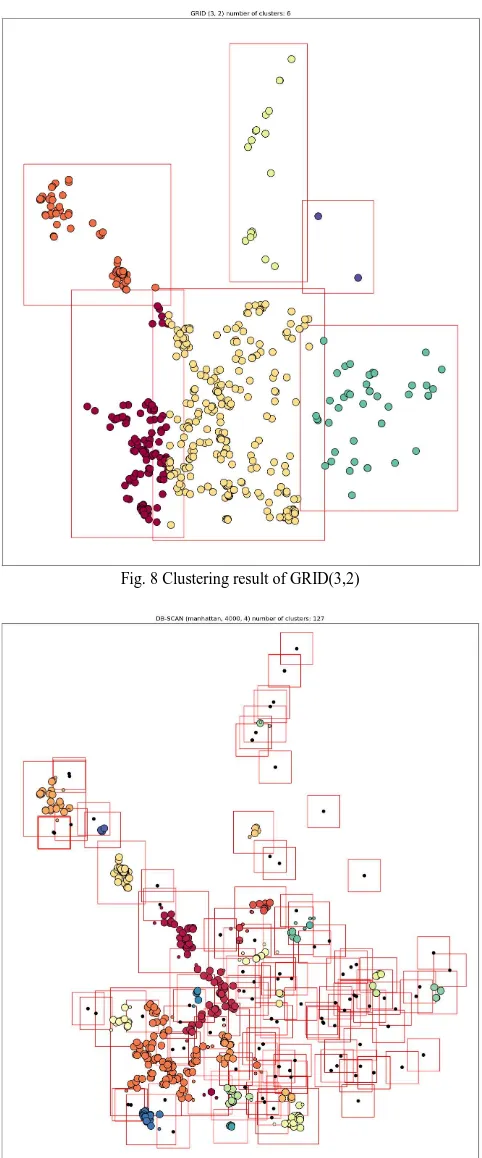
The overlap ratio showed the highest performance in GRID (3, 2). Figure 7 shows the clustering result of GRID (3,2), and clustering representation method is the same as Figure 6. The overlap ratio is higher as cluster densities are higher. This is because the data set of this experiment is divided into 2 * 3 grid, and chemical handling companies are distributed in some cells.
The utility ratio was the highest in DBSCAN (4000,4), and the result is shown in Fig. The utility ratio can be used as an indirect measure of the proportion of the meteorological field that is expected to be used, but it is more sensitive to the shape of the distribution than the density. It has the highest value when it is close to the square, and the lowest value when it is close to the diagonal distribution.
Fig. 8 Clustering result of GRID(3,2)
Fig. 9 Clustering result of DBSCAN(4000, 4)
IV.CONCLUSIONS
In this paper, we have studied constructing meteorological fields based on a spatial clustering for regional vulnerability assessment. In the experiments, DBSCAN-based methodology has a total area of only 19.5% compared to bruteforce methodology. The DBSCAN algorithm showed good performance on the average of the overlap ratio, and
utility ratio for clustering results. Through this study, it was possible to perform clustering for chemical handling companies that affect each other.
If a vulnerability assessment study is conducted using this, it will be possible to construct a scalable system using parallel processing of distributed environment becomes possible. In addition, since the cluster is composed of the minimum bounded rectangle (MBR), if the overload of the computation is additionally caused due to the excessive size of the meteorological field, the intensity of the computation may be reduced by partitioning the MBR.
ACKNOWLEDGMENT
This subject is supported by Korea Ministry of Environment(MOE) as "The Chemical Accident Prevention Technology Development Project." (Project No. 2015001950001)’ provided by Korea Ministry of Environment
REFERENCES
[1] J. Park, Domestic and international environmental restrict and plan for reaction against chemical industry, no. 44, 2011, pp. 2–3.. [2] Huang, P. & Zhang, J., 2015. Facts related to August 12, 2015
explosion accident in T ianjin, C hina. Process Safety Progress, 34(4), pp.313–314.
[3] Chemical Safety Clearing-house,
http://index.go.kr/smart/refer.do?stts_cd=408802&idx_cd=4088&per iod=Y&periodS=2005&periodE=2015
[4] J.C. Belke, Loss Prevention and Safety Promotion in the Process Industries, in: Proceeding of the 10th International Symposium, June 19–21, Stockholm, Sweden, pp. 1275–1314.
[5] Eakin, H. & Luers, A.L., 2006. Assessing the vulnerability of social-environmental systems. Annual review of environment and resources, 31.
[6] C. Zhang, O. Selinus, Spatial analysis for copper, lead, zinc contents in sediments of the Yangtze River basin, Sci. Total Environ. 204 (3) (1997) 251–262.
[7] Heo, S. et al., 2017. Chemical accident hazard assessment by spatial analysis of chemical factories and accident records in South Korea. International Journal of Disaster Risk Reduction.
[8] J. Lahr, L. Kooistra, Environmental risk mapping of pollutants: state of the art and communication aspects, Sci. Total Environ. 408 (2009) 3899–3907.
[9] M.C. Olmo, J.A.L. Espinar, V.R. Galiano, E.P. Iguzquilza, L.C. Rivas, Categorical indicator Kriging for assessing the risk of groundwater nitrate pollution: the case of Vega de Granada aquifer (SE Spain), Sci. Total Environ. 470–471 (2014) 229–239.
[10] Li, F. et al., 2010. Mapping human vulnerability to chemical accidents in the vicinity of chemical industry parks. Journal of hazardous materials, 179(1-3), pp.500–6.
[11] T.Lee et al, 2016, Improvement of position accuracy of geocoded coordination based on Ensemble method, 2016 KIPS spring conference proceeding. 23 (1), pp. 818-819
[12] Sammour, M. & Othman, Z., 2016. An Agglomerative Hierarchical Clustering with Various Distance Measurements for Ground Level Ozone Clustering in Putrajaya, Malaysia. International Journal on Advanced Science, Engineering and Information Technology, 6(6), pp.1127–1133.
[13] Shodiq, M.N. et al., 2018. Neural Network for Earthquake Prediction Based on Automatic Clustering in Indonesia. JOIV: International Journal on Informatics Visualization, 2(1), pp.37–43.