Optimization of Radial Distribution Networks
Using Path Search Algorithm
Vikrant Kumar, Ram Krishan
,
and Yog Raj Sood
National Institute of Technology, Hamirpur, IndiaEmail: {vikrantprajapati92, ramkrishan.nith, yrsood}@ gmail.com
Abstract—In planning of radial power distribution system, optimal feeder routing play an important role. This paper proposes a simple approach to optimize the total annual cost of the network, which represents investment cost (fixed cost) for feeder line as well as substation and operational costs (energy loss costs). The main objective of this method is to find the optimal route for each load point in large size electric power distribution system and to obtain the optimal radial network. An algorithm is proposed for simplified case study of a feeder network. The proposed algorithm is validated using MATLAB and the result thus obtained is compared with the existing results. The numerical results with different test cases are discussed, thus verifying the effectiveness of this approach.
Index Terms—Feeder routing, load flow analysis, path
search algorithm, radial distribution network
I. INTRODUCTION
In electrical distribution network, number of substations and load points are connected to each other via distribution feeders. The distribution system planning is to ensure that the growing load demand can be satisfied economically by electrical substation. Therefore main goal of the power distribution system planning is to find the optimal location and size of substation, after that determine the number of feeder line and their optimal routes. Distribution system planners must ensure that to obtain minimum cost of radial distribution network under the constraints of substation and feeder capacities [1]. The mathematical planning model proposed for optimal single-period horizon-year, which required for design or expansion of primary and secondary distribution systems [2]-[3]. The optimal planning of radial distribution system was conducting by various mathematical programming techniques, Dynamic programming and geographical information systems (GIS) facilities used for the optimal feeder routing problem [4]. The optimization of primary distribution system was conducted using ant colony system algorithm which minimized the investment and operation costs solution [5]. A new multi-objective Tabu search (NMTS) algorithm was proposed to solve multi-objective fuzzy model for optimal planning of distribution systems [6]. Simulated annealing (SA) technique was used to optimize the distribution feeder network [7]. Nahman and Peric [8] developed a combined method for optimal feeder routing
Manuscript received April 19, 2013; revised June 26, 2013
based on steepest decent and the simulated annealing (SA) technique. The steepest descent approach is used as the initial solution generation for the optimization that is further modified by simulated annealing to obtain the minimum total cost solution.
The advantage of the GA over other classical techniques discussed for feeder routing problem considering the data with multiple substations [9]. E. C. Yeh and S. S. Venkata [10] implemented the concept of Design by Expectation (DBE) to improving the planning of distribution network using genetic algorithm. S. Najafi and S. H. Hosseinian [11] described the planning regarding to optimal sizing and location of High-voltage and medium-voltage (HV and MV) substations as well as MV feeder routing using the genetic algorithm considering their fixed costs and variable costs. To obtaining better optimal solutions, nonlinearity of the cost function, real and integer variables, nonlinear constraints can easily be formulated while using GA optimization technique [12]. The load flow analysis for radial distribution system required to calculate energy losses in the feeder lines. The efficient power flow technique is proposed for solving radial distribution network by reducing data preparation using sequential numbering scheme [15]-[16].
This paper presents a new method for optimal distribution system planning by considering distribution feeder routing associated with their corresponding fixed and variable costs, using path search algorithm. The main advantage of the developed algorithm over previously published approaches is that it checks all possible radial paths to obtain best and global optimal solution instead of random selection of radial paths.
II. NETWORK COST FUNCTION
The major costs in electrical distribution network are investment cost of substations and feeder lines as well as energy losses cost (variable cost) [8]. The total annual cost of radial distribution network is expressed as
C = Cf + Cl (1)
Where,
Cfis annual fixed cost of connected feeder lines and substations.
Cl is annual energy losses cost of network.
as
1
n
f k
k
C
g
C
(2)Where,
Ckis the cost of branch k of the main feeder g is the yearly recovery rate of fixed cost nis total number of branches.
Costs of branches include cost of both the line and the corresponding substation.
The second component of network cost function is energy losses cost which is calculated by applying load flow technique in each radial path. This cost component of energy losses may be represented as
2
1
8670
n
l k k
k
C
c
I
r
(3)β = 0.15α + 0.85α2
Where,
c cost per unit of energy lost, β loss factor,
r
k branch resistance,Ik branch current at peak load, α load factor.
The total cost C should be minimized. The constraints to be satisfied:
1) Capacity constraint P ≤ U, U is the vector of capacity limit.
2) Conservation of power flow: IP=D
P is the vector of power flow
I is the node element incidence matrix D is the power demand at each node. 3) The flow in the network model is radial.
4) The voltage at demand nodes at any time should be within specified limits.
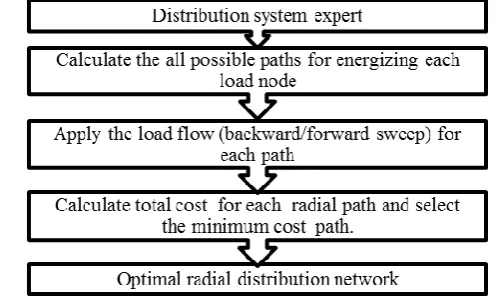
III. OPTIMIZATION PROCEDURE
Optimization technique to select the optimal radial connection or feeder lines for given distribution network (all possible connection between nodes) have basically two problems. First problem is to calculate all possible paths for each load nodes, starting from a substation node. There may be many possible radial paths to reach a load node. The proposed path search algorithm is used to calculate all possible paths for energizing each load node. The second problem is related to total cost calculation for each path and to select the optimum path for each nodes. Applying the forward/backward sweep algorithm load flow technique in each radial path to calculate the energy losses costs and adding the fixed investment cost of connected feeders and substation. The minimum cost path among all the radial paths for feeding a particular node will be the optimum path for the node. Step by step algorithm proposed for searching the optimal radial distribution network is shown below.
Figure 1. Proposed Methodology.
A. Path Search Algorithm
Manny algorithms like Dijkstra’s algorithm which is a single-source single-destination shortest path algorithm, Bellman-Ford algorithm used to solve single source shortest path algorithm with negative weights, a search algorithm solves single pair shortest path problems using heuristics, Floyd Warshall algorithm and Johnson’s algorithm find all-pairs shortest path [13]-[14]. These algorithms are used for finding the shortest path from a given node to all the other nodes in the network. Here, the criteria for the search, is the length between two nodes. But in the proposed algorithm, all possible radial paths for given nodes are used. Let us consider a ‘n’-node distribution network. The algorithm has following steps: 1) Initiate from the substation node (let node -1), check
the nodes which are directly connected to substation node and form a connection matrix P.
2) Check the last node’s connections of ‘P’ matrix and update matrix with new connections.
3) Updated node’s connections are entering in new rows of matrix ‘P’.
4) Repeat the second and third step for next iteration until last node having no remaining connection. So in this way all possible radial paths for energizing all nodes (2 to n-node) are obtained.
5) Now separate possible paths for respective energizing nodes (2 to n-node) i.e. create n-1 matrices P2, P3 …Pn-1. Row of matrices represents the path for energizing node.
B. Load Flow Analysis
For each load node the possible paths matrix represented by P2, P3……..Pn-1. To calculate the energy losses in each path of respective load node, the forward/backward sweep load flow technique is used.
Let V1, V2, V3,…….. and Vn = bus voltages I1, I2, I3,…...…..……and IP = line currents S1, S2, S3……...Sn = bus load
n = number of buses in the system p = number of lines in the system The steps of the algorithm are as follows:
V1=Vspec, where Vspec is the specified voltage at root node.
2) Initially k = 0, Set iteration count k = k + 1. 3) Calculate the nodal current injections
Ji (k)
= (Si/Vi (k-1)
)* for i=2 to n.
Starting from the end nodes and moving towards the root node calculate the branch currents.
Ij (k)
= Ji
(k) + ∑ currents in the branches
connected to node i for all j= 1 to p.
This is BACKWARD SWEEP Which is application of KCL ay each node.
4) Starting from the root node and travelling towards the end nodes calculate the node voltages.
Vi(k) = Vj(k) – ZjIj(k) for i = 2 to n.
Zj is the impedance of the line j connecting ith and jth node. This is FORWARD SWEEP and is application of KVL.
5) Calculate the maximum mismatch in the bus voltage
∆Vmax= max (abs (Vik –Vik-1)) for i = 2, n
If ∆Vmax ≤ ε, then the algorithm has converged and calculate line current and power losses.
If ∆Vmax > ε, then repeat the steps from 2 to 5.
This load flow technique also used for calculating the power losses of the final optimal radial network.
IV. SIMULATION RESULTS
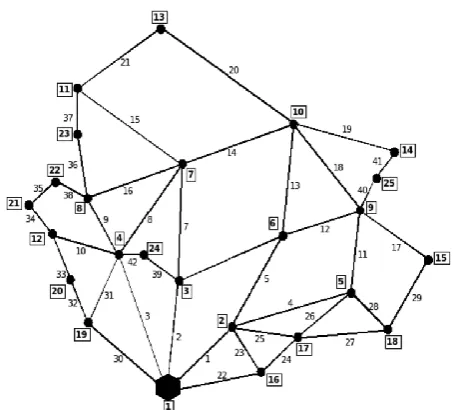
To verify the feasibility of the proposed technique, example reported in [8] for planning of radial distribution system is considered. The possible distribution network routes for a rural 10 kV network that should be planned are displayed in Figure 2.
The network has 24 load points (transformers 10 kV/0.4 kV) and 42 available route segments/branches for their supply from the source 35 kV/10.5 kV substation at node 1. The substation equipment and building capital cost per outgoing line is 75 k$. This amount is added to all branches directly connected to the source substation. Voltage drop limit at maximum load was taken to be 1000 V.
Five main feeder lines (1, 2, 3, 22, and 30) are connected from substation node (node-1). The optimal network can be obtained by proper selection of main feeder lines which are directly connected to the substation node. So in this way four optimal configurations are obtained and cost of final optimal network for each configuration are compared.
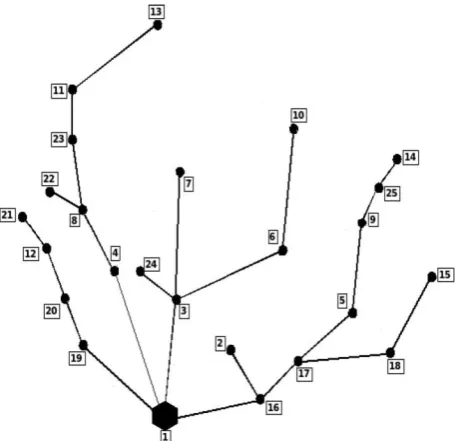
A. Test Case-I: All Five Main Feeders Are Considered.
For all possible connection of network (fig.2), path search algorithm is applied and in first step generates 82604 total possible radial paths for all energizing load nodes as shown in table I.
Figure 2. The possible distribution network’s routes for 24 load nodes.
TABLE I. OPTIMAL PATHS FOR NETWORK WITH ALL FIVE MAIN FEEDERS
Load Node to
be energized
Optimal path for energizing load node
Total possible paths for the
energized load node
2 3 4 5 6 7 8 9 10 11 12 13 14 15 16 17 18 19 20 21 22 23 24 25
1 – 2 1 – 3 1 – 4
1 – 16 – 17 – 5 1 – 3 – 6 1 – 3 –7 1 – 4 – 8 1 – 16 – 17 –5 –9 1 – 3 – 6 – 10 1 – 4 – 8 –23 – 11 1 – 19 – 20 – 12 1 – 4 – 8 – 23 – 11 – 13 1 – 16 – 17 – 5 – 9 – 25 – 14 1 – 16 – 17 – 18 – 15 1 – 16
1 – 16 – 17 1 – 16 – 17 – 18 1 – 19
1 – 19 – 20 1 – 19 – 20 – 12 – 21 1 – 4 – 8 – 22 1 – 4 – 8 – 23 1 – 3 – 24
1 – 16 – 17 – 5 – 9 – 25
3688 2934 2819 3338 2894 2171 2910 1689 1414 2742 4462 3042 2568 3950 5122 3826 3693 4970 5103 4594 4594 3533 3980 2568
And optimal network with all main feeder lines as shown in fig.3.
TABLE II. ANNUAL COST IN US$ FOR OPTIMAL NETWORK WITH ALL FIVE FEEDERS
Fixed cost Energy losses cost Total cost
40237.5 8603.668 48841.17
Table-II shows the total cost of the system cost component for the optimal route obtained by the proposed algorithm.
Figure 3. Optimal networks with all five main feeder lines.
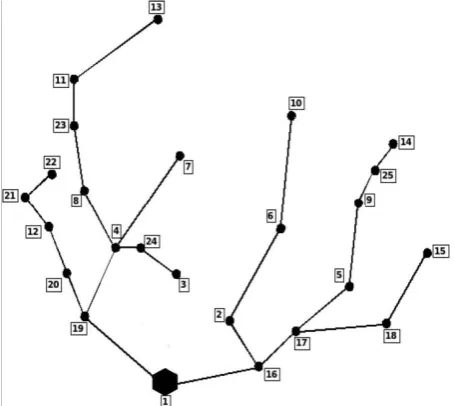
B. Test Case-II: Four main feeders are considered.
With four main feeder lines (2, 3, 22 and 30 in fig.2) configuration, 65085 total possible radial paths for all energizing load nodes. And finally select optimal path for each load as shown in fig. 4.
Figure 4. Optimal networks with four main feeder lines.
The annual energy loss cost is calculated by applying the load flow in the optimal network. And total annual
cost is summation of fixed yearly recovery cost and energy loss cost as shown in Table-III.
TABLE III. ANNUAL COST IN US$ FOR OPTIMAL NETWORK WITH FOUR FEEDERS
Fixed cost Energy losses cost Total cost
35700 9826.2 45526.2
C. Test Case-III: Three main feeders are considered. With three main feeder lines (3, 22 and 30 in fig.2) configuration, 53936 total possible radial paths for all energizing load nodes and optimum network with three main feeders as shown in fig.5.
Figure 5. Optimal networks with three main feeder lines.
The total annual cost is summation of fixed yearly recovery cost and energy loss cost as shown in Table-IV.
TABLE IV. ANNUAL COST IN US$ FOR OPTIMAL NETWORK WITH THREE FEEDERS
Fixed cost Energy losses
cost Total cost
30825 12709.56 43534.56
D. Test Case-IV: Two main feeders are considered. With two optimum initial feeders (22 and 30 in fig.2) network, calculated total possible radial paths are 43609 and final optimal network with two main feeder lines as shown in fig. 6.
feeder line i.e. second component of cost function also increases and annual investment cost of network decreases.
Hence, it depicts that the network structure with five main feeder lines is better than other three configurations in terms of energy losses cost and the network structure with two main feeder lines is better than other three configurations in terms of total planning cost.
The optimization technique based on Simulated Annealing generates optimal solution around current point by bringing a randomly selected branch [8]. In Ant colony and GA based method, tuning of several critical parameters affects convergence. The minimum parameters required to tune are five and seven in GA and Ant Colony respectively [12], [13]. The proposed path search algorithm does not require any tuning of parameters to obtain optimal solution. Moreover, while making the decision regarding the optimal path, all possible radial paths has been checked to find the path that ensures the best or global optimum path for any load node.
The proposed algorithm was performed using MATLAB 2010a code and computer: Intel(R) Core i3, 2.30GHz, 4 GB RAM which takes only 3 minute to execute the MATLAB programming.
Simulation result listed in the table V and fig. 6. Illustrates the best results (optimal path by mean of minimum loss) in comparison of result of simulated annealing technique [8] for the same data given in appendix.
Figure 6. Optimal networks with two main feeder lines.
TABLE V. ANNUAL COST IN US$ FOR OPTIMAL NETWORK WITH TWO FEEDERS
Fixed cost Energy losses cost Total cost
26062.5 15663.36 41725.86
V. CONCLUSION
A new technique based on path search algorithm has been presented for finding the radial paths in electrical distribution system and to minimize the total annual cost, which includes the capital recovery and energy loss costs. The proposed algorithm is proven to be effective for finding the minimum cost route from the substation to the demand side. The computational efficiency and speed of Backward and Forward load flow in distribution system is relatively good as compared to the classical methods based on the special features of networks such as radial structure and high R/X ratio. From results on 25 nodes test system, it is concluded that the proposed algorithm is effective for obtaining the optimal feeder route without being influenced by initial paths and different parameters as considered in other classical techniques for tuning.
APPENDIX
(Referred to Ref. [8])
TABLE VI. LENGTH OF GRAPH BRANCHES
Branch no.
Length in km 1
2.10 2
1.65 3
2.20 4
2.00 5
1.50 6
1.75
Branch no.
Length in km 7
1.75 8
1.75 9
1.00 10
1.00 11
1.25 12
1.50
Branch no.
Length in km 13
1.75 14
2.00 15
2.00 16
1.75 17
1.25 18
1.75
Branch no.
Length in km 19
1.75 20
2.25 21
1.75 22
1.50 23
1.05 24
0.75
Branch no.
Length in km 25
1.05 26
1.00 27
1.50 28
0.75 29
1.25 30
1.55
Branch no.
Length in km 31
1.00 32
0.75 33
0.75 34
0.50 35
0.50 36
1.05
Branch no.
Length in km 37
0.50 38
0.65 39
0.75 40
0.45 41
0.50 42
0.40
TABLE VII. COMPLEMENTARY LINE DATA
Branches no. Conductors mm2/ mm2
Loading capacity, A
Impedan ce Ω/km 1, 2, 3, 22, 30 25/4 90 1.2+j0.4
TABLE VIII. COST AND COMPLEMENTARY LOAD DATA
Power factor
Load factor
C US$/kWh
Ck
US$/km g
0.9 0.6 0.1 15 0.05
TABLE IX. CONSUMPTION AT LOAD POINTS
Load point No.
Load, KVA 2
250 3
160 4
100 5
100 6
50 7
100
Load point No.
Load, KVA 8
100 9
250 10
160 11
100 12
160 13
100
Load point No.
Load, KVA 14
100 15
100 16
150 17
80 18
40 19
100
Load point No.
Load, KVA 20
40 21
60 22
40 23
80 24
100 25
30
REFERENCES
[1] S. K. Khator and L. C. Leung, “Power distribution planning: A review of models and issues,” IEEE Transaction on Power System, vol. 12, no. 3, pp. 1151–1159, Aug. 1997.
[2] R. H. Fletcher and K. Strunz, “Optimal distribution system horizon Planning —Part I: Formulation,” IEEE Transaction on
Power System, vol. 22, no.2, pp. 791–799, May 2007.
[3] R. H. Fletcher and K. Strunz, “Optimal distribution system horizon Planning —Part II: Application,” IEEE Transaction on
Power System, vol. 22, no.2, pp. 862–870, May 2007.
[4] N. G. Boulaxis and M. P. Papadopoulos, “Optimal feeder routing in distribution system planning using dynamic programming technique and GIS facilities,” IEEE Trans. Power Del., vol. 17, no. 1, pp. 242–247, Jan. 2002.
[5] J. F. Gómez, H. M. Khodar, P. M. De Oliveria, L. Ocque, J. M. Yusta, R. Villasana, and A. J. Urdaneta, “Ant colony system algorithm for the planning of primary distribution circuits,” IEEE
Trans. Power Syst., vol. 19, no. 2, pp. 996–1004, May 2004.
[6] J. Rami´rez and J. Domi´nguez, “New multiobjective tabu search algorithm for fuzzy optimal planning of power distribution systems,” IEEE Trans. Power System, vol. 21, no. 1, pp. 224–233, 2006.
[7] V. Parada, J. A. Ferland, M. Arias, and K. Daniels, “Optimization of electrical distribution feeders using simulated annealing,” IEEE
transactions on power delivery, vol. 19, no. 3, pp. 1135-1141,
2004
[8] J. M. Nahman and D. M. Peric., “Optimal planning of radial distribution networks by simulated annealing technique,” IEEE
Trans. Power Syst., vol. 23, no.2, pp. 790–795, 2008
[9] V. Muanda, J. V. Ranito, and L. M. Pmenqt, “Genetic algorithms in optimal multistage distribution network planning,” IEEE
Transactions on Power Systems, vol. 9, no. 4, pp. 1927-1933, Nov.
1994.
[10] E. C. Yeh and S. S. Venkata, “Improved distribution system planning using computational evolution,” IEEE Transactions on
Power Systems, vol. 11, no. 2, , pp. 668-674, May 1996.
[11] S. Najafi, S. H. Hosseinian, M. Abedi, A. Vahidnia, and S. Abachezadeh, “A framework for optimal planning in largedistribution networks,” IEEE Trans. Power Syst., vol. 24, no.2, pp. 1019–1028, 2009.
[12] I. J. Ramirez-Rosado and J. L. Bernal-Agustin, “Genetic algorithms applied to the design of large power distribution systems,” IEEE Trans. Power Syst., vol. 13, no. 2, pp. 696–703, May 1998.
[13] Y. K. Wong et al., “Effective algorithm for designing power distribution network,” Microprocessor and Micro systems 20,1996, pp. 251-258.
[14] T. D. Sudhakar, NS. Vadivoo, S. M. R. Slochanal, and S. Ravichandran, “Supply Restoration In Distribution Network Using Dijkstra’s Algorithm,” 2004 lnternational Conference on Power System Technology - POWERCON 2004.
[15] K. Prasad, N. C. Sahoo, A. Chaturvedi, and R. Ranjan, “A Simple Approach for Branch Current Computation in Load Flow Analysis of Radial Distribution Systems,” International Journal of
Electrical Engineering Education, vol. 44 Issue 1, pp. 49-63, Jan.
2007.
[16] S. Ghosh and K. S. Sherpa, “An Efficient Method for Load−Flow Solution of Radial Distribution Networks,” World Academy of Science, Engineering and Technology 21 2008.
Vikrant Kumar received the B.Tech. degree in
Electrical and Electronic Engineering from College of Engineering Roorkee, Utttarakhand, India, in 2010. He is currently pursuing the M.Tech. degree in Power System at National Institute of Technology (NIT) Hamirpur, Himachal Pradesh, India.His research interests are planning and economics of distribution system and load flow analysis in power system.
Ram Krishan received his B.Tech Degree in
Electrical & Electronics Engineering from U.P. Technical University Lucknow, India in 2010. Currently he is pursuing M.tech in Power System from National institute of technology (NIT) Hamirpur and likely to complete in July 2013. He has worked as lecturer in Electrical Engineering d ep a rtment of Babu Bana rsi Da s Group of I n s t i t u t i o n , Lu c k n o w , U . P . I n d i a f r o m 2 0 1 0 t o 2 0 1 1 . His research interests in Renewable Energy Sources and Power System.
Yog Raj Sood (Sr., Member, IEEE) received his