2013; 1(1) : 1-18
Published online May 2, 2013 (http://www.sciencepublishinggroup.com/j/jfa) doi: 10.11648/j.jfa.20130101.11
Hedge accounting and impact on financial market
Doan Van Dinh
****,1, Guangming Gong
21Economics And Business, Hunan University, Hunan University and Faculty of Finance & Banking, Ho Chi Minh City University of
Industry, Vietnam
2Business School Hunan University, Changsha, Hunan, China
Email address:
citydinhninh@yahoo.com (D. Van Dinh)
To cite this article
Doan Van Dinh , Guangming Gong.Hedge Accounting and Impact on the Financial Market . Journal of Finance and Accounting .Vol. 1, No. 1, 2013, pp. 1-18. doi: 10.11648/j.jfa.20130101.11
Abstract:
As published by the Vietnamese Chamber of Commerce and Industry (VCCI) and the World Bank (WB), in 2011 Vietnam had 622,977 entities in which 79,014 entities were bankrupted. This problem is concerned with financial risks or not and why?. Thus, the article reviews the use of derivative financial instruments for financial hedge and their ef-fects to minimize the financial risks of the entities and bankrupt entities as well as their impacts on financial markets through decisions of investors and managers because their decisions are based on analysis results of financial statements. A country's accounting policy has not applied the derivative financial instruments for financial hedging, leading to affect that country’s economy or not? Especially, the financial markets of Vietnam or countries with similar economies have not also applied the hedge accounting to their hedge activities. The article uses the accounting theories of international accounting standards and Generally Accepted Accounting Principles in the United States and applies the methods of data analysis in the financial statements to show the results of hedge accounting that are concerned with bankruptcy, financial risks and economy decline.Keywords:
Fair Value; Derivative Financial Instruments, HedgeAccounting, Vietnamese Financial Market1. Introduction
1.1. Background
Hedging activities are necessary for the entities and in-vestors. Even though the entities and investors don’t expect the risks, the risks are still always present in all investment decisions or transactions of the entities, investors, and these risks can transform their dreams from "sweet dreams " to " bitter consequence”. Depending on the risk level can cause financial losses, or it makes the entities in the ex-hausted financial state and even bankrupt. Therefore, the entities or investors need to consider hedging activities in order to minimize the damage caused by the risks for the entities and investors. Many financial institutions and enti-ties have used the derivative financial instruments to hedge exposure to different risks (e.g. Interest rate risk, foreign exchange risk, commodity risk, etc.…).
The great usefulness from hedge accounting is use of the derivative instruments. So, the Financial Accounting Stan-dards Board (FASB) formally considered the derivative instruments accounting for hedging activities at the confe-rence in 1986 and issued indispensable financial
account-ing and reportaccount-ing standards in relation to financial instru-ments. From 1990 to 1998, the FASB issued and amended the accounting standards as follows:
Statement No. 105 “Disclosure of Information about Fi-nancial Instruments with Off - Balance - Sheet Risk and Financial Instruments with Concentrations of Credit Risk” (Issued in March 1990).
Statement No. 107 “Disclosure about Fair Value of Fi-nancial Instruments” (issued in December 1991) for re-placement of Statement No. 105.
Statement No. 115 “Accounting for Certain Investments in Debt and Equity Securities” (issued in 1993).
Statement No. 119 “Disclosure about Derivative Finan-cial Instruments and Fair Value of FinanFinan-cial Instruments” (issued in October 1994) for replacement of Statement No. 133.
Ac-counting Standards (FAS) No. 149 and amended Statement No.133 on Derivative Instruments and Hedging Activities (issued in April 2003). The FAS No. 149 applied account-ing and reportaccount-ing for derivative financial instruments more clearly including: Certain derivative instruments embedded in other contracts (collectively referred to as derivatives) and hedging activities under FAS Statement No. 133 “Ac-counting for Derivative Instruments and Hedging Activi-ties”. The FASB issued FAS No. 138 “Accounting for Cer-tain Derivative Instruments and CerCer-tain Hedging Activities in June 2000. The essential contents of standards were concerned with the derivative instruments accounting of foreign currency. In 2009, with a complete effort of the FASB, they issued Accounting Standards Codification (ASC), after that all former derivative instruments account-ing standards and hedgaccount-ing activities were recognized on ASC 815 “derivatives and hedging". The hedge accounting has been applied to the U.S. economy for a long time, and it has minimized their financial risks, at the same time, it has played an important role in promoting the economic development and the entities has applied hedge accounting to successfully prevent the financial risks.
Besides, the International Accounting Standards Board (IASB) has also studied and promulgated the international accounting standards in relation to hedge accounting such as: International Accounting Standard (IAS) IAS 32 “Fi-nancial Instruments: Disclosure and Presentation” in 1995, After a further period of effort, IAS 39 “Financial Instru-ments: Recognition and Measurement” was issued in 1999 to deal with the matters not covered in IAS 32. In 2008, IAS 39 was amended for 1Annual Improvements to the International Financial Reporting Standards (IFRSs, 2007). In 2009, IAS 39 was amended for Annual Improvements to IFRSs 2009, Classification and measurement Provisions of IAS 39 was replaced by IFRS 9 “financial instruments” that has been effective on 1 January 2013 (a new financial instruments standard) and with earlier application permit-ted by the IASB to aim at helping countries be able to ap-ply financial instruments accounting standards to their economy. However, the application of international ac-counting standards to the economy of each country faces many difficulties. Because each country has a particular economy and the accounting policy is closely connected to its political system. In addition, the language difference leads to their limited understanding about the contents and methods of the international accounting standards. This problem is the biggest obstacle for the entities to apply the global common uniform accounting system.
Currently, although Vietnam hasn’t issued the financial instruments accounting standards yet, in November 6, 2009 the Vietnamese Ministry of Finance issued Circular No. 210/2009/CMOF to guide the application of international
1(Each year the Board considers minor amendments to IFRSs in an
annual improvements project. The amendments are proposed in an omnibus Exposure Draft)
accounting standards (financial statement presentation and financial instruments disclosure) and this Circular are ap-plicable to all entities’ financial business fields. These in-ternational accounting standards include IAS 32 Financial Instruments: Presentation; IAS 39 Financial Instruments: Recognition and Measurement; International Financial Reporting Standards (IFRS 7) Financial Instruments. How-ever, the drafted guideline contents are also unclear and irrelevance, leading to the entities’ the practical application of this circular face many difficulties.
1.2. Literature Review
deriva-tive accounting rules on corporate risk management beha-vior” written by Haiwen Zhang (journal of Accounting and Economics 47 (2009) 244–264) showed that the effect of derivative instruments accounting standards (SFAS No133) was applied to the entity's risk management. This author analyzed the behavior of managers when they applied de-rivative instruments to prevent the financial risks and found out the volatility of cash flows and risk exposures in connection with interest rate, foreign exchange rate and significant decrease of commodity price. The author used multiple regression model to analyze impact factors that were interest rate, foreign exchange rate and commodity price.
The same purpose with the above authors’ research, the following authors also had similar researches such as: “The crisis of fair value accounting: Making sense of the recent debate” written by Christian Laux and Christian Leuz (Ac-counting, Organizations and Society 34 (2009) 826–834); “Fair Value Accounting And The Management of The Firm” of Benzion Barlev And Joshuarene Haddad (Critical Pers-pectives on Accounting (2003) 14, 383–415); “Derivative financial instruments used in Australia” of a group of au-thors including Henk Berkman, Michael E. Bradbury, Phil Hancock and Clare Innes, or “ Using and Accounting for Derivatives: An International Concern” of Coauthor Lil E. Crawford, Arlette C. Wilson and Barry J. Bryan (Journal of International Accounting, Auditing & Taxation, 6 (l): 111-121).
Through the assessment of the above author’s researches showing that all authors based on hedge accounting theo-ries under the FASB or the IASB to apply to hedge activi-ties and used analytical methods to analyze factors impact-ing on the entity’s financial risks. In addition, the authors had a common opinion on the use of derivative financial instruments for hedging activities. Otherwise, the authors tended to use a purely theoretical method or analysis me-thod of the impact factors on the financial market and risk management (interest rate, foreign exchange rate and commodity price, etc.) of the multiple regression model or other mathematics methods to solve related financial issues. The authors did not use an analysis method of financial indicators while almost managers or investors well unders-tood this method. In fact, the authors’ methods were com-plex and difficult for the investors or managers to under-stand and apply it.
From limitations above, the article applies derivative in-struments accounting under the FASB to apply to specific economic events. At the same time, it adjusts the interest rate, foreign exchange rate, and commodity price accord-ing to prices of derivative instruments (Forward Contracts, Swap Contracts, Future Contracts and Option Contracts) to make financial statements. Also base on specific economic events, the article applies derivative instruments account-ing and make financial statements. After that, it uses finan-cial analysis method to analyze different results of two methods and finds out the factors that can affect strategic decisions of the investors or managers.
2. The Hedge Accounting and
Derivative Instruments
2.1. Hedge Accounting
The derivative financial hedge accounting is essential for development of the financial markets and risk minimiz-ing for the entity’s transactions. This hedge accountminimiz-ing is applied to the financial assets and financial liabilities and brings a high hedge effect to the economy. A derivative is a hedge instrument applying to hedge forecast transactions that occur. The derivative instruments include future tracts, swap contracts, option contracts and forward con-tracts. In addition, the hedge accounting is the use of ap-propriate accounting methods under the international ac-counting standards (IAS) or Statement of Financial Ac-counting Standards (SFAS) 133, the entities can apply these methods to prevent the financial risks from transac-tions which occur. The derivative instruments are basic price, or are rated to the measurement unit, a defined amount and payment terms. Accounting's quality depends on all derivative instruments measurements at fair value. The firms’ aims is the use of hedge accounting to minimize the risk of investment and business. The hedge accounting under the ASC 815 are classified into three categories as follows:
Hedged fair value: hedged items are existing assets or liabilities and unrecognized firm commitments related to the purchase and sale in order to minimize risks for changes in fair value of a recognized asset or liability. These items are hedged and the derivative instruments are evaluated at the fair value on the last day of the quarter or financial statements year. Loss or profit from these items is immediately recognized in income.
1). Hedged cash flow: The exposure hedge instruments deal with variable expected value of cash flows in future connected to the risks. This loss may be related to recogni-tion of the assets or liabilities (as an exchange rate hedge) or foreseen transactions (purchase and sale) to minimize the risks of unpredictable variability of the cash flow in future. The derivative instruments are evaluated at the market price at the end of the year and are recognized as an asset or a liability. This gain or loss can be recognized in other comprehensive income in connection with deferring until the transaction affects income. The accumulated prof-it or accumulated loss of other comprehensive income is recognized in equity on the balance sheet.
2). Hedge of a net investment of subsidiaries in a foreign operation:
This gain or loss can be recognized in profit or loss, but it is consistent with the recognition of gain and loss on the asset or liability as a reclassification adjustment. For result in the recognition of a nonfinancial asset or a nonfinancial liability, the entities can apply a basis adjustment or retain the hedging gain or loss in equity. The entities can also reclassify it from the equity and recognize in profit or loss when the asset or liability affects profit or loss as a reclas-sification adjustment. This hedge accounting definition under IAS 39 is also classified into three categories as fol-lows:
3). Fair value hedge: a hedge of the exposure to changes in fair value of a recognized asset or liability or an unre-cognized firm commitment, or an identified portion of such an asset, liability or firm commitment that are attributable to a particular risk and could affect profit or loss.
4). Cash flow hedge: a hedge of the exposure to variabil-ity in cash flows that is attributable to a particular risk as-sociated with a recognized asset or liability (such as all of or some future interest payments on variable rate debt) or a highly probable forecast transaction and could affect profit or loss.
5). Hedge of a net investment in a foreign operation: Foreign operation is an entity that is a subsidiary, associa-tion, joint venture or branch of a reporting entity, the ac-tivities of which are based on or conducted in a country or currency other than those of the reporting entity (defined in IAS 21).
Generally, almost these hedged items based on the un-derlying principles of the IASB and FASB are equivalent converging. The IASB and FASB have the same opinion about the application of derivative instruments for hedging activities.
2.2. Derivative Instruments
Currently, almost entities apply the derivative instru-ments to hedge accounting including forward contracts, swap contracts, option contracts and future contracts.
2.2.1. For Forward Contracts
The forward contracts apply to big amounts of goods transactions (common goods, financial assets, exchange rates, etc.) and are determined at a time in the future at a fixed price that is agreed under regulation at the time of contract signing. From date of contract signing to the date of contract maturity is called as contract period and the contract’s payment date is called as the date of maturity.
For the entities that trade foreign currency or imported goods and pay foreign currency, formula of forward rate is as follows:
• F - The forward rate
•
r
d- The interest rate of the valued currency, i.e. Viet-nam Dong (VND) rates•
r
y- The interest rate of the basic currency, i.e. UnitedStates Dollar (USD) rates
• S- The current rates, S = USD / VND
(1) Formula ) 1 ( ) 1 ( y d r r s F + + × =
The formula (1) is assessed as follows:
First case: if the interest rate of evaluating currency is greater than the interest rate of the quoted currency:
(
)
( )
F
s
r
r
r
r
r
r
y d y d yd
≻
≻
+
≻
⇒
≻
+
⇒
+
+
⇒
1
1
1
1
1
.It is called as an increase in the forward rate point. Second case: if the interest rate of evaluating currency is less than the interest rate of the quoted currency:
(
)
( )
F
s
r
r
r
r
r
r
y d y d yd
≺
≺
+
≺
⇒
≺
+
⇒
+
+
⇒
1
1
1
1
1
.It is called as deduction of forward rates point.
Combining two cases above we see that the forward rate can be summarized as follows: F equal to S plus forward point, in which the forward point can be positive or nega-tive and is determined based on the current price ratio and interest rate differences between evaluated currencies and quoted prices. Assuming that the fiscal year is 360 days and the interest rate is percentage per year.
+ Forward rate of purchase:
( ) (2) Formula 360 100 ) ( ) ( × Ν × − × +
=s s LgtVND LcvNT
FP P p
+ Forward rate of sale:
(
)
Formula(3)360 100 ) ( ) ( × Ν × − × +
=s s LcvVND Lgt NT
F s
s s
In which:
P
F is forward rate of purchase and
s
P is the current rate of purchase,s
F is forward rate of sale and
s
sis the current rate of sale.) (VND
Lgt is interest rate of deposits and Lcv(VND)is lending interest rate in Vietnam Dong (VND).
) (NT
Lgt is interest rate of deposits and Lcv(NT)is lend-ing interest rate in foreign currency.
N is the number of days of the forward contracts.
2.2.2. Swap Contracts
Swaps are foreign exchange transactions that simulta-neously include both transactions: purchase and sale of the same amount of currency among different countries, in which the maturity of two different transactions and rates of two transactions are determined at the time of the con-tract signing.
+ Purchase and sale are signed on the same day of the contract signing date (trading days) in the same contract and with the same partner (or vice versa).
+ The amount of purchase and sale of currency is equal for both sides (purchase and sale) of swap contracts.
Purchase value and sale value is on the same date.
2.2.3. Option Contracts
Call option contracts: an agreement allows a buyer hav-ing a call option to buy a seller’s property at a fixed price on maturity of the contract.
Put option contracts: an agreement allows a seller having put option to sell his property to a buyer at fixed price on the maturity of the contract. This contract characteristic is not binding on call and put option, but a buyer of a call option or a seller of a put option has to pay transaction fees before or on the contract maturity.
2.2.4. The Future Contracts
Future contract is a standardized contract and goods transactions on the central exchange (broker) that the part-ners can participate to buy or sell a certain commodity (normal commodity or financial assets) at a fixed price and at a fixed date in the future. This date is called as the deli-very date (the last day). Price is determined at the date of contract signing and is called as the future price while the price of the goods on delivery is called as settlement price. Generally, the more gradually to the delivery date, the set-tlement price will converge towards the future price. The future contracts have difference with forward contracts as follows:
Future contracts: purchase and sale are agreed by bro-kers, partners are randomly determined at the central ex-change. These contracts are a direct agreement between the two parties to the contract, and the parties define their partners.
Future contracts are traded on the central exchange. The forward contracts are contrary.
Future contracts are calculated daily at market prices (marking to market). The forward contracts are paid at ma-turity.
Future contracts on the goods central exchange and the stock central exchange are defined as follows:
Future prices are determined on the basis of establishing the relationship between the future price and the spot price. Assuming that a firm will join in the future contracts in goods central exchange.
Loan is
S
0 with interest (r
f); using this money to buybasis asset;
0
F
is the future price (i.e. at maturity, we must sell the basis asset atF
0, but at this time there is no exchange of currency or asset). During the time from now to the maturi-ty of future contract, the basis asset makes a profit which is called as D (e.g. the basis asset is stock, stock dividend D is paid). Value of basis assets based on the market price isT
S
.Table 1 Marking to market
Date Daily variable price
First period of cash flow
Last period of cash flow (formula)
Loan (
S
0)S
0 -S
0Multiply (1 plusr
f )Market price is
s
0 -S
0S
Tplus D Settlementdate of the contract 0
F
0minusS
TThe last period of cash flow equals to
[
F0−S0×(
1+rf+D)
]
.In principle, the firms cannot get profit from the different price, leading to the conclusion that at the beginning the firm gets the value of assets equal to 0VND, the end of the period the firm gets the value of assets equal to 0VND. That means:
[
F0−S0×(
1+rf+D)
]
=0 or F0=S0×(
1+rf)
−D=00
F
. Called d equal to D perS
0 (dividend rate), so(
r d)
S
F0= 0×1+ f− , the above formula for calculating future price is called as cost relationship of financial assets arc-hives that the maturity of future contract is T then:
(
)
Tf d
r S
F0= 01+ − , the future price at same time is
t
, and the formula is as follows:(
1 r d)
T-t Formula(4) SFt = t + f − .
When the futures contracts are settled, leading to
t
equal to T and
F
T=
S
T.From accounting theories and financial methods above, they are applied to data analysis of the article below.
3. Data Analysis and Sense of
Derivative Financial Instruments in
Hedge Activities
3.1. Supposed Economic Events2
According to new statistics published by the General Administration of Customs, from January to the end of the first quarter of 2013, gross domestic turnover rate of ex-ports and imex-ports reached 59.25 billion U.S. dollars, up 18.7 % compared with the same period in 2012. The major exported commodities remained increase, in which many commodities have an export turnover of more than $ 1 billion such as :
Crude oil: Crude oil exports in the first 3 months of 2013 reached more than 2 million tons, an increase of 16.3 % and an output value reached 1.85 billion U.S. dollars, up 7.6 % compared to the same period in 2012. Exports of crude oil increased by $ 130 million due to increased turn-over of 280 million USD and drop prices (7.5%) lead to the value of exported commodities fell by $ 150 million.
Coffee: As of January 3-2013 coffee export was beyond the rice export (higher turnover of 326 million dollars) and agricultural products become a major export of the country (30 % density). The statistics show that the first quarter of 2013 the exported coffee volume reached 476 thousand tons and valued at $ 1.02 billion, down 10.9 % in volume and 7.7% in value over the same period of last year etc. (Source : General Department of Customs).
Although Vietnam exports the crude oil, Vietnam also imports 100 percentages of petroleum products. The world crude oil prices rise, making internal gasoline prices also increased. On the other hand, the revenues from crude oil exports also increased. However, the ability to export crude oil of Vietnam remains limited while demand increases constantly. In fact, the revenues from crude oil export are not enough for the import cost of petroleum products.
By reasons above, the article is assumed by economic events occurring as follows:
3.1.1. First Economic Transactions
* In January 2013, the firm had the following transac-tions:
Imported 100 buckets of crude oil, the market price was 91. 82 USD/ bucket, the exchange rate was 20,820 (VND/USD), they were unpaid.
Sold 50 buckets, the market price was 2,294,031 VND/bucket, and paid in cash.
Note: The price of crude oil and exchange rate from Source: Journal of ministry of finance and website: viet-combank.com.vn of the Bank.
3.1.2. Second Economic Transactions
*In February 2013, the firm had transactions of foreign currency with the Bank (Techcombank) as follows:
Sold foreign currency with an amount of 200,000 USD (beginning debit balance), current exchange rate was 20,855 (VND/USD), historical exchange rate was 20,720 (VND/USD), exchange rate on the payment date of firm
2
This supposition basis in the Vietnamese market
was 20,815 (VND/USD).
In March 2013, purchased foreign currency to pay the first economic transactions with an amount of 120,000 USD, current exchange rate was 20,855 (VND/USD), spot rate was 20,960 VND/USD. (Deposit interest rate of USD is 2 % / year, deposit interest rate of VND is 9 % / year, lending interest rate of USD is 5 % / year, lending interest rate of VND is 15 % / year, those data from the Source: website: vietcombank.com.vn of the bank).
3.1.3. Third Economic Transactions
In March 2013, the firm bought 5,000 shares (Invest-ment Corporation and Prices Evaluation of Oil and Gas – PIV), par value share was 10,000 VND/share, and the mar-ket price was 22,000 VND / share, paid in cash.
Note: The variable security's price on stock market from 15,000 VND/share to 25,000VND/share. (Stock prices by source Website: cophieu68.com).
3.1.4. Final Economic Transactions
In March 2013, the firm bought 20 tons of Robusta cof-fee, the paid price was 44,500,000 VND/ton and paid in cash.
Note: The volatility of market price was as follows: in January 2013, coffee price was 40,700,000 VND/ton; in February 2013, coffee price was 39,500,000 VND/ton and coffee price in March 2013 was 44,500,000 VND/ton. (Coffee prices by Source: Y5CAFE: Website: GIA-CAPHE.COM).
3.2. Application of Derivative Instruments for Hedging Activities
3.2.1. First Economic Transactions
The firm A uses forward contracts and the maturity of the contract is 3 months; the current price of crude oil is 90.817 USD / bucket. The forward price is 90.82 USD/bucket (using formula 2).
( ) 90.82 USD/bucket
360 100
3 ) 5 . 0 9 . 0 90.817
90.817 =
× × − × + =
P F
The following is double entry:
3.2.2. Second Economic Transactions
The firm also uses swap contracts for purchase and sale of foreign currency with the Bank (Techcombank) and the maturity of the contract is 3 months. The bank and the firm identify and agree upon forward rate and they swap this exchange rate together with relationship of purchase and sale as follows: (using formula 2 and 3).
The forward rate for sale bases in
s
s = 20,855 (VND/USD), Lcv(VND) =15 % / year, Lgt(NT)=2 % / year, N= 3 months.( ) 20,857
360 100
3 ) 2 . 0 5 . 1 20,855
20,855 =
× × − × + =
s F
and N = 3 months.
( ) 20,856 VND/USD
360 100
3 ) 5 . 0 9 . 0 20,855
20,855 =
× × − × + =
P F
The forward rate for purchase equals to 20,856
(VND/USD). The following is double entry:
Table 2. – purchase and sale of oil at forward price (Forward contract: 90.82 USD / bucket & exchange rate: 20,820 (VND/USD)
Date and Explanation Accounts Debits Credits
January 2013 Inventories (crude oil) 191,169,240 VND
1 Purchase of crude oil Account payable 189,087,240 VND
Difference of two prices Other comprehensive income (OCI) 2,082,000 VND
2 Sale of crude oil Cash 114,701,544 VND
Revenue – sale of goods 114,701,544 VND
3 Cost of sale Cost of goods sold 95,584,620 VND
Inventories (crude oil) 95,584,620 VND
Total: 401,455,404 VND 401,455,404 VND
Note:
Forward price is $90.82/bucket x 100 buckets = $9,082
⇔
: $9,082 x 20,820 (VND/USD) = 189,087,240 VND.The market price is $91.82/bucket x 100 buckets = $9,182
⇔
: $9,182 x 20,820 (VND/USD) =191, 169,240 VNDDifference of the two prices is ($91.82/bucket minus $90. 82/bucket) x 100 buckets = $100
⇔
: $100 x20,820(VND/USD)= 2,082,000 VND.Sales revenue of goods: 50 buckets x 2,294,031VND/bucket =114, 701,544 VND.
Cost of sale: price unit = 191, 169,240 VND/100 buckets = 1,911,692 VND/bucket, and then: 50 buckets x 1,911,692 VND/bucket = 95,584,620 VND.
Table 3. – forward rate:
F
P= 20,856;F
s= 20,857 (VND/USD)Date and Explanation Accounts Debits Credits
2/2013 Cash 4,171,400,000 VND
1 Sale of foreign currencies Inventories (foreign currencies) 4,144,000,000 VND
Difference of Exchange Rate Revenue – Financial Activities 27,400,000 VND
2 Purchase of foreign currencies Inventories (foreign currencies) 2,515,200,000 VND
Cash 2,502,720,000 VND
Difference of two exchange rates Other comprehensive income 12,480,000 VND
Total: 6,686,600,000 VND 6,686,600,000 VND
Note:
Sale of foreign currencies: the forward rate: 4,171,400,000 VND = 200,000 USD x 20,857 (VND/USD).
Historical exchange rate: 4,144,000,000 VND = 200,000 USD x 20,720 (VND/USD).
Difference of two exchange rates between forward rate and historical rate: 27,400,000 VND equal to 200,000 USD multiply [20,857 (VND/USD) minus 20,720 (VND/USD)].
Purchase of foreign currencies, the spot rate: 2,515,200,000 VND =120,000 USD x 20,960 (VND/USD).
The forward rate: 2,502,720,000 VND = 120,000 USD x 20,856 (VND/USD).
Difference of two exchange rates between forward rate and spot rate: 12,480,000 VND equal to 120,000 USD multiply [20,960 (VND/USD) minus 20,856 (VND/USD)].
the call option is 18,000 VND/share. (Note: No use option contracts for “short selling”). The double entry is as
fol-lows:
Table 4. – the price of call option: 18,000 VND/share
Date and Explanation Account Debits Credits
3/2013 Inventories (Common Stocks) 115,000,000 VND
Purchase of securities Cash 90,000,000 VND
Transaction fee of call option Cash 5,000,000 VND
Difference of two prices Other Comprehensive income 20,000,000 VND
Total: 115,000,000 VND 115,000,000 VND
Note:
Following the price of call option: 90,000,000VND = 5,000 shares x 18,000 VND/share.
Following the market price: 110,000,000 VND = 5,000 shares x 22,000 VND/share.
Fee of security transactions: 5,000,000 VND = 5,000 shares x 1,000 VND/share.
Total value of common stocks: 115,000,000 VND = 110,000,000 VND5, 000,000 VND
The difference of two prices between price of call option and market price: 20,000,000 VND equal to 5,000 shares multiply (22,000 VND/share minus 18,000 VND/share).
3.2.4. Final Economic Transactions
The firm also uses future contracts to buy Robusta cof-fee, the future price is 40,700,000 VND/ton, the maturity of the contract is 3 months, the interest rate is 9%/year, the current price is 32,761,895 VND/ ton (using formula 4).
(
1)
T0
0 S rf
F = + ;
(
)
VND tonF0=32,761,895× 1+0.07 3 =40,700,00 /
Before taking part in the central exchange and they have an initial margin on clearing, it is 814,000,000 VND until settlement date of contract.
Table 5. – Daily Notes on a variable price of the basis asset
Date No Marking to Market A
Gain/loss B
B2= A2A1; B3=A3 – A2
Last period of cash flow C
C2 =C1B2 and C3=C2 B3
1/2013 1 40,700,000 VND/ton 0 VND 814,000,000 VND
2/2013 2 39,500,000 VND/ton (1,200,000) VND x 20 tons 790,000,000VND
3/2013 3 44,500,000 VND/ton 5,000,000 VND x 20 tons 890,000,000 VND
Total: 3,800,000 VND x 20 tons
Table 6. – the future price: 40,700,000 VND/ton
Date and Explanation Accounts Debits Credits
3/2013 Inventories (Robusta coffee) 890,000,000 VND
Purchase of Robusta coffee Cash 814,000,000 VND
Difference of two prices Other comprehensive income. 76,000,000 VND
Total: 890,000,000 VND 890,000,000 VND
Note:
Following the market price: 890,000,000 VND = 20 tons x 44,500,000 VND/ton.
Following future price: 814,000,000 VND = 20 tons x 40,700,000 VND/ton.
The difference of two the prices: 76,000,000 VND equal to 20 tons multiply (44,500,000 VND/ton minus 40,700,000 VND/ton)
3.3. Non-Application of Derivative Instruments for Hedg-ing Activities
3.3.1. First Economic Transactions
In case, the firm does not apply derivative instruments to
hedge activities, the occurring economic events have no difference in price and interest rate. Therefore, the firm does not adjust it and the double entry is as follows:
Table 7. – the market price
Date and Explanation Accounts Debits Credits
In January 2013 Inventories (crude oil) 191,169,240 VND
1 Purchase of crude oil Account payable 191,169,240 VND
2 Sale of crude oil Cash 114,701,544 VND
Revenue – sales of goods 114,701,544 VND
3 Cost of sale Cost of goods sold 95,584,620 VND
Inventories 95,584,620 VND
Total : 401,455,404 VND 401,455,404 VND
Note:
The market price is $91.82/bucket x 100 buckets = $9,182
⇔
: $9,182 x 20,820 (VND/USD) =191,169,240 VNDSale of crude oil and cost of sale: 114,701,544 VND = 50 buckets x 2,294,031VND/bucket and then 95,584,620 VND = 50 buckets x 1,911,692 VND/bucket.
3.3.2. Second Economic Transactions
The firm does not use swap contracts for purchase and
sale of foreign currency with the Bank (Techcombank) as follows:
Table 8. – the exchange rate of payment
Date and Explanation Accounts Debits Credits
2/2013 Cash 4,163,000,000 VND
1). Sale of foreign currencies Amount of foreign currencies 4,144,000,000 VND
Difference of exchange rate Sales revenue of foreign currencies 19,000,000 VND
2). Purchase of foreign currencies
Amount of foreign currencies 2,515,200,000 VND
Cash 2,515,200,000 VND
Note:
Sale of foreign currencies: the exchange rate of payment: 4,163,000,000 VND = 200,000 USD x 20,815 (VND/USD).
Historical exchange rate: 4,144,000,000 VND = 200,000 USD x 20,720 (VND/USD).
Difference of two exchange rates between the exchange rate of payment and historical rate: 19,000,000 VND equal to 200, 000 USD multiply [20,815 (VND/USD) minus 20,720 (VND/USD)].
Purchase of foreign currencies, the spot rate: 2,515,200,000 VND =120, 000 USD x 20,960 (VND/USD).
3.3.3. Third Economic Transactions
The firm does not also use option contracts to buy secur-ities and the double entry is as follows:
Table 9. – the market price
Date and
Explanation Accounts Debits Credits
3/2013 Common Stocks 110,000,000 VND
Purchase
of securities Cash 110,000,000 VND
Total: 110,000,000 VND 110,000,000 VND
Note:
Following the market price: 110,000,000 VND = 5,000 shares x 22,000 VND/share.
3.3.4. Final Economic Transactions
The firm does not also use future contracts to buy Ro-busta coffee and the double entry is as follows:
Table 10.–the market price: 44,500,000 VND/ton
Date and
Explanation Accounts Debits Credits
3/2013 Inventories
(Robusta coffee) 890,000,000 VND
Purchase of
Robusta
coffee
Cash 890,000,000 VND
Total: 890,000,000 VND 890,000,000 VND
Note:
Following the market price: 890,000,000 VND = 20 tons x 44,500,000 VND/ton.
Base of data analysis above, they are used to make fi-nancial reporting and the research results below:
4. Research Results
4.1. The Result of Financial Statements, in Case the Firm Uses Derivative Instruments for Hedging Activ-ities
From the table 1 to the table 5, the results of debit and credit balance of accounts are as follows the formula of debit balance and credit balance.
For assets
Debit balance equal to beginning debit balance plus in-creases in an account debit minus a decrease in account credit.
The debit balance of inventories (crude oil) equal to 0 VND plus 191, 169,240 VND minus 95, 584,620 VND equal to 95,584,620 VND.
The debit balance of inventories (foreign currencies) equal to 4,144,000,000 VND plus 2, 515,200,000 VND minus 4, 144,000,000 VND equal to 2,515,200,000 VND. The debit balance of inventories (Common Stocks) equal to 0 VND plus 115, 000,000 VND minus 0 VND equal to 115,000,000 VND.
The debit balance of inventories (Robusta coffee) equal to 0 VND plus 890, 000,000 VND minus 0 VND equal to 890,000,000 VND.
The debit balance of cash equal to 0 VND plus (114,701,544 VND plus 4, 171,400,000 VND) minus (2,502,720,000 VND plus 90, 000,000 VND plus 5, 000,000 VND plus 814, 000,000 VND) equal to 874,381,544 VND.
For equity and liabilities
Credit balance equal to beginning credit balance plus in-crease in the account credit minus dein-crease in account debit.
The credit balance of account payable equal to 0 VND plus 189, 087,240 VND minus 0 VND equal to 189, 087,240 VND.
For Revenue, other comprehensive income and produc-tion and operating expenses
In case of other comprehensive income in table 1, we have to adjust between other comprehensive income and sales revenue of goods when the other comprehensive in-come is realized from the sale of crude oil and adjust it as follows:
Adjustment of price unit equal to 2,082,000 VND divide 100 buckets equal to 20,820 VND/bucket, the adjusted amount of other comprehensive income equal to 50 buck-ets multiply 20,820 VND/bucket equal to 1,041,000 VND.
Adjustment of double entry:
rec-ognized decrease in other comprehensive income is 1,041,000 VND.
Other comprehensive income (debit): 1,041,000 VND. Sales revenue of goods (credit): 1,041,000 VND.
4.1.1. Why Adjustment?
Assuming that 100 buckets of crude oil are sold, the re-sult of table 1 is as follows:
In case of purchase: inventory of crude oil is 189,087,240 VND (paid real price) plus 2,082,000 VND (unrealized gain).
In case of sale: real sale price is 229,403,100 VND, si-multaneously, the sales revenue is also 229,403,100 VND and inventory of crude oil (189,087,240 VND plus 2, 082,000 VND) is transferred to cost of sale.
The profit of the sale equal to Sales revenue minus Cost of sale minus other expenses (if any) equal to 229,403,100 VND minus [89,087,240 VND plus 2, 082,000 VND (un-realized gain)] equal to 38,233,860 VND leading to this is irrelevant. So, other comprehensive income is readjusted that recognized increase in sales revenue of goods and rec-ognized decrease in other comprehensive income is 2,082,000 VND. Now, the other comprehensive income equal to 2,082,000 VND minus 2, 082,000 VND equal to 0 VND and the profit of sale equal to 38,233,860 VND plus 2, 082,000 VND equal to 40,315,860 VND. This case, all other comprehensive income is transferred to the profit of the sale. According to first economic transactions, the other comprehensive income is only realized as 1,041,000 VND. So, it is transferred to the profit of sale as 1,041,000 VND.
Other comprehensive income equal to 2,082,000 VND plus 12, 480,000 VND plus 20, 000,000 VND plus 76,000,000 VND minus 1, 041,000 VND equal to 109, 521,000 VND.
Revenue of Financial Activities = 27,400,000 VND. Sales revenue of goods = 114,701,544 VND plus 1, 041,000 VND equal to 115,742,544 VND
Cost of goods sold = 95,584,620 VND
Table 11. The result of income statement and the result of balance sheet
1.The result of income statement
Assumed current exchange rate is 20,950 VND /USD
VND Unit Equivalent to $ Unit
1). Revenue-sales 115,742,544 5,524.704
2). Cost of goods sold 95,584,620 4,562.512
3). Profit –
sale = 1) - 2) 20,157,924 962.192
4). Revenue –
Financial Activities 27,400,000 1,307.876
5). Financial
expense 0, 00 0, 00
6). Profit
Financial Activities = 4) – 5)
27,400,000 1,307.876
7). Business profit after Income Tax = 3) + 6)
47,557,924 2,270.068
8). Other Comprehensive Income (gain/loss)
109,521,000 5,227.733
9). Total
Profit = 7) - 8) 157,078,924 7,497.801
2. The result of balance sheet
A. Assets:
I.Currencies: 1) + 2) 3,389,581,544 161,793.868
1). Cash: 874,381,544 41,736.589
2). Foreign currencies 2,515,200,000 120,057.279
II.Short–term
III.investments 115,000,000 5,489.260
1). Common stocks: 115,000,000 5,489.260
IV. Inventories
= 1) + 2) 985,584,620 47,044.612
1). Crude oil: 95,584,620 4,562.512
2). Robusta coffee 890,000,000 42,482.100
Total Assets
= I + II + III 4,490,166,164 214,327.741
A. Liabilities: 189,087,240 9,025.644
1). Accounts payable 189,087,240 9,025.644
B. Equity =
1) + 2) +3) +4) 4,301,078,924 205,302.097
1). Investment
securities (5,000 shares) 115,000,000 5,489.260
2). Investment
capital 4,029,000,000 192,315.036
3). Retained
Earnings 47,557,924 2,270.068
4). Other Comprehensive Income (Gain/loss)
109,521,000 5,227.733
Total Liabilities & Equity: (A+ B)
4,490,166,164 214,327.741
Firm Doesn’T Use Derivative Instruments for Hedg-ing Activities
From the table 6 to the table 9, the results of debit and credit balance of accounts are as follows:
The formula
of
debits balance and credit balance:4.2.1. For Assets
Debit balance equal to beginning debit balance plus in-crease in an account debit minus dein-crease in account credit.
The debit balance of inventories (crude oil) equal to 0 VND plus 191,169,240 VND minus 95,584,620 VND equal to 95,584,620 VND.
The debit balance of inventories (foreign currencies) equal to 4,144,000,000 VND plus 2,515,200,000 VND minus 4,144,000,000 VND equal to 2,515,200,000 VND.
The debit balance of inventories (common stocks) equal to 0 VND plus 110, 000,000 VND minus 0 VND equal to 110,000,000 VND.
The debit balance of inventories (Robusta coffee) equal to 0 VND plus 890, 000,000 VND minus 0 VND equal to 890,000,000 VND.
The debit balance of cash equal to 0 VND (114,701,544 VND plus 4, 163,000,000 VND) minus (110,000,000 VND plus 890, 000,000 VND plus 2, 515,200,000 VND) equal to 762,501,544 VND.
4.2.2. For Equity and Liabilities
Credit balance equal to beginning credit balance plus in-crease in the account credit minus dein-crease in account de-bit.
The credit balance of account payable equal to 0 VND plus 191,169,240 VND minus 0 VND =191,169,240 VND.
4.2.3. For Revenue, Production and Operating Expenses
Revenue of financial Activities = 19,000,000 VND. Sales revenue of goods = 114,701,544 VND. Cost of goods sold = 95,584,620 VND.
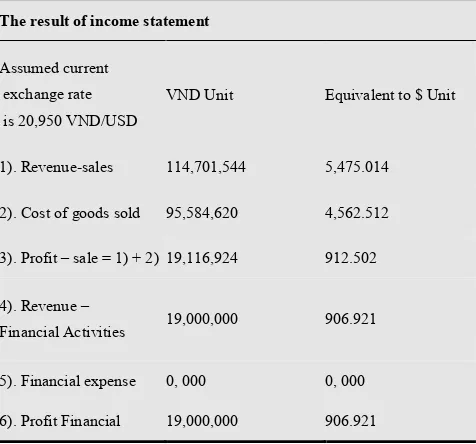
Table 12. The result of income statement and the result of balance sheet
The result of income statement
Assumed current exchange rate is 20,950 VND/USD
VND Unit Equivalent to $ Unit
1). Revenue-sales 114,701,544 5,475.014
2). Cost of goods sold 95,584,620 4,562.512
3). Profit – sale = 1) + 2) 19,116,924 912.502
4). Revenue –
Financial Activities 19,000,000 906.921
5). Financial expense 0, 000 0, 000
6). Profit Financial 19,000,000 906.921
Activities = 4) – 5).
7). Business profit after Income Tax = 3) + 6).
38,116,924 1,819.424
8). Other Comprehensive Income (gain/loss)
0,000 0, 00
9). Total Profit = 7) + 8) 38,116,924 1,819.424
The result of balance sheet
A. Assets:
I.Currencies
= 1) + 2) 3,277,701,544 156,453.534
1). Cash 762,501,544 36,396.255
2). Foreign currencies 2,515,200,000 120,057.279
II. Short–term
investments 110,000,000 5,250.597
1). Common stocks 110,000,000 5,250.597
III.Inventories = 1) + 2) 985,584,620 47,044.612
1). Crude oil 95,584,620 4,562.512
2). Robusta coffee 890,000,000 42,482.100
Total Assets
= I + II+ III 4,373,286,164 208,748.743
A. Liabilities 191,169,240 9,125.023
1). Accounts payable 191,169,240 9,125.023
B. Equity
= 1) + 2) + 3) + 4) 4,182,116,924 199,623.720
1). Investment
securities (5,000 shares) 110,000,000 5,250.597
2). Investment capital 4,034,000,000 192,553.699
3). Retained Earnings 38,116,924 1,819.424
5). Other Comprehensive Income (Gain/loss)
0,000 0,000
Total Liabilities
Table 13. Comparative results of Balance sheet ((Unit: $)
Items
Balance sheets Different ratio (%)
Different densi-ty (%)
A B A B
I. Currencies
= 1) + 2) 161,793.868 156,453.5343.41% 75.49% 74.95%
1). Cash: 41,736.589 36,396.255 14.67%
2). Foreign
currencies 120,057.279 120,057.2790.00%
II. Short–term
investments 5,489.260 5,250.597 4.55% 2.56% 2.52%
1). Common stocks 5,489.260 5,250.597 4.55%
III. Inventories
= 1) + 2) 47,044.612 47,044.612 0.00% 22% 23%
1). Crude oil 4,562.512 4,562.512 0.00%
2). Robusta coffee 42,482.100 42,482.100 0.00%
Total Assets:
I + II+ III 214,327.741 208,748.7432.67% 100% 100%
Liabilities & Equity
A. Liabilities: 9,025.644 9,125.023 1.09% 4.21% 4.37%
1). Accounts
payable: 9,025.644 9,125.023 1.09%
B. Equity =
1) + 2) + 3) + 4) 205,302.097 199,623.7202.84% 95.79% 95.63%
1). Investment securities: (5,000 shares)
5,489.260 5,250.597 4.55%
2). Investment
capital 192,315.036 192,553.6990.12%
3). Retained
Earnings 2,270.068 1,819.424 24.77%
4). Net Other Comprehensive Income (Gain/loss)
5,227.733 0,000
Total Liabilities
& Equity (A+B) 214,327.741 208,748.7432.67% 100% 100%
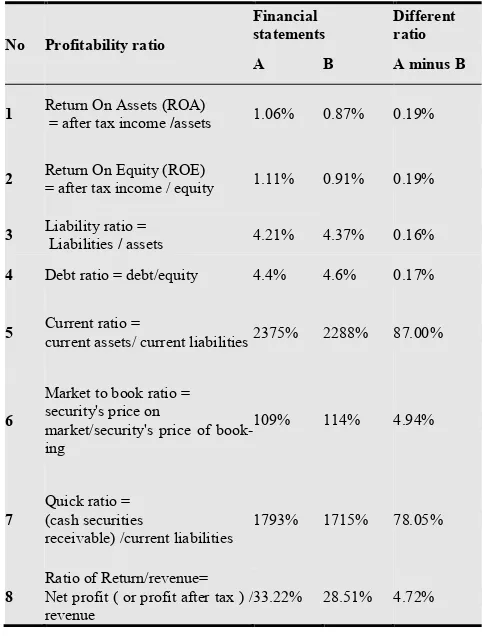
Table 14. Profitability ratio on financial statements A & B
No Profitability ratio
Financial statements
Different ratio
A B A minus B
1 Return On Assets (ROA) =after tax income
/assets 1.06% 0.87% 0.19%
2 Return On Equity (ROE) = after tax income / equity 1.11% 0.91% 0.19%
3 Liability ratio Liabilities =
/ assets 4.21% 4.37% 0.16%
4 Debt ratio = debt/equity 4.4% 4.6% 0.17%
5 Current ratio = current assets/ current liabilities 2375% 2288% 87.00%
6
Market to book ratio = security's price on
market/security's price of book-ing
109% 114% 4.94%
7
Quick ratio = (cash securities
receivable) /current liabilities
1793% 1715% 78.05%
8
Ratio of Return/revenue= Net profit ( or profit after tax ) / revenue
33.22% 28.51% 4.72%
4.3. The Results of the Comparative Research Method and Impact Factors
4.3.1. The Impact Factors on Balance Sheet
Supposing that in case the firm uses derivative instru-ments for hedging activities, the financial statement is (A) and in case the firm doesn’t use derivative instruments for hedging activities, the financial statement is (B).
Note:
Ratio
of
100
;
(
i
1
,
2
,
3
...
n
)
B
B
A
A
i i i
i
×
=
−
=
;100
of
Density
1 i
i
=
×
∑
= n
i i
A
A
A
;
100 of
Density
1 i
i= ×
∑
= n
i i B B B
4.3.2. The Impact Factors of Business Strategy
Based on the results of the financial statements, the ar-ticle analyses financial ratio to realize different results of two financial statements A and B. These different results are foundations to assess the effects of use derivative in-struments for hedging activities.
5. Discussion of Impact Factors on
Hedge Activities in Case of the other
Invariable Factors
The results above show that both of financial statements A and B are different in capital structure, assets and busi-ness results. Which factors do affect the different results of the two financial statements? Those are factors of the price volatility and the exchange rate volatility and other prob-lems discussed below:
5.1. The First Problem: Difference of Cash Ratio on the Balance Sheet
According to the results above, there are differences in price and exchange rate (market price and forward price; inter-bank rate and forward rate).
5.1.1. The Different Price
The first economic transactions: the different price is equal to $90.82/bucket minus $91.82/bucket = (1) USD/bucket x 20,820 (VND/USD) = (20,820) VND/bucket (market price and forward price), equivalent ratio is (1.09)%
The third economic transactions: the different price is equal to 18,000 VND/share minus 22,000 VND/share = (4, 000) VND /share (price of the call option and market price), equivalent ratio is (18.18)%.
The final economic transactions: the different price is equal to 40,700,000 VND/ton minus 44,500,000 VND/ton = (3,800,000) VND/ton (future price and market price), the equivalent ratio is (8. 54)%.
The total impact ratio is equal to (27.81) %. This case, the firm profits from the purchase when the forward price and future price are lower than the market price.
5.1.2. The Different Exchange Rate
Different exchange rate of sale and the different ex-change rate are equal to 20,857 (VND/USD) minus 20,815 (VND/USD) equal to 42 VND (forward rate and inter-bank rate), equivalent ratio is 0.20%. (The forward rate is higher than the interbank rate leading to increase in profit.
The different exchange rate of purchase and the different exchange rate are equal to 20,856 (VND/USD) minus 20,960 (VND/USD) equal to (104) VND (forward rate and inter-bank rate), equivalent ratio is 0.50% (contrary to sale, the forward rate is lower than the inter-bank rate leading to increase in profits).
5.2. The Second Problem: Benefits of Derivatives for Hedging Activities
Minimization of business risk: In the case of using de-rivative instruments to avoid risk of fluctuating prices and fluctuating exchange rates on the market. Because, the market price at the maturity date of the contract is higher than the expected price, the financial risks make the firm’s capital to be reduced, but this decline will be compensated
by the profits of the forward contracts. Actually, the firm has profit of 1.09 % from forward contracts for the pur-chase of crude oil. In this case the firm has used forward contracts for hedging activities to avoid losses due to the volatility of market prices. The firm’s assets are up 2.67%. The formula (2) shows that if the firm purchases a big amount of commodities, the firm’s profits will increase more from different price. In addition, the credit risks or unpayable risks on contract have an impact on the owner of the contract (receiver or payer), depending on the actual price volatility of the basis asset. Therefore, the use of de-rivative instruments for hedging activities helps the man-agers or investors avoid their financial risks, and they can immediately determine the future value of assets and mas-ter the market volatility. Assuming that the firm buys se-curities in condition of price volatility on the market from 15,000 VND/share to 25,000 VND/share. In this case, the company has determined the purchase price of the securi-ties (18,000 VND/share) at the maturity date of the con-tract and avoided the financial risks.
Benefits for the firm: Supposing that the firm applies derivative instruments for purchase and sale of commodity such as forward contracts, option contracts, future con-tracts and swap concon-tracts. Each of the concon-tracts brings dif-ferent benefits to the firm. According to the assumption above, the firm has used forward price to purchase, it made the firm’s profit increase by $ 2,082,000, equivalently to the rate of 1.09%. In case of foreign currency trading, the firm has also used the swap rate in foreign currency trans-actions with the bank, it brought profit of 0.7% (both buy-ing and sellbuy-ing). In case, the firm has used future contracts to trade coffee as per the clearing method. Under this me-thod, he can know the profit or loss daily. Table 5 shows that in February, the firm suffered losses due to low coffee prices, but in March, he profited by increased coffee prices. On settlement of the contract, the firm had a profit of 76,000,000 VND, equivalently to the rate of 8.54 %. Al-though the market price is lower than the future price or forward price or forward rate, the firm still avoids the fi-nancial risks. Because, the future price and forward rate are estimated on the basis of risk factors such as interest rate, return ratio and current price of the goods. For the option contracts, if it is disadvantageous for the firm, he will be unable to perform. So, the firm still controls their financial risks.
5.3. The Third Problem: Different Ratio snd Different Density of both Balance Sheets
5.3.1. The Different Ratio
The results of table 14 show different ratios between both financial reporting A and B as follows:
financial reporting A is higher due to increased transaction fee of the call option. The inventories are evaluated follow-ing market prices, but the payment price follows the prices of derivative contracts. Normally, the inventory values of both financial statements are also evaluated by the market price.
The liability ratio of the financial reporting A is also lower than the liability ratio of the financial reporting B (1.09%) due to the effect of difference of the purchase price as analyzed above.
This special Other Comprehensive Income (Gain/loss) is only recognized for the financial reporting A when the firms apply derivative instruments for hedging activities and its value increases by $ 5,227.733.
5.3.2. Different Density
The currency density of financial reporting A is higher than the currency density of financial reporting B, equal to 75.49% minus 74.95% equal to 0.54%, it means that the volatility of cash and short-term financial investments will be able to affect the ability of facing the debt maturity. Therefore, the increase in currency density of the financial reporting A is better than the currency density of the finan-cial reporting B. Besides, the inventory volatility also af-fects business processes from commodity reserve or pro-duction for sale. If the inventory density is too high, it will impact on inventory turnover. The relationship between currency density and inventory density on the financial reporting A shows that the currency density increases, but inventory density decreases. This is good for the firm’s business. However, the relationship between currency den-sity and inventory denden-sity on the financial reporting B is contrary with relationships between them on the financial reporting A.
For liability density, the results of table 13 show that the liability density of the financial reporting A is lower than the liability density on the financial reporting B. If this density is too high leading to the firm will be bankrupt because of the firm’s high debt and payment inability.
5.4. The Fourth Problem: Profitability Ratio
Profitability from the use of the assets: this ratio shows that the firm gets how much a profit unit about use of an asset unit.
ROA, the profitability ratio of asset unit on the financial report A is 1.06%, it means that when the firm uses an asset unit, its profitability will be 0.0106 profit units. In case above, the firm uses asset of 4,490,166,164 VND to get profit of 47,557,924 VND. If the return of the financial reporting A is added up unrealized gain, the profitability of the asset will be higher than that as follows:
% 50 . 3 41 $214,327.7
$7,497.801 41
$214,327.7 5,227.733 $
$2,270.068
ROA = + = =
With ROA = 3.50%, the firm has 157,078,924 VND from use of their assets.
ROA, profitability of assets in the financial statements B is 0.87%, it means that the firm uses asset unit; its prof-itability is only $ 0.0087 profit. If comparing ROA (A) with ROA (B), the different results are 3.50% minus 0.87% equal to 2.63%. In case, he applies derivative instruments to hedge activities, his profit is higher. In fact, ROA of the financial statements A is 2.63% higher than ROA of the financial statements B.
Profitability of equity: This ratio shows how much the net profit is generated from the equity. Besides, the ROE is the most accurate measure to assess the accumulation of capital spending so that how much net profit is generated. This is also a reliable ratio of the profitability of the firm in the future. The ROE is often used by the investors to ana-lyze stocks and compare to the same industry. It is also referenced when they decide to buy shares of any company. Specially, the firm’s ROE ratio is as high as possible. It means that the effective use of their capital is good. So the ROE is higher and the stock is more attractive to the inves-tors. From this reason, profitability of equity generated from the use of equity in the financial statements A is 1.11%, it means that when the firm uses an equity unit, he gets 0.011 profit units. If the return is added up unrealized gain, the ROE is higher as follows:
% 65 . 3 97 $205,302.0
$7,497.801 97
$205,302.0
5,227.733 $
8 4$2,270.06
ROE= + = =
This case, the firm's equity has generated more profits. When the firm uses equity, he will get 0.037 VND profit units. The profitability of equity on the financial reporting B is only 0.91%. Comparing the results of the ROE (A) and ROE (B) is 3.65% minus 0.091% equal to 3.56%, the profitability of equity of the financial statements A is high-er than the profitability of equity on the financial state-ments B (3.56%).
5.4.1. Liability Ratio
This ratio measures how much percentage of the firm’s the assets from borrowing and shows the financial autono-my ability of the firm. If the ratio is too small, the firm’s asset is borrowed less. If the ratio is too high, Almost the firm’s assets are borrowed, leading to affect his competi-tiveness. This also implies the level of the higher business risks. The hypothesis above shows that the liability ratio of the financial reporting A is lower than liability ratio of fi-nancial reporting B (0.16%) due to using hedge instru-ments.
5.4.2. Debt Ratio
nancial report A is compared with the debt ratio of the fi-nancial statements B, it is lower (0.17%), it means that the financial risks on the financial statements A reduce by 0.17%.
5.4.3. Current Ratio
Solvency of the firm is a financial capacity that he can get to meet payment demands of his debt to other individu-als or organizations related to the firm’s loan or debt. Therefore, if the current ratio is higher, the firm’s solvency will be higher. If this ratio is less than one, his business assets are not enough to immediately pay the current liabil-ities of coming due. So the article views the difference ratio between the current ratio of the financial reporting A and the current ratio of the financial reporting B, the result shows that the current ratio of the financial reporting A is higher than the current ratio of financial reporting B (87%). This demonstrates that when the firm applies derivative instruments for hedging activities, this result affects the firm’s solvency.
5.4.4. Market to Book Ratio (P/B)
The ratio means relating to the safety of long-term in-vestments. P/B also shows that the investors are willing to pay stock price that are much higher than the book value. This ratio is only really useful when the investors consider which firms have high capital level or financial firms. Be-cause the asset value of these firms is relatively large. However, the accuracy of the P/B depends on the applica-tion of accounting standards and inconsistent value is sometimes distorted by accounting tricks. The book value sometimes does not reflect the real value of shares leading to (P/B) will become inaccurate. Therefore, when using two different methods, leading to the difference ratio. This result will directly affect investment when he analyzes data on the financial statements. From the results in Table 14, comparing the ratio of the financial statements A with the ratio of the financial statements B, it reduces by 4.94%. Why it reduces? Because the firm purchases a call option to ensure his financial security. If the stock price disadvan-tage to the firm’s profit, maybe he doesn’t realize this transaction. So he is not damaged to his finances, but he has to pay a transaction fee for the call option. As a result, the ratio reduces by 4.94%, this percentage also increases his financial safety.
5.4.5. Quick Ratio
Quick ratio shows comparable relationship between cash and cash equivalents with short-term debt. The cash equi-valents are considered as assets with fast money circulation speed (short-term investments, short-term receivables). This quick ratio is shown on the firm’s health status of short-term finance. Under this principle, if the coefficient of liability solvency is higher, the firm’s health status of short-term finance is good and vice versa. This coefficient is equal to one or greater, indicating the ability to meet higher debt payment for the short-term debts. Therefore, the firm does not get into financial trouble when he needs
immediate payment for the short-term debts. Conversely, if the ratio is less than one, the firm will not be able to imme-diately pay all short-term debts or the firm will meet finan-cial difficulty when he cannot immediately pay the short-term debts. In this case, the quick ratio of the financial porting A is higher than the quick ratio of the financial re-porting B (78.05%). Because, the firm applies derivative instruments for hedging activities to prevent financial risk from the firm’s insolvency and it increases by 78.05%.
6. Conclusion
The effect of accounting method: Use of the accounting methods plays an important role in the recognizing process of accounting data and making financial statements. There-fore, the accounting policy must conform to the firm’s ap-plication. The resulting analysis above demonstrates that the use of two accounting methods will lead to the two different results. Thus, countries need to develop account-ing principles and methods, which should be based on fluc-tuation factors of price and exchange rate on the market to ensure the value of assets or liabilities in business process. Outcome analysis also indicates that hedge accounting brings great profit to the firms and investors. Simulta-neously, it also minimizes the risks.
The impact factors of market price and exchange rate: Business process, asset value and liability are volatile due to the impact of market prices. So, the firms should use derivative instruments to minimize the risks. The data analysis above also shows that the use of derivative in-struments for hedging activities brings high effectiveness to the firms. Comparing the financial statements A with the financial statements B, all of the above criteria in financial statements A give the relevance and reliability of account-ing data to the managers or investors. The accountaccount-ing poli-cy makers, managers and investors need to consider the following issues: