TRANS Asian Research Journals
http://www.tarj.in 27
P u b l i s h e d b y : T R A N S A s i a n R e s e a r c h J o u r n a l s
AJMR:
A s i a n J o u r n a l o f
M u l t i d i m e n s i o n a l
R e s e a r c h
( A D o u b l e B l i n d R e f e r r e d & R e v i e w e d I n t e r n a t i o n a l J o u r n a l )
DOES ENGINEERING USERS’ E-JOURNALS AWARENESS RELY ON
THEIR INTERNET EXPERIENCE? – A STUDY
Dr. Saravanan. T*
* Assistant Professor,
Department of Library & Information Science, Annamalai University,
Tamilnadu, India.
ABSTRACT
This paper examines the users’ bond with the Internet experience and their awareness levels of e-journals. Users’ dependency on internet increases day by day as their requirements also come up in various aspects such as preparing lessons, assignments, research etc. Either academic or personal, users are in need of modern technology to meet their requirements as present scenario offers the sophisticated opportunity to utilize these infrastructures. Study enables one to realize the modern users’ Internet experience levels as well as e- journals awareness. Though many features are covered by Internet, study includes the Digital Library related aspects only as this research falls under the discipline of LIS. Keeping this aspect in the mind study has been focused on academic users’ internet experience and various levels of awareness of e-journals. The identified research questions in the present investigation are; Do users significantly differ with regard to Internet experiences? Do users significantly differ in terms of e-journals awareness? Are there differences between Internet experiences’ pair means comparisons? Are there differences between e-journals awareness’ pair means comparisons? Do users’ Internet experiences influence them to gain awareness of e- journals?
KEYWORDS: Digital Library, Internet, engineering, online sources, e-journals.
______________________________________________________________________________
INTRODUCTION
TRANS Asian Research Journals
http://www.tarj.in 28
research. Users who are belonging to the higher education are regularly interacting with Internet and its various resources for their purposes. Awareness of Information literacy concepts and skills are essential things to the modern users in order to improving their potential in research and other areas of academy. Internet and its dependency are rising day by day. The global development of Internet features in digital libraries has generated changes in the pattern of library routines. Progressive development of Internet technology has affected the way of modern users in utilizing the electronic resources such as e-books, e-journals, e-dictionaries etc. The adoption of new technology enabled the users to access the electronic resources at the reduced price, time and energy. The massive impact of Internet and its electronic resources change the way of information seekers who are seeking information particularly in electronic environment. A study was conducted by Kidd (2002) on e-resources to trace the frequency of utilization, satisfaction etc. Palmer and Sandler (2003) found via their study that the economics faculty users preferred more electronic journals rather than other sources. Hence, an attempt has been made to investigate the modern users’ Internet experience, awareness on resources particularly e-journals and an influence of experience for gaining awareness on e-e-journals.
OBJECTIVES
The Problem objectives of this research were concerned with to measure the respondents’ Internet experience, e-journal awareness, mean differences between the groups (experience and awareness), and the level of existing relationship between their Internet experience and e-journals awareness.
METHODOLOGY
Users who are pursuing their degree in Civil, Mechanical and EEE from Sengunthar Engineering College located in Tamilnadu have been taken for the present study. In our experimental design the population range for said disciplines was traced as 180. To fulfill the structured problem objectives a well structured questionnaire was distributed to 120 users on the basis of stratified random sampling. Of them 90 filled in questionnaires were responded and taken into the account of analysis. Selecting sample is an important task in research. Hence the standard method was applied to measure the required sample size. The samples were selected for evaluation as calculated using the expected error rate, desired precision range and confidence level. Based on the said attributes the required sample size was traced as 81.5, but study had obtained 90 samples, which was more than the required sample size for further investigation. The collected samples were carefully sorted and analyzed with appropriate statistical tools.
AIM & EDGE
TRANS Asian Research Journals
http://www.tarj.in 29
HYPOTHESES
In order to face the said objectives and fulfill the structured research questions a few hypotheses have been formulated in this study. They are;
1. H0- There would be no statistically significant differences between the Internet experiences.
2. H0- There would be no statistically significant differences between the e-journals awareness.
3. H0- There is no statistically significant linear relationship between the respondents’ Internet experiences and awareness of e-journals.
4. H0-There would be no statistically significant differences between the groups of means comparisons among Internet experiences.
5. H0-There would be no statistically significant differences between the groups of means comparisons among awareness of e-journals.
ANALYSIS
TABLE 1: BRANCH-WISE DISTRIBUTION
Gini Distribution
Discipline 0.6667
Discipline Count Percent
Civil 30 33.33%
Mechanical 30 33.33%
EEE 30 33.33%
Table 1 depicts the respondents’ distribution level, which comprises Civil, Mechanical, and EEE have secured the valid percent as 33.33. Gini value indicates the positive relationship between the groups.
TABLE 2: EXPERIENCE WITH INTERNET-FREQUENCY BREAKUP
Cross-tab
Branch 1 Yr 2 Yrs Above 2 Yrs Sum
Civil 19 7 4 30
Mechanical 14 3 13 30
EEE 10 7 13 30
TRANS Asian Research Journals
http://www.tarj.in 30
TABLE 2.1: BRANCH ANALYSIS
Cross-tab
Branch 1 Yr 2 Yrs Above 2 Yrs Sum
Civil 19 7 4 30
63.33% 23.33% 13.33% 100%
Mechanical 14 3 13 30
46.67% 10.00% 43.33% 100%
EEE 10 7 13 30
33.33% 23.33% 43.33% 100%
Sum 43 17 30 90
48% 19% 33% 100%
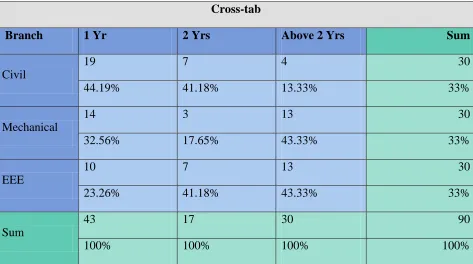
TABLE 2.2: EXPERIENCE ANALYSIS
Cross-tab
Branch 1 Yr 2 Yrs Above 2 Yrs Sum
Civil
19 7 4 30
44.19% 41.18% 13.33% 33%
Mechanical
14 3 13 30
32.56% 17.65% 43.33% 33%
EEE
10 7 13 30
23.26% 41.18% 43.33% 33%
Sum
43 17 30 90
TRANS Asian Research Journals
http://www.tarj.in 31
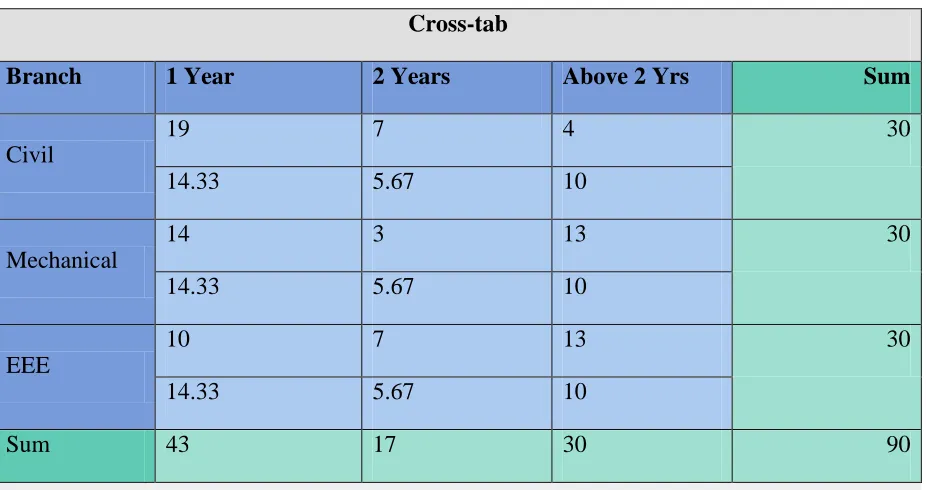
TABLE 2.3: EXPECTED VALUES
Cross-tab
Branch 1 Year 2 Years Above 2 Yrs Sum
Civil
19 7 4 30
14.33 5.67 10
Mechanical
14 3 13 30
14.33 5.67 10
EEE
10 7 13 30
14.33 5.67 10
Sum 43 17 30 90
TABLE 2.4: ONE WAY ANALYSIS OF VARIANCE RESULTS
Dependent variable is: X, Independent variable is: Net Experience
---SOURCE D.F. SS MS F PROB.>F OMEGA SQR.
---BETWEEN 2 112.67 56.33 3.21 0.11 0.33
WITHIN 6 105.33 17.56
TOTAL 8 218.00
---TABLE 2.4.1: TESTS FOR HOMOGENEITY OF VARIANCE
---Hartley Fmax test statistic = 5.06 with D.F.: 3 and 2.
Cochran C statistic = 0.51 with D.F: 3 and 2.
Bartlett Chi-square = 1.00 with 2 D.F. Prob. > Chi-Square = 0.605
---TRANS Asian Research Journals
http://www.tarj.in 32
TABLE 2.4.2: TUKEY HSD TEST FOR (DIFFERENCES BETWEEN MEANS ALPHA SELECTED = 0.05)
---Groups Difference Statistic Probability
1 - 2 8.667 q = 3.583 0.0979
1 - 3 4.333 q = 1.791 0.4618
2 - 3 -4.333 q = 1.791 0.4618
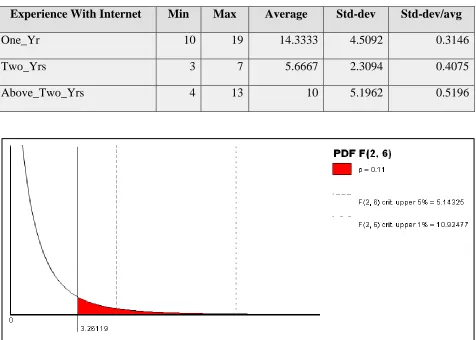
---TABLE 2.5: DESCRIPTIVE MEASURES
Experience With Internet Min Max Average Std-dev Std-dev/avg
One_Yr 10 19 14.3333 4.5092 0.3146
Two_Yrs 3 7 5.6667 2.3094 0.4075
Above_Two_Yrs 4 13 10 5.1962 0.5196
TRANS Asian Research Journals
http://www.tarj.in 33
FIGURE-B: 3D MEAN PLOT DISTRIBUTION
Respondents’ Experience with Internet could be observed from the Tables 2-2.5. Table 2.1 explores the distributions obtained for various branches namely Civil, Mechanical and EEE. In Civil discipline the maximum score (19) is traced for ‘1 Yr experience’ that indicates 63.3% of the users from Civil discipline, and 44% of users are having ‘1 Yr experience. The next highest score (7) is identified for ‘2 Yrs experience’, which represents 23% of Civil users, and 41% accounts for ‘2 Yrs experience’. The least score (4) is traced for ‘Above 2 Yrs’ that indicates 13% of users from the same discipline, and the same per cent of users are having ‘Above 2 Yrs experience’. In Mechanical discipline the maximum score (14) is traced for ‘1 Yr experience’ that indicates 46.6% of the users from the same group, and 35.5% are having ‘1 Yr experience. The next highest score (13) is identified for ‘Above 2 Yrs’, which represents 43% of Mechanical users, and the same per cent accounts for ‘Above 2 Yrs experience’. The least score (3) is traced for ‘2 Yrs’ that indicates 10% of users from the same discipline, and 17.6% of users are having ‘2 Yrs experience’. In EEE discipline the maximum score (13) is traced for ‘Above 2 Yrs’ that indicates 43% of the users from the same group, and the same per cent also accounts for ‘Above 2 Yrs experience’. The next highest score (10) is identified for ‘1 Yr’, which represents 33% of EEE users, and 23% of users have secured ‘1Yr experience’. The least score (7) is traced for ‘2 Yrs’ that indicates 23% of users from the same discipline, and 41% of users are having ‘2 Yrs experience’. The observed points alone would never help the investigators to make the inferences about the population.
TRANS Asian Research Journals
http://www.tarj.in 34
extreme. Thus, of many repetitions of this sampling design, the probability is p=>0.11 that we would be wrong when we reject the null hypothesis of no effect in favour of the alternative hypothesis that at least one pair of treatment means is different. The obtained statistical evidences indicate that there would not be a possible significance identified at the significance level of 0.05 that would be the reason for claiming support to the formulated hypothesis H1 against the alternative. Tukey HSD test was conducted to trace the differences and significance between the pairs of means of experiences at alpha level 0.05 that clearly indicates that there would be no significance statistically identified between the Internet experiences that led to claim support to the formulated hypothesis H4 against the alternative. Inferences could be clearly observed from the plot distribution (Figure-A), which has been formulated for better capture. Upper tail values for both 5% and 1% level are shown in the figure. The mean distributions for experiences have been graphically visualized in 3 dimensions towards Figure-B.
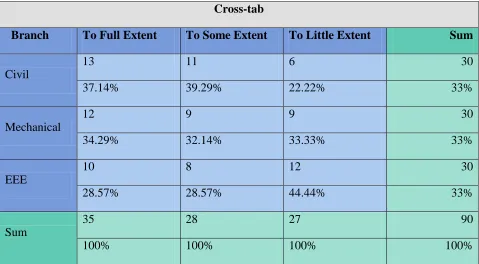
TABLE 3: AWARENESS OF E-JOURNALS-FREQUENCY BREAKUP
Cross-tab
Branch To Full Extent To Some Extent To Little Extent Sum
Civil 13 11 6 30
Mechanical 12 9 9 30
EEE 10 8 12 30
Sum 35 28 27 90
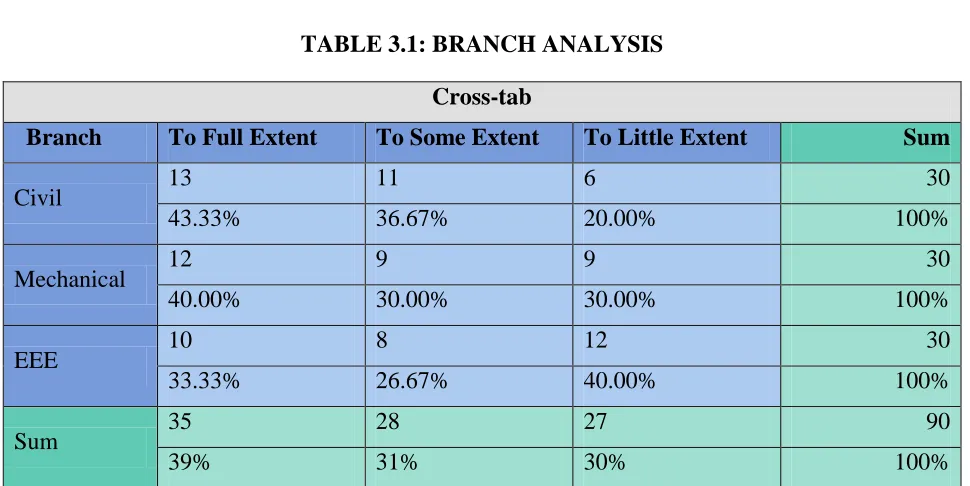
TABLE 3.1: BRANCH ANALYSIS
Cross-tab
Branch To Full Extent To Some Extent To Little Extent Sum
Civil 13 11 6 30
43.33% 36.67% 20.00% 100%
Mechanical 12 9 9 30
40.00% 30.00% 30.00% 100%
EEE 10 8 12 30
33.33% 26.67% 40.00% 100%
Sum 35 28 27 90
TRANS Asian Research Journals
http://www.tarj.in 35
TABLE 3.2: AWARENESS ANALYSIS
Cross-tab
Branch To Full Extent To Some Extent To Little Extent Sum
Civil
13 11 6 30
37.14% 39.29% 22.22% 33%
Mechanical
12 9 9 30
34.29% 32.14% 33.33% 33%
EEE
10 8 12 30
28.57% 28.57% 44.44% 33%
Sum
35 28 27 90
100% 100% 100% 100%
TABLE 3.3: EXPECTED VALUES
Cross-tab
Branch To Full Extent To Some Extent To Little Extent Sum
Civil 13 11 6 30
11.67 9.33 9
Mechanical 12 9 9 30
11.67 9.33 9
EEE 10 8 12 30
11.67 9.33 9
TRANS Asian Research Journals
http://www.tarj.in 36
TABLE 3.4: ONE WAY ANALYSIS OF VARIANCE RESULTS
Dependent variable is: X, Independent variable is: Awareness
---SOURCE D.F. SS MS F PROB.>F OMEGA SQR.
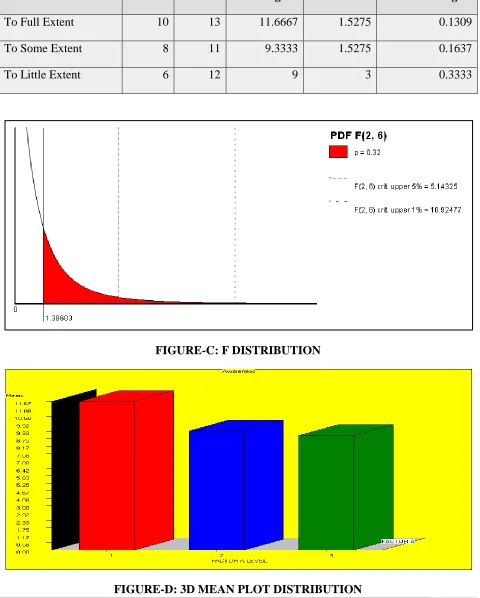
---BETWEEN 2 12.67 6.33 1.39 0.32 0.08
WITHIN 6 27.33 4.56
TOTAL 8 40.00
---TABLE 3.4.1: TESTS FOR HOMOGENEITY OF VARIANCE
---Hartley Fmax test statistic = 3.86 with deg.s freem: 3 and 2.
Cochran C statistic = 0.66 with deg.s freem: 3 and 2.
Bartlett Chi-square = 1.08 with 2 D.F. Prob. > Chi-Square = 0.584
---TABLE 3.4.2: TUKEY HSD TEST FOR (DIFFERENCES BETWEEN MEANS ALPHA SELECTED = 0.05)
---Groups Difference Statistic Probability
1 - 2 2.333 q = 1.894 0.4268
1 - 3 2.667 q = 2.164 0.3431
2 - 3 0.333 q = 0.271 0.9802
TRANS Asian Research Journals
http://www.tarj.in 37
TABLE 3.5: DESCRIPTIVE MEASURES
Attribute Min Max Average Std-dev Std-dev/avg
To Full Extent 10 13 11.6667 1.5275 0.1309
To Some Extent 8 11 9.3333 1.5275 0.1637
To Little Extent 6 12 9 3 0.3333
FIGURE-C: F DISTRIBUTION
TRANS Asian Research Journals
http://www.tarj.in 38
Tables 3-3.5 show the respondents’ distributions in multiple levels in terms of awareness of e-journals. Civil discipline respondents secured the maximum score (13), which accounts for ‘To Full Extent’ that indicates 43% of the users from Civil discipline, and 37% of users preferred the choice ‘To Full Extent’. The next highest score (11) is identified for ‘To Some Extent’, which represents 36.6% of Civil users, and 39% identified the level ‘To Some Extent’. The least score (6) is traced for ‘To Little Extent’ that indicates 20% of users from the same discipline, and 22% of the users preferred the choice ‘To Little Extent’. The maximum score (12) is traced for ‘To Full Extent’ for the discipline of Mechanical that indicates 40% of the users are belonging to the group, and 34% are preferred the level ‘To Full Extent’. Rest of the levels ‘To Some Extent’ and ‘To Little Extent’ have equally shared the same score (9), which represent 30% of the respondents, who are from Mechanical discipline. However, 33% of the respondents preferred the awareness level ‘To Little Extent’ where as 32% of the respondents are accounted for the level ‘To Some Extent’. In EEE discipline the maximum score (12) is traced for ‘To Little Extent’ that indicates 40% of the users from the same group, and 44% of the users vouched for ‘To Little Extent’. The next highest score (10) is identified for ‘To Full Extent’, which represents 33% of EEE users, and 28.5% of users preferred the choice ‘To Full Extent’. The level To Some Extent’ received the least score (8) that indicates 26.6% of users from the same discipline, and 28.5% of users are associated with the level To Some Extent’.
TRANS Asian Research Journals
http://www.tarj.in 39
FIGURE-1: SCATTER PLOT DISTRIBUTION
LINEAR CORRELATION
TEST RESULT 1
Y X r r² t Pr(>|t|)
TFE One_Yr 0.9679 0.9368 3.849 0.1618
The results obtained from the Correlation Test, which was opted to trace the relationship between the selected variables, indicates the positive value along with the strong linear relationship. However, author does not have enough statistical evidences to claim support to the alternative against the formulated hypothesis three (H3). Figure -1 Plots the combinations of two variables namely ‘To Full Extent’ and ‘1 year Experience’ against one another.
TEST RESULT 2
Y X r r² t Pr(>|t|)
TSE One_Yr 0.9921 0.9842 7.8905 0.0803
Correlation Analysis was used to trace the linear relationship between the selected variables. Test result indicates the positive value and statistically strong linear relationship was found between the variables. However, with the help of enough statistical evidences it is inferred that there
13.0
11.5
10.0
19.0
14.5
10.0
10.0 13.0
10.0 19.0
One Year
To Full Extent
TRANS Asian Research Journals
http://www.tarj.in 40
would not be a possible significance statistically identified to claim support to the alternative against the formulated hypothesis three (H3). Figure -2 Plots the combinations of two variables namely ‘To Some Extent’ and ‘1 year Experience’ against one another.
FIGURE-2: SCATTER PLOT DISTRIBUTION
TEST RESULT 3
Y X r r² t Pr(>|t|)
TLE One_Yr -0.9979 0.9959 -15.5885 0.0408
Correlation Test result 3 explores the outcome of the two variables that depicts the type of relationship, which is occurred in between them. The test result indicates the negative and weak relationship between the variables. However, with the help of weak statistical evidences it is inferred that there would be a possible significance statistically identified to claim support to the alternative against the formulated hypothesis three (H3). Figure -3 Plots the combinations of two variables namely ‘To Little Extent’ and ‘1 year Experience’ against one another.
11.0
9.50
8.00
19.0
14.5
10.0
8.00 11.0
10.0 19.0
One Year
To Some Extent
TRANS Asian Research Journals
http://www.tarj.in 41
FIGURE-3: SCATTER PLOT DISTRIBUTION
TEST RESULT 4
Y X r r² t Pr(>|t|)
TFE Two_Yrs -0.189 0.0357 -0.1925 0.879
Correlation analysis was applied to find out the linear relationship between the selected variables. Test result indicates the negative and weak relationship between the variables. With the help of enough statistical evidences it is inferred that there would not be a possible significance statistically identified to claim support to the alternative against the formulated hypothesis three (H3). Figure -4 Plots the combinations of two variables namely ‘To Full Extent’ and ‘2 years Experience’ against one another.
12.0
9.00
6.00
19.0
14.5
10.0 6.00 12.0
10.0 19.0
One Year
To Little Exten
TRANS Asian Research Journals
http://www.tarj.in 42
FIGURE-4: SCATTER PLOT DISTRIBUTION
TEST RESULT 5
Y X r r² t Pr(>|t|)
TSE Two_Yrs 0.189 0.0357 0.1925 0.879
It is clear from the Test result 5 that there is a weak relationship exists and also no significance statistically identified between the variables. With the help of enough statistical evidences it is inferred that there would not be a possible significant statistically identified to claim support to the alternative against the formulated hypothesis three (H3). Figure -5 Plots the combinations of two variables namely ‘To Some Extent’ and ‘2 years Experience’ against one another.
13.0
11.5
10.0
7.00
5.00
3.00 10.0 13.0
3.00 7.00
Two Years
To Full Extent
TRANS Asian Research Journals
http://www.tarj.in 43
FIGURE-5: SCATTER PLOT DISTRIBUTION
TEST RESULT 6
Y X r r² t Pr(>|t|)
TLE Two_Yrs 0 0 0 1
Correlation Analysis helps to measure the linear relationship between the selected variables. Test result indicates the null relationship and no significance statistically identified between the variables. With the help of enough statistical evidences it is inferred that there would not be a possible significant statistically identified to claim support to the alternative against the formulated hypothesis three (H3). Figure -6 Plots the combinations of two variables namely ‘To Little Extent’ and ‘2 years Experience’ against one another.
11.0
9.50
8.00
7.00
5.00
3.00 8.00 11.0
3.00 7.00
Two Years
To Some Extent
TRANS Asian Research Journals
http://www.tarj.in 44
FIGURE-6: SCATTER PLOT DISTRIBUTION
TEST RESULT 7
Y X r r² t Pr(>|t|)
TFE Above_Two_Yrs -0.7559 0.5714 -1.1547 0.4544
Correlation Test results 7 show the obtained statistic values for the selected variables. The test result indicates a weak and negative relationship between the variables. With the help of enough statistical evidences it is inferred that there would not be a possible significant statistically identified to claim support to the alternative against the formulated hypothesis three (H3). Figure -7 Plots the combinations of two variables namely ‘To Full Extent’ and ‘Above 2 years Experience’ against one another.
12.0
9.00
6.00
7.00
5.00
3.00 6.00 12.0
3.00 7.00
Two Years
To Little Extent
TRANS Asian Research Journals
http://www.tarj.in 45
FIGURE-7: SCATTER PLOT DISTRIBUTION
TEST RESULT 8
Y X r r² t Pr(>|t|)
TSE Above_Two_Yrs -0.9449 0.8929 -2.8868 0.2123
The linear relationship between the variables is identified by way of using the test Correlation Analysis, and the results indicate the negative relationship. Further no significance is identified in between them. With the help of enough statistical evidences it is inferred that there would not be a possible significant statistically identified to claim support to the alternative against the formulated hypothesis three (H3). Figure -8 Plots the combinations of two variables namely ‘To Some Extent’ and ‘Above 2 years Experience’ against one another.
13.0
11.5
10.0
13.0
8.50
4.00 10.0 13.0
4.00 13.0
Above Two years
To Full Extent
TRANS Asian Research Journals
http://www.tarj.in 46
FIGURE-8: SCATTER PLOT DISTRIBUTION
TEST RESULT 9
Y X r r² t Pr(>|t|)
TLE Above_Two_Yrs 0.866 0.75 1.7321 0.3333
Correlation Test results 9 depict the statistic calculations for the obtained variables. Test result indicates the strong relationship between the variables. However, with the help of enough statistical evidences it is inferred that there would not be a possible significant statistically identified to claim support to the alternative against the formulated hypothesis three (H3). Figure -9 Plots the combinations of two variables namely ‘To Little Extent’ and ‘Above 2 years Experience’ against one another.
11.0
9.50
8.00
13.0
8.50
4.00 8.00 11.0
4.00 13.0
Above Two years
To Some Extent
TRANS Asian Research Journals
http://www.tarj.in 47
FIGURE-9: SCATTER PLOT DISTRIBUTION
ANSWERS TO THE FORMULATED RESEARCH QUESTIONS
S.No. Research Questions Answer
1. Do users significantly differ with regard to Internet experiences?
No
2. Do users significantly differ in terms of e-journals awareness?
No
3. Are there differences between Internet experiences’ pair means comparisons?
No
4. Are there differences between e-journals awareness’ pair means comparisons?
No
5. Do users’ Internet experiences influence them to gain awareness of e- journals?
No. However, I am uncertain about the test result 3 due to the weak evidence.
12.0
9.00
6.00
13.0
8.50
4.00
6.00 12.0
4.00 13.0
Above Two years
To Little Extent
TRANS Asian Research Journals
http://www.tarj.in 48
HYPOTHESES TEST RESULTS
ANOVA TEST
S.No. Table Hypothesis Status
1. 2 1 Accepted
2. 3 2 Accepted
TUKEY HSD TEST
S.No. Table Hypothesis Groups Status
1. 2.4.2 4 1-2 (1 Yr Vs 2 Yrs.) Accepted
2. 2.4.2 4 1-3 (1 Yr Vs >2 Yrs.) Accepted
3. 2.4.2 4 2-3 (2 Yr Vs 3 Yrs.) Accepted
4. 3.4.2 5 1-2 (TFE Vs TSE) Accepted
5. 3.4.2 5 1-3 (TFE Vs TLE) Accepted
6. 3.4.2 5 1-2 (TSE Vs TLE) Accepted
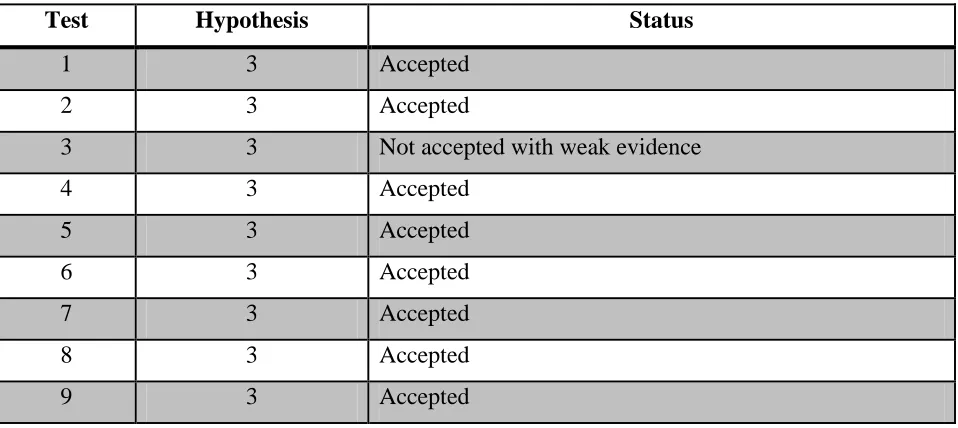
CORRELATION TEST
Test Hypothesis Status
1 3 Accepted
2 3 Accepted
3 3 Not accepted with weak evidence
4 3 Accepted
5 3 Accepted
6 3 Accepted
7 3 Accepted
8 3 Accepted
TRANS Asian Research Journals
http://www.tarj.in 49
FINDINGS AND CONCLUSIONS
TRANS Asian Research Journals
http://www.tarj.in 50
relationship between the levels of the variables and no significance was statistically identified in between them. However, the last levels of both the variables have received strong linear relationship as the two variables were joint together increased. Though linear relationship was identified there would be no possible significance was statistically identified in between them for all the levels. Hence, It is inferred that with the help of enough statistical evidences we fail to claim support to the alternative in favor of the formulated hypothesis three (H3). Though some of the strong/weak relationships were identified between the variables thorough out the study the possible significance was not captured in between the levels of the variables except a few levels. However, these estimates may vary over repeated samples of data.
Further Movements: Researchers may step up to unfold the respondents’ e-journals access behaviors by using different categories of e-journals that are associated to the respondents’ disciplines. Further, respondent’s academic performances dependency on those resources may also be cross tabulated for further analysis in order to draw the inferences.
REFERENCES
1. Kidd, T, 2002, ‘Electronic Journal usage statistics in practice’, Serials, vol.15, no. 1, pp.11-17.
2. Palmer, J.P. and Sandler, M, 2003, ‘What do faculty want?’,Net connect, pp.26-28.
3. Ricco RAKOTOMALALA, 2005, ‘Tanagra:Un logiciel gratuity pour l’ense I -gne ment et la recherché”.in Actes de EGC’, RNTI-E-3,vol.2, pp.697-702.
4. Rojer Stern et al., Introduction to Instat plus, available from <http://www.rdg.ac.uk> [03 Nov 2012].
5. Saravanan, T et al, 2010, ‘Google Use and Users: A Survey’, Information Studies, vol.16, no.1, pp.49-64.
6. Saravanan,T et al, 2011, ‘Higher Education User’s Awareness of Google: Searching for Structure’, Library Progress (International), vol.31, no.1, pp.91-97.
7. Saravanan, T et al, 2011, ‘Does internet gear up the users’ awareness of E-Books?’, SRELS, vol. 48, no.6, pp.597-616.
8. Saravanan, T et al, 2011, ‘Does internet literacy regulate the users’ online databases access skills?’, IJAR, vol.1, no.3, pp.132-134.
9. Saravanan, T et al, 2012, ‘Internet and its Users in Higher Educational Sector’, Information Studies, vol.18, no.1, pp.41-68.
10.Sticker, D, Decision Visualizer 2006. Available from: <http://www.brightstat.com> [03 Nov 2012].