PLANTS (
TRITICUM AESTIVUM
(L).)
IRON STRESS IN WHEAT
Laxmi Verma1 and Nalini Pandey2 1,2
Plant Nutrition and Stress Physiology Laboratory, Botany Department, University of Lucknow, Lucknow 226007
Abstract
Wheat plants (Triticum aestivum L. var. DBW 17) exposed to different concentration of iron(10, 100, 200, 400 µM Fe) in the form of FeEDTA under controlled glass house conditions were quantified for different physiological parameters and antioxidative enzymes as well as antioxidant compounds. At 40 and 60 days of exposure the plants were harvested and growth, active Fe content, lipid peroxidation enzymes and metabolites of the antioxidative metabolism were determined. Plants showed maximum growth at 100 µM Fe supply and this level was treated as control. At 10 µM Fe plants shoewd maximum reduction in growth and choruses in young leaves. Excess of Fe also caused significant inhibition of growth and induced bronzing of older leaves. High concentration of TBARS (indicated lipid peroxidation) and H2O2 content in leaves were detected in Fe deficient and Fe toxic
plants (10, 200 and 400 µM Fe) as compared to control. The activities of Fe containing enzymes such as speroxide dismutase (SOD), catalase (CAT), peroxidase (POD) and ascorbate peroxidase (APX) increased with increasing Fe concentration at 40 DAT. A significant enhancement in the activity of GR was also observed with increasing Fe concentration at 40 DAT but the activity of GR as also that of POD and APX reduced at 60 DAT. The ascorbate (ASA) and non- protein thiol (NPT) content in general increased with increasing Fe concentration. The results indicate that under Fe stress condition plants suffer increased oxidative damage, which is regulated by change in the activities of antioxidative enzymes and the contents of the antioxidants ASA and NPT.
Key words: Antioxidant enzymes, wheat, Fe stress, oxidative damage, reactive oxygen species (ROS).
I. INTRODUCTION
Iron is one of the essential micronutrient for plants (Barber, 1984). In the soil iron is the fourth abundant element on earth, but its unavailability for the plants and microorganism is, due to low solubility of minerals which contain iron. Iron is absorbed by the plants in soil when it is converted from
insoluble ferric (Fe3+) form to a ferrous (Fe2+) form. Due to its ability to accept and donate electrons, it
behaves as a cofactor for many enzymes involved in plant metabolism especially nitrogen and sulfur
metabolism, such as nitrate reductase, nitrite reductase, sulfite reductase, and nitrogenase, which use iron-containing prosthetic groups (Briat et al., 2007; Ha¨nsch and Mendel 2009).
Iron can also be toxic at high concentration. Homeostasis of Fe is essential for plant growth and development, as it causes harm in both excessive and limiting amounts. The ability of iron to accept and donate electrons indicates that if iron is free within the cell. It can catalyze the conversion of hydrogen peroxide in to free radicals, which cause the damage to a wide variety of cellular structures (Jucoski et al., 2013). Thus via the Fenton reaction it generates hydroxyl radicals which can damage lipids, proteins and DNA. Iron toxicity is the most widespread nutritional disorder that affects wetland rice production (Dorlodot et al., 2005), by causing severe impairment in rice photosynthesis (Pereira et al., 2013).
Protection strategies against iron stress within the plant may involve enzymatic and non enzymatic mechanisms that include the actions of antioxidant enzymes. The first enzyme playing a defensive role against the damage caused by ROS is superoxide dismutase (SOD), which requires Fe, Mn, Cu, and Zn as metal cofactors. SOD is found in several cellular compartments and catalyzes the
detoxification of O2 _- to H2O2 and O2 (Sinha and Saxena 2006). In addition to SOD, catalases (CAT)
and peroxidases have been shown to participate in this protective mechanism (Chandra and Pandey, 2014). These enzymes also contain iron as cofactor, thus both deficiency and toxicity of iron would affect the oxidative metabolism. The aim of this work is to evaluate the effect of iron on the oxidative metabolism in wheat plants at varying concentrations and at different growth stages.
II. MATERIALS AND METHODS
Wheat (Triticum aestivum L. var. DBW 17) plants were grown under glasshouse conditions in
acidpurified silica sand in polyethylene pots with a central drainage hole covered with glass wool under
an inverted watch glass that allowed free drainage. The nutrient solution contained 4 mM Ca(NO3)2,4
mM KNO3, 2 mM MgSO4, 1.33 mM NaH2PO4, 0.33 mM H3BO3, 1.0 μM ZnSO4, 10 μM MnSO4, 1.0
μM CuSO4, 0.1 μM Na2MoO4, 0.1 mM NaCl, 0.1 μM CoSO4, 0.1 μM NiSO4, and Fe supplied at four
levels (10, 100, 200 and 400 μM Fe) in the form of Fe EDTA. Nutrient solution containing Fe was supplied six days a week after emergence of first leaf. At the week end, pots were flushed with glass
distilled water to avoid accumulation of nutrients in the rooting medium. For each treatment, there were
three pots, each containing five plants. Forty days after treatment (DAT), when leaves of plants grown
with 10 μM and 400 µM Fe displayed initial symptoms of iron deficiency and toxicity respectively, and
at 60 days of growth when symptoms become more pronounced, plant biomass and Fe concentration in
leaves were determined. Simultaneously, the terminal (2-3) leaves were assayed for total active-Fe and leaf tissue concentration of iron along with chlorophylls (Chl) a and b, carotenoid, hydrogen peroxide
(H2O2), thiobarbituric acid reactive substances (TBARS), ascorbate (Asc), non protein thiol (NPT), and
activity of superoxide dismutase (SOD), catalase (CAT), peroxidase (POD), ascorbate peroxidase (APX), and glutathione reductase (GR).
Plants were separated into roots, stem and leaves, and total biomass was determined by oven drying (70°C) the samples. The tissue Fe concentration determined in roots, stem and fully expanded terminal trifoliate leaves was determined by atomic absorption spectrophotometer (Perkin Elmer A
Analyst 300) in wet acid HNO3 : HClO4 (10 : 1) digests. Chlorophyll (a + b) and Carotenoids were
extracted with 80% acetone and measured spectrophotometrically (Perkin Elmer UV/VIS Lambda Bio 20) as described by method of Lichtenthaler, (1987). Total active-Fe content in leaves was measured following the method of Mehrotra et al., (1985).
Ascorbate was extracted with 10% trichloroacetic acid (TCA) and assayed according to Law et
al., (1983) by following the reduction of Fe3= to Fe2+ by ascorbic acid and measuring the color intensity
of the Fe2+ - α, α bipyrridyl complex at 525 nm. Non-protein thiols were estimated by the method of
Lipid peroxides were measured in terms of thiobarbituric acid reactive substances (TBARS) as described by Heath and Packer, (1968). Fresh leaf material was extracted with 1% trichloroacetic acid. The supernatant was centrifuged at 10000 g for 10 min and treated with 0.5% thiobarbituric acid dissolved in TCA. The reaction mixture was incubated in boiling water bath for 30 min and TBARS were measured spectrophotometrically at 532 nm after adjusting for non-specific absorbance at 600 nm. Hydrogen peroxide was estimated by the method of Brennan and Frenkel, (1977). Freshly chopped leaf tissues were ground in chilled mortar pestle with 100% chilled acetone and centrifuged at 10000 g for 5 min. The supernatant was mixed with water and shaken thoroughly. To the supernatant titanium chloride was added followed by chilled ammonia. The precipitate was solubilized with the help of thin glass rod and centrifuged. The residue was washed repeatedly with acetone to remove chlorophyll. The colorless
residue was dissolved in 2N H2SO4. The color intensity was read at 415 nm.
Catalase (CAT) and peroxidase (POD) were extracted by homogenization of the fresh leaf tissue in ice cold distilled water (1:10) with a chilled mortar and pestle. The reaction mixture for CAT enzyme assayed by the method of Euler and Josephson, (1927) contained 0.005 M hydrogen peroxide in 0.025
mM potassium phosphate buffer (pH 7.0) and was standardized against 0.1 N KMnO4.The reaction was
started by adding 1 ml of the suitably diluted enzyme extract. After 5 min, the reaction was stopped by
adding 2 ml of 2 N H2SO4. Unused hydrogen peroxide in the reaction mixture was titrated against 0.1N
KMnO4.The reaction mixture for POD assayed by the method of Luck, (1963) which contained 2 ml of
0.1 M phosphate buffer (pH 6.0), 1 ml of 0.01% H2O2 and 1 ml of 0.5% p-phenylenediamine. The
reaction was initiated by adding 1 ml of the enzyme extract to the above mixture and was allowed to
proceed for 5 min. The reaction was stopped by adding 4N H2SO4.
For assay of SOD, APX and GR fresh leaf tissue was ground in 50 mM potassium phosphate
buffer (pH 7.0), containing EDTA (1 mM) and PVP (2%) The extracts were centrifuged at 15000 g for 10 min, and the supernatant was assayed for the enzyme activities. Total SOD was assayed by monitoring the inhibition of photochemical reduction of nitroblue tetrazolium (NBT) in 3 ml reaction mixture (Beuchamp and Fridovich, 1971), containing 50 mM phosphate buffer (pH 7.0), 0.13 mM methionine, 75 μM NBT, 2 μM riboflavin, 0.1 mM EDTA, and 25 μl of the enzyme extract and read at 560 nm. One unit of enzymes is defined as the amount of enzyme causing 50% inhibition of NBT reduction. For determining APX activity as per the method of Nakano and Asada, (1981), the reaction mixture contained 50 mM potassium phosphate buffer (pH 7.0), 0.5 mM ascorbate, and 0.1 mM
H2O2.The enzymatic activity was assayed by following oxidation of ascorbate at 290 nm. Estimation of
GR was carried out by following oxidation of NADPH and monitoring a decrease in absorbance at 340 nm per min as described by Jablonski and Anderson, (1978) in a reaction mixture containing 100 mM phosphate buffer (pH 7.0), 1 mM oxidized glutathione (GSSG), 1.0 mM EDTA, 0.1 mM NADPH, and 25 to 50 μl of the enzyme extract. The reaction mixture was kept in a refrigerator for 20 min and then centrifuged at 4000 g. The color intensity was read at 485 nm. Enzyme activities have been expressed on the basis of total soluble proteins in the enzyme preparations, as determined by the dye binding method of Bradford, (1976).
All measurement was made on samples drawn in triplicate and the data were statistically analysed (ANOVA) for significance (LSD at P= 0.05). The data in figures are presented as bar diagram of mean values ± standard error (SE, n=3).
III. RESULTS AND DISCUSSION
iron. Leaf chlorosis is developed in plants supplied with 10 µM Fe. Whereas plants receiving 200 and 400 µM Fe supply developed toxicity symptoms which were mainly characterized by leaf chlorosis followed by bronzing of older leaves and root darkening that become visible 40 DAT. The toxicity symptoms for iron were similar to those observed by Sahrawat, (2004), Dorlodot et al., (2005) and Becker and Asch, (2005). The reduction in dry matter production in the roots stem and leaves increased with deficient and toxic Fe concentration and time of exposure to the plants. The total dry weight of the iron deficient wheat plants were almost half that of control plants. Plants subjected to iron toxicity, at the 200 and 400 µM Fe concentration also showed reduction in the total DM being upto 25 % (Table 1.) of control plants. Similar results also found by Nenova, (2006) in the pea plants and Chatterjee et al., (2006) in potato plants. Maximum accumulation in iron was observed in roots > leaves > stem in all treatments. An increase in iron supply from 10 to 400 µM caused an increase in concentration of iron in
leaf tissue from 28.18 to 489.0 µg Fe g-1 dry wt. Optimum growth was observed in plants containing
117.0 µg Fe/g dry wt in leaves at 40 DAT (Table 1.). At 60 DAT Fe deficient plants had 31.16 µg Fe and 557 µg Fe in leaves of 400 µM Fe plants. Similar results were observed by Dorlodot et al., (2005). Presented data (Table.1) shows that active Fe content in the leaves ranged from 28.11 (deficient Fe) to 447 µg Fe at 40 DAT and from 40.69 to 563 µg Fe at 60 DAT.
Table-1: Effect of iron treatment on the dry matter yield, tissue iron and total active Fe, in wheat (Triticum aestivum (L) plant.
Days after treatment
Plant part
µM iron supply LSD
(P=0.05)
10 100 200 400
Dry matter yield: g plant-1
40 Leaves 0.215±0.011 0.391±0.022 0.250±0.012 0.241±0.011 0.063
Stem 0.152±0.012 0.270±0.015 0.198±0.032 0.191±0.026 0.086
Root 0.107±0.024 0.186±0.060 0.154±0.054 0.137±0.024 0.009
Whole plant
0.474±0.009 0.847±0.023 0.602±0.012 0.569±0.021 0.123
60 Leaves 0.395±0.009 0.787±0.033 0.517±0.023 0.423±0.032 0.021
Stem 0.198±0.024 0.479±0.019 0.377±0.045 0.309±0.014 0.057
Root 0.152±0.021 0.308±0.011 0.240±0.009 0.198±0.015 0.042
Whole plant
0.745±0.022 1.574±0.021 1.134±0.013 0.930±0.033 0.136
Tissue iron: µg g-1dry wt.
40 Leaves 28.18±2.84 117.0±2.02 263.0±3.21 489.0±1.16 3.29
Stem Root 24.04±1.28 43.30±1.54 105.0±2.09 127.0±2.19 229.0±1.36 287.0±1.54 456.0± 1.53 506.0±1.56 2.76 4.46
60 Leaves 31.16±1.67 156.0±3.19 289.0±1.99 557.0±2.02 2.97
Stem Root 30.01±2.84 43.17±1.46 129.0±1.34 172.0±2.35 267.0±1.34 354.0±2.98 504.0±2.25 596.0±2.09 3.45 4.98
Total active Fe: mg kg-1 f. wt.
40 60 Leaf Leaf 28.1±2.65 40.6±4.36 98.5±3.41 149±5.98 247±2.73 356±3.68 447±4.88 563±2.11 5.73 6.27
deficiency than excess in which decrease was marginal (Fig.1). Chatterjee et al., (2006) and Pereira et al., (2013) also reported a decrease in chlorophyll content with change in iron concentration. This is due to the role of iron on pigment synthesis (Miller et al.,, 1995; Eskandari, 2011). Carotenoid act as a important metabolites that aid in protecting the cellular and subcellular system from the cytotoxic effects of reactive oxygen species (Agarwal et al., 2006) by quenching the singlet oxygen. A decrease in carotenoid content was also observed in iron stressed wheat plants, and this is indicative of oxidative stress.
Fig. 1: Effect of iron treatment on concentration of chlorophyll, carotenoids, hydrogen peroxide (H2O2),
and thiobarbituric acid reactive substances (TBARS) in the leaves of wheat plants. Bars indicates ± S.E.
of three independent values. * indicates significant differences compared to control at P=0.05.
Lipid peroxidation is a good indication of oxidative damage which can be measured in terms of TBARS. In the present study, oxidative damage in iron stressed plant was apparent due to
accumulation of TBARS and H2O2. The content of lipid peroxidation and H2O2 increased in iron
deficient and excess plants with increase in exposure time to iron treatments (Fig 1). The increase in
TBARS and H2O2 was most in plants receiving 400 µM Fe. In the aerobic cells the hydroxyl radicals are
known to be formed from H2O2 in the presence of transition metal ions like iron, copper, zinc etc
(Elestner, 1982; Halliwell and Gutteridge, 1999). The accumulation of TBARS is an indicator of free radical production and consequent tissue damage (Sinha and Saxena, 2006), which is induced by toxic concentration of iron. Under iron stress enhanced lipid peroxidation has been reported in different plants and has been associated with oxidative stress (Souza Santos et al., 2001; Stein et al., 2008; Xing et al., 2010)
Our results are also in agreement with Jucoski et al., (2013) who found marked increase in GSH content in Euglena uniflora under iron toxicity.
Fig. 2: Effect of iron treatment on concentration of non-protein thiols, ascorbate and ratio of AA/DHA
in the leaves of wheat plants. Bars indicates ± S.E. of three independent values. * indicates significant
differences compared to control at P=0.05.
Ascorbate (ASC) is an electron donor that can be oxidized to the radical monodehydroascorbate (MDHA) and this compound can then form dehydroascorbate (DHA). Ascorbate (ASA) is a major antioxidant metabolite involved in the detoxification of ROS during oxidative stress in plants (Noctor and foyer 1998; Gill and Tuteja, 2010). It can either eliminate hydrogen peroxide directly or it also can
be used by the enzyme APX as a reduced substrate. It has an important role in the regeneration of α
-tocopherol and certain carotenoids (Potters et al., 2002). The ascorbate content was also increased at 40 DAT by increasing the concentration of Fe, but 60 DAT the values of ascorbate content in 200 and 400 µM Fe was decreased. The AA/DHA ratio increased by increasing the concentration of Fe. However at 60 DAT a decrease in the AA/DHA ratio was found in 100 and 400 µM Fe as compared to control plants (Fig. 2). A decrease in the AA/DHA shows an imbalance in the redox state of the cell. Thus Fe toxicity affects become enhanced and totally disturb the oxidative status in the plants. This is also
reflected by above mentioned increase in TBARS and H2O2 concentration. The AA/DHA ratio is
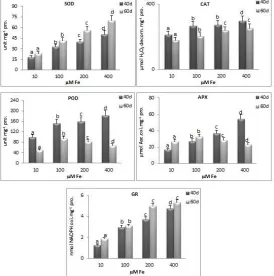
The SOD activity of wheat plants increased after treatment with high iron supply (Fig. 3). A significant increase in the SOD activity was detected after the 40 DAT of treatment and increased with increasing the time of exposure and iron supplyin the nutrient solution. This activity was 80 and 92 % higher in plants with 200 and 400 µM Fe EDTA respectively compared with the control plants.
Fig. 3: Effect of iron treatmentonactivity of SOD (superoxide dismutase), CAT (catalase), POD (peroxidase), APX (ascorbate peroxidase) and GR (glutathione reductase) in leaves of wheat plants.
Bars indicates ± S.E. of three independent values. * indicates significant differences compared to control
at P=0.05.
Increasing SOD activity under iron toxicity has been also observed in plant species, such as wheat (Li et al., 2012) rice (Stein et al., 2008) and tobacco (Kampfenkel et al., 1995), However (Neves
et al., 2009) observed a decrease in the activity of SOD enzyme in the leaves of E. uniflora. SOD
constitutes the first line defence enzyme that catalyzes the dismutation of superoxide anion (Gill and Tuteja, 2010) and it is one of the most important enzyme in the cell defense against the oxidative stress (Foyer and Noctor, 2000; Alscher et al., 2002; Apel and Hirt 2004). SOD is a key enzyme which
catalyses the dismutation of O2.- and its enzymatic action results in the formation of H2O2 and O2. POD
decomposes H2O2, by the oxidation of co- substrates, such as phenolic compounds and antioxidants,
whereas CAT breaks down H2O2 into H2O and O2 (Mittler, 2002). CAT, POD and APX are important
H2O2 detoxifying enzymes in plant system. These are all iron containing enzymes. The activity of
catalase enzyme increased with increasing the concentration of iron up to 40 DAT. The increase in CAT
activity due to high concentration of iron has also been observed in some other plant species like Bacapa
response to toxic levels of iron has been also observed in Solanum tuberosum (Chatterjee et al., 2006) and tea (Hemalatha and Venkatesan, 2011).
The activity of GR increased with increasing the concentration of iron from 10 µM to 400 µM at 40 DAT (Fig. 3). However the activity of GR was almost half at 60 DAT than that at 40 DAT. Glutathione reductase is a key enzyme of the AA/ GSH cycle which is responsible for the reduction of
oxidized glutathione for the chain reaction of scavenging H2O2 by APX and GPX to be completed and
continued (Mittler. 2002; Apel and Hirt, 2004). A decrease in the GR activity at the later stages would result in the redox imbalance of the cell, which would not be able to cope with the oxidative damage. The results of the present study demonstrate that iron deficiency and toxicity in wheat plants induced drastic decrease in plant growth accompanied with changes in some parameters which was indicative of oxidative stress for example generation of ROS and lipid peroxidation. Under the experimental condition the iron stressed plants exhibit a complex defense mechanism which is composed of antioxidative enzymes and low molecular weight antioxidants in response to harmful effects of reactive oxygen species production. However these are not able to overcome the oxidative damage with prolonged deficiency and toxicity of iron.
BIBLIOGRAPHY
[1] Agarwal, S.; Sairam, R.K.; Meena, R.C.; Tyagi, A. and Srivastava, G.C., (2006). Effect of excess and deficient levels of iron and copper on oxidative stress and antioxidant enzymes activity in wheat. J. Plant Sci., 1: 86-97.
[2] Alscher, R.G.; Erturk, N.; Heath, L.S. (2002). Role of superoxide dismutases (SODs) in controlling oxidative stress in plants. J. Exp Bot., 53: 1331-1341.
[3] Apel, K. and Hirt, H. (2004). Reactive oxygen species: metabolism, oxidative stress, and signal transduction. Annu Rev
Plant Bio., 55: 373–399.
[4] Barber, S.A. (1984). Soil nutrient bioavailability: A Mechanistic Approach. Wiley-Interscience. New York, 382-409.
[5] Beauchamp, C. and Fridovich, I. (1971). Superoxide dismutase: Improved assays and an assay applicable to
acrylamide gels. Anal Biochem., 44: 276-287.
[6] Becker, M. and Asch, F. (2005). Iron toxicity in rice – conditions and management concepts. J. Plant Nutr. Soil Sci.,
168: 558–573.
[7] Brennan, T. and Frenkel, C. (1977). Involvement of Hydrogen Peroxide in the Regulation of Senescence in Pear. Plant
Physiology, 59: 411-416.
[8] Bradford, M.M. (1976). A rapid and sensitive method for the quantification of microgram quantities of protein utilizing the principles of protein-dye binding. Anal. Biochem., 72: 248-254.
[9] Briat, J.F.; Curie, C.; Gaymard, F. (2007). Iron utilization and metabolism in plants. Curr Opin Plant Biol, 10: 276– 282. [10]Chandra, N and Pandey, N. (2014). Sulphur stress-induced antioxidative responses in leaves of Triticum aestivum L.
Acta Phsiol Plant, 36: 2079-2089.
[11]Chatterjee, C.; Gopal, R.; Dube, B.K. (2006). Impact of iron stress on biomass, yield, metabolism and quality of potato (Solanum tuberosum L.). Sci Hortic, 108:1–6.
[12]Dorlodot, S.; Lutts, S.; Bertin, P. (2005). Effects of ferrous iron toxicity on the growth and mineral composition of an interspecific rice. Journal of Plant Nutrition, 28: 1-20.
[13]Ellman, G.L. (1959). Tissue sulphydryl groups. Arch. Biochem. Biophys., 82: 70-77.
[14]Elstner, E.F. (1982). Oxygen activation and oxygen toxicity. Annu. Rev. Plant Physiol., 33: 73-96.
[15]Eskandari, H. (2011). The importance of iron (Fe) in plant products and mechanism of its uptake by plants. J. Appl. Environ. Biol. Sci., 1(10): 448-452.
[16]Euler, H.; Von and Josephson, K. (1927). Uber Katalase I. Leibigs Ann., 452: 158-181.
[17]Foyer, C.H. and Noctor, G. (2000). Oxygen processing in photosynthesis: regulation and signaling. New Phytol., 146: 359-388.
[18]Gill, S.S. and Tuteja, N. (2010). Reactive oxygen species and antioxidant machinery in abiotic stress tolerance in crop plants. Plant Physiol. Biochem, 48: 909-936.
[19]Halliwell, B. and Gutteridge, J.M.C. (1999). Free Radicals in Biology and Medicine. 4th ed. Oxford University Press, New York.
[20]Ha¨nsch, R. and Mendel, R.R. (2009). Physiological functions of mineral micronutrients (Cu, Zn, Mn, Fe, Ni, Mo, B, Cl). Curr Opin Plant Biol, 12:259–266.
[22]Hemalatha, K. and S. Venkatesan. (2011). Impact or iron toxicity on certain enzymes and biochemical parameters of tea. Asian J Biochem., 6: 384-394.
[23]Jablonski, P. B. and Anderson J. W. (1978). Light dependent reduction of oxidized glutathione by ruptured chloroplasts. Plant Physiol., 61, 221-225.
[24]Jucoski, G. de O., J. Cambraia, C. Ribeiro, J.A.de Oliveira, S.O. de Paula, M.A. Oliva. (2013). Impact of iron toxicity on oxidative metabolism in young Eugenia uniflora L. plants. Acta Physiol Plant., 35: 1645-1657.
[25]Kampfenkel, K. and V. Montagu. (1995). Effects of iron excess on Nicotiana plumbaginifolia plants (implications to oxidative stress). Plant Physiol., 107: 725-735.
[26]Law, M.Y.; Charles, S.A. and Halliwell, B. (1983). Glutathione and ascorbic acid in spinach (Spinacia oleracea) chloroplasts. The effect of hydrogen peroxide and of paraquat. Biochem. J., 210: 899-903.
[27]Lichtenthaler, H.K. (1987). Chlorophylls and carotenoids: pigments of photosynthetic biomembranes, In: Methods in
Enzymology. (Eds: L. Packer and R. Douce). Academic Press, New York. 148.
[28]Li, X. H.; Ma, Jia, P.; Wang, J.; Jia, L.; Zhang, T.; Yang, Y.; Chen, H.; Wei, X. (2012). Responses of seedling growth and antioxidant activity to excess iron and copper in Triticum aestivum L. Ecotoxicol Environ Saf., 86: 47-53.
[29]Luck, M. (1963). Peroxidase. In: Methods In Enzymatic Analysis ( Ed.: H.U. Bergmeyer). Academic Press, New York.
pp. 895-897.
[30]Mehrotra, S.C.; Sharma C.P. and Agarwala, S.C. (1985). A search for extractants to evaluate the iron status of plants. Soil Sci. Plant Nutr., 31(2): 155-162.
[31]Miller, G.W.; Huang , I.J.; Welkie, G.W.; Pushmik, J.C. (1995). Function of iron in plants with special emphasis on chloroplasts and photosynthetic activity. In iron nutrition in soils and plant (Ed. J. Abadia), Dordecht, T, Kluwer Academic Publishers. PP. 19-28.
[32]Mittler, R. (2002). Oxidative stress, antioxidants and stress tolerance. Trends Plant Sci, 7: 405– 408.
[33]Nakano, Y. and Asada, K. (1981). Hydrogen peroxide is scavenged by ascorbate- specific peroxidase in spinach chloroplasts. Plant Cell Physiol., 22: 867-880.
[34]Nenova, V. (2006). Effect of iron supply on growth and photosystem II efficiency of pea plants. Gen. Appl. Plant Physiol. (Special Issue), 32: 81-90.
[35]Neves, N.R.; Oliva, M.A.; Centeno, D.C.; Costa, A.C.; Ribas, R.F.; Pereira, E.G. (2009). Photosynthesis and oxidative stress in the resting plant species Eugenia uniflora L. exposed to simulated acid rain and iron ore dust deposition: potential use in environmental risk assessment. Sci Total Environ., 407: 3740-3745.
[36]Noctor, G. and Foyer, C. H. (1998). Ascorbate and glutathione: Keeping active oxygen under control. Annual Review of
Plant Physiology and Plant Molecular Biology, 49: 249-279.
[37]Pereira, E.G.; Oliva, M.A.; Rosado-Souza, L.; Mendes, G.C.; Colares, D.S.; Stopato, C.H.; Almeida, A.M. (2013). Iron
excess affects rice photosynthesis through stomatal and non stomatal limitations. Plant Science, 201-202: 81-92.
[38]Potters, G.; De Gara, L.; Asard, H.; Horemans, N. (2002). Ascorbate and glutathione: guardians of the cell cycle, partners in crime?. Plant Physiol Biochem., 40: 537-548.
[39]Romheld, V. and Marschner, H. (1991). Functions of micronutrients in plants. In: Mortvedt JJ, Cox FR, Shuman LM, Welch RM (Ed). Micronutrients in Agriculture (pp. 297-328): 2ed no. 4 in the Soil Science Society of America Book Series. Soil Sci. Soc. Amer., Inc. Madison, Wisconsin, U.S.A.
[40]Sahrawat, K.L. (2004). Iron toxicity in wetland rice and the role of other nutrients. J. Plant Nutr., 27: 1471-1504.
[41]Sinha, S. and Saxena, R. (2006). Effect of iron on lipid peroxidation, and enzymatic and non enzymatic antioxidants and
bacoside-A content in medicinal plant Bacopa monnieri L. Chemosphere, 62:1340–1350.
[42]Souza-Santos, P.; Ramos, R.S.; Ferreira, S.T.; Carvalho-Alves, P.C. (2001). Iron-induced oxidative damage of corn root
plasma membrane H+-ATPase. Biochim Biophys Acta., 1512: 357-360.
[43]Stein, R.R.J.; Duarte, G.L.; Spohr, M.G.; Lopes, S.I.G.; Fett, J.P. (2008). Distinct physiological responses subjected to iron toxicity under field conditions. Ann Appl Biol., 154: 269-277.