Sophiya et al, International Journal of Computer Science and Mobile Applications, Vol.5 Issue. 10, October- 2017, pg. 36-47 ISSN: 2321-8363 Impact Factor: 4.123
K-Means & Ward’s Algorithm with HBO in Spatial Data Mining
Sophiya
1, Saurabh Sharma
21
Research Scholar, [email protected]
2
Assistant Professor, [email protected]
Abstract
Data mining, the extraction of hidden predictive information from large databases, is a powerful new technology with great potential to help companies focus on the most important information in their data warehouses. Data mining tools predict future trends and behaviors, allowing businesses to make proactive, knowledge-driven decisions. In this paper, a study based on K-means and Ward’s Algorithm with Honey Bee optimization is done for spatial data mining and finally an algorithm is created for data clustering also. Cluster analysis or clustering is the task of grouping a set of objects in such a way that objects in the same group (called a cluster) are more similar (in some sense or another) to each other than to those in other groups (clusters). It is a main task of exploratory data mining. So, by this algorithm clustering can be done in a most appropriate way and can be used for further study.
Keywords: Datamining, HBO Algorithm, GSA Algorithm, Clustering, FCM Algorithm, K-Means Algorithm, Ward’s Algorithm, Spatial Data Mining, Hybrid Clustering Algorithms.
1. Introduction
Data mining is the process of discovering patterns in large data sets involving methods at the intersection of machine learning and database systems. It is an interdisciplinary subfield of computer science. The main goal of the data mining process is to take out information from a data set and transform it into an understandable structure for further use. Aside from the raw analysis step, it involves database and data management aspects and inference considerations. Data mining is the analysis step of the "knowledge discovery in databases" process, or KDD. Data mining offers great potential benefits for GIS-based applied decision-making. Recently, the task of integrating these two technologies has become of critical importance, especially as various public and private sector organizations possessing huge databases with thematic and geographically referenced data begin to realize the huge potential of the information contained therein.
Data mining techniques are the result of a long process of research and product development. This evolution began when business data was first stored on computers, continued with improvements in data access, and more recently, generated technologies that allow users to navigate through their data in real time. Data mining takes this evolutionary process beyond retrospective data access and navigation to prospective and proactive information delivery. Data mining is ready for application in the business community because it is supported by three technologies that are now sufficiently mature:
Massive data collection
Sophiya et al, International Journal of Computer Science and Mobile Applications, Vol.5 Issue. 10, October- 2017, pg. 36-47 ISSN: 2321-8363 Impact Factor: 4.123 Fuzzy logic is an approach to computing based on "degrees of truth" rather than the usual "true or false" (1 or 0) Boolean logic on which the modern computer is based. The idea of fuzzy logic was first advanced by Dr. Lotfi Zadeh of the University of California at Berkeley in the 1960s.Fuzzy logic is a form of many-valued logic; it deals with reasoning that is approximate rather than fixed and exact. Compared to traditional binary sets (where variables may take on true or false values) fuzzy logic variables may have a truth value that ranges in degree between 0 and 1. Fuzzy logic has been extended to handle the concept of partial truth, where the truth value may range between completely true and completely false.
One of the most widely used fuzzy clustering algorithms is the Fuzzy C-Means (FCM) Algorithm (Bezdek 1981). The FCM algorithm attempts to partition a finite collection of n elements into a collection of c fuzzy clusters with respect to some given criterion. Given a finite set of data, the algorithm
returns a list of c cluster centers and a partition
matrix , where each element wij tells the degree to
which element xi belongs to cluster cj . Like the k-means algorithm, the FCM aims to minimize an objective function. The standard function is:
(1)
which differs from the k-means objective function by the addition of the membership values uij and the fuzzifier m. The fuzzifier m determines the level of cluster fuzziness. A large m results in smaller memberships wij and hence, fuzzier clusters. In the limit m = 1, the memberships wij converge to 0 or 1, which implies a crisp partitioning. In the absence of experimentation or domain knowledge, m is commonly set to 2. The basic FCM Algorithm, given n data points (x1, . . ., xn) to be clustered, a number of c clusters with (c1, . . ., cc) the center of the clusters, and m the level of cluster fuzziness.
2.
R
EVIEW FROM THE LITERATURESophiya et al, International Journal of Computer Science and Mobile Applications, Vol.5 Issue. 10, October- 2017, pg. 36-47 ISSN: 2321-8363 Impact Factor: 4.123 S.No. Researchers Paper Name Journal Findings
1 J.Christina, Dr.K.Komathy Analysis of Hard Clustering Algorithms Applicable to Regionalization IEEE Conference on Information and Communication Technologies (ICT 2013).
They develop a system that applies data mining techniques to study air quality distribution of Chennai, a metro city in India using vehicular networking and map the distribution to geographic locations for effective policy making. Three different hybrid clustering methods are analyzed for grouping sites into non-overlapping, contiguous and homogeneous regions. This paper also validates homogeneity of the regions formed.[2]
2
Dipika kalyani, Prof. Setu Kumar
Chaturvedi
A Survey on
Spatio-Temporal Data Mining
International Journal of Computer Science and Network (IJCSN), Volume 1, Issue 4, August 2012.
These researchers did a Survey on Spatio-Temporal Data Mining‖ present an overview of spatio-temporal data mining and discuss its various tasks and techniques in detail. The field of spatio-temporal data mining is concerned with such analysis in the case of spatial and temporal dependencies. Many interesting techniques of spatio-temporal data mining are proposed and shown to be useful in many applications. [3]
3
G.Kiran Kumar, P.Premchand, T.Venu Gopal
Mining Of Spatial Co-location Pattern from Spatial Datasets
International Journal of Computer Applications (0975 – 8887) Volume 42– No.21, March 2012.
These resaerchers address the problem of mining co-location patterns with a novel method called Mediod participation index. Their technique is an extension of maximal participation ratio and deploys the idea of K-mediods from clustering algorithms.. As demonstrated by experimentation, this method yields significant performance improvements compared to previous approaches. Spatial data mining, or knowledge discovery in spatial database, refers to the extraction of implicit knowledge, spatial relations, or other patterns not explicitly stored in spatial databases.[4]
4
Sheng-Tun Li and Shih-Wei Chou, Jeng-Jong Pan
Multi-Resolution Spatio-temporal Data Mining for the Study of Air Pollutant Regionalizationl
Proceedings of the 33rd Hawaii International Conference on System
Sciences – 2000.
They discussed The results of cluster analysis using data generated from discrete wavelet transform and continuous wavelet transform. Data generated from continuous wavelet transfovm provide detailed time-variation features also.[5]
Sophiya et al, International Journal of Computer Science and Mobile Applications, Vol.5 Issue. 10, October- 2017, pg. 36-47 ISSN: 2321-8363 Impact Factor: 4.123
Diansheng et al.[6] in the paper ―Spatial data mining and geographic knowledge discovery— An introduction‖ highlights recent theoretical and applied research in spatial data mining and knowledge discovery. We first briefly review the literature on several common spatial data-mining tasks, including spatial classification and prediction; spatial association rule mining; spatial cluster analysis; and geovisualization. The articles included in this special issue contribute to spatial data mining research by developing new techniques for point pattern analysis, prediction in space–time data, and analysis of moving object data, as well as by demonstrating applications of genetic algorithms for optimization in the context of image classification and spatial interpolation. The papers concludes with some thoughts on the contribution of spatial data mining and geographic knowledge discovery to geographic information sciences.
In-So et al.[7] in the paper ―A Spatial Data Mining Method by Delaunay Triangulation‖ present a spatial data mining method named SMiYN (Spatial data Mining by Triangulated Irregular Network), which is based on Delaunay Triangulation. Sh47ZN demonstrates important advantages over the previous works. First, it discovers even sophisticated pattern like nested doughnuts, and hierarchical structure of cluster distribution. Second, in order to execute SMTIN, we do not need to know a priori the nature of distribution, for example the number of clusters, which is indispensable to other methods. Third, experiments show that SMTIN requires less CPU processing time than other methods such as BIRCH and CLARANS. Finally it is not ordering sensitive and handles efficiently outliers.
Rongqin et al.[8] in the paper ―Mining Fuzzy Spatial Configuration Rules: Methods and Applications‖ in the paper presents a spatial configuration rule mining and feature extracting method based on spatial association rule mining and fuzzy spatial relation reasoning. We detailed introduce the principle and method as well as application examples. A six mining steps established as follow: acquiring spatial data; selection of spatial predicates and knowledge representation; object recognition and extracting based on machine learning; reasoning objects’ spatial relation; extracting spatial frequent itemset; discovering frequent patterns; synthetically evaluate the mining result in contrast to the query. Examples and their mining results were presented to illustrate the algorithm’s validity.
Sophiya et al, International Journal of Computer Science and Mobile Applications, Vol.5 Issue. 10, October- 2017, pg. 36-47 ISSN: 2321-8363 Impact Factor: 4.123
3. RESULTS BASED ON ALGORITHM
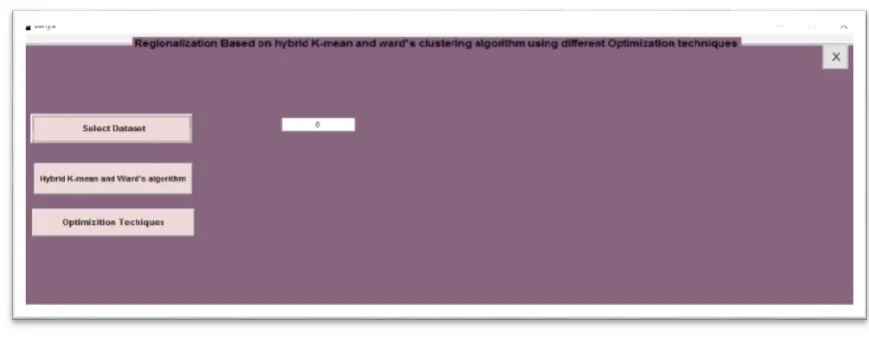
The interface used for regionalization of spatial object is shown in the below Figure 1. GUI works as follows: i) The main central GUI is linked to three windows.
a. SELECT A DATASET
b. HYBRID K-MEAN AND WARD’S ALGORITHM c. OPTIMIZATION TECHNIQUES
ii) On clicking on the button SELECT DATASET as shown in Figure 1 a new pop-up window will be opened as shown in Figure 2. User can select different spatial dataset according to the choice.
Figure 1 Snapshot of GUI used for Regionalization based on Hybrid k-mean and Ward’s clustering algorithm using different optimization techniques
Sophiya et al, International Journal of Computer Science and Mobile Applications, Vol.5 Issue. 10, October- 2017, pg. 36-47 ISSN: 2321-8363 Impact Factor: 4.123
After selecting dataset, the selected dataset is shown in front of SELECT DATASET Button
Figure 3 Snapshot of GUI used for selecting spatial dataset is shown
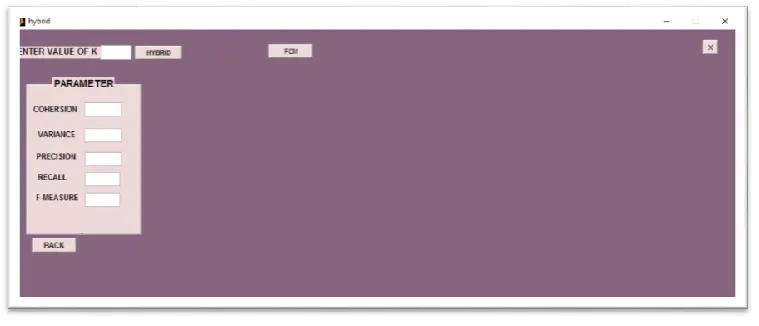
iii) On clicking on the button HYBRID K-MEAN AND WARD’S ALGORITHM a new
window will be opened as show in Figure 4.
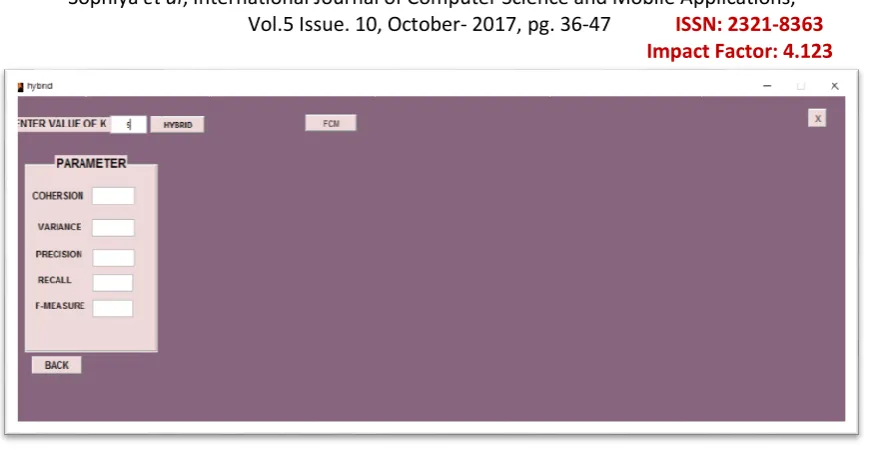
Sophiya et al, International Journal of Computer Science and Mobile Applications, Vol.5 Issue. 10, October- 2017, pg. 36-47 ISSN: 2321-8363 Impact Factor: 4.123 iv) Calculate the parameters through Fuzzy – C Means Algorithum. On Clicking the FCM button we have
find the below window:-
Figure 5 Snapshot of GUI used for Applying Fuzzy C-Means for Regionalization
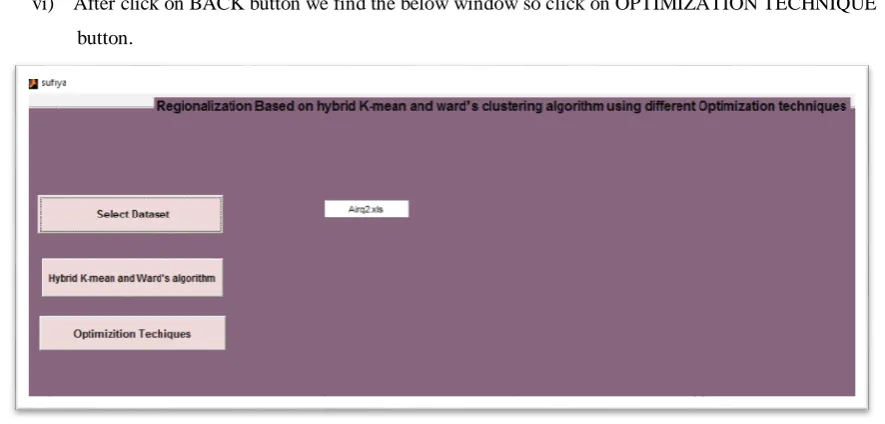
v) After Dividing the Clusters and receive the parameter’s value click on BACK button.
vi) After click on BACK button we find the below window so click on OPTIMIZATION TECHNIQUE button.
Figure 6 Snapshot of window for Clicking the Optimization Techniques
Sophiya et al, International Journal of Computer Science and Mobile Applications, Vol.5 Issue. 10, October- 2017, pg. 36-47 ISSN: 2321-8363 Impact Factor: 4.123
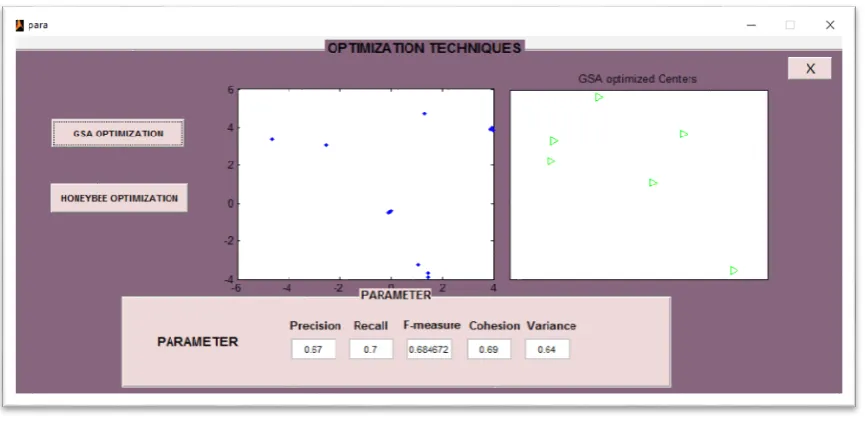
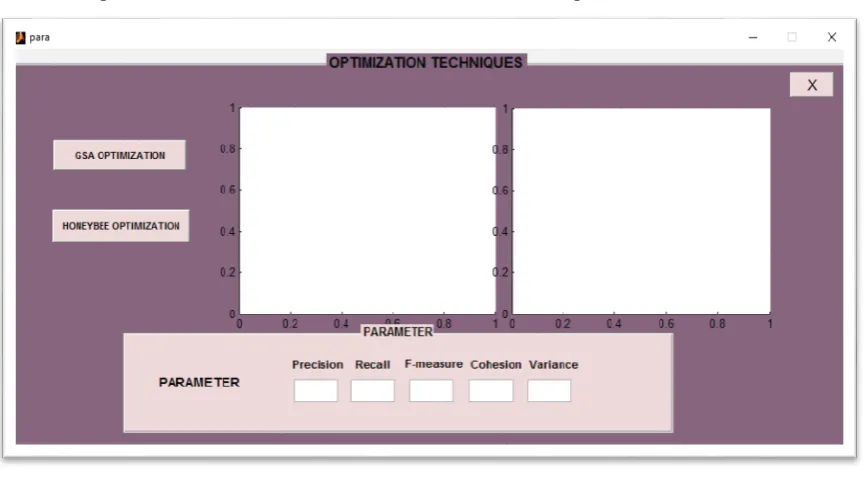
Figure 7 GUI interface for Optimization Technique
viii) When we press the button GSA OPTIMIZATION the results for solving regionalization issue in spatial clustering on different parameters i.e. Cohesion, Variance, Precision, Recall, and F-measure are shown in figure.
Figure 8 Results of GSA Optimization.
ix) Now, we have the parameters with Gravitational Search Algorithm and now find out the same Parameters with the help of .Honey Bee Optimization.
x) Again, Select the same database for finding the Parameters result by HBO through Hybrid Algorithm. xi) First we enter the no. of k-cluster in the box which is in front of label ENTER THE VALUE OF K as
Sophiya et al, International Journal of Computer Science and Mobile Applications, Vol.5 Issue. 10, October- 2017, pg. 36-47 ISSN: 2321-8363 Impact Factor: 4.123
Figure 9 Snapshot of window for Entering value of k cluster
xii) User when press the button HYBRID the results after applying Hybrid K-mean and Ward’s algorithm for solving regionalization issue in spatial clustering on different parameters i.e. Cohesion, Variance, Precision, Recall, F-measure and H-measure are shown.
Figure 10 Showing the result of Hybrid Algorithm
xiii) After calculating the value for hybrid algorithm, click on BACK button. When we click on BACK Button, it shows main window.
Sophiya et al, International Journal of Computer Science and Mobile Applications, Vol.5 Issue. 10, October- 2017, pg. 36-47 ISSN: 2321-8363 Impact Factor: 4.123
Fig 11 GUI interface for Optimization Technique
xv) After opening OPTIMIZATION TECHNIQUES window we have two options as we know
previously i.e. GSA algorithm and HBO algorithm. Firstly we find the results with the GSA
Technique and now we achieve the results with HBO Technique.
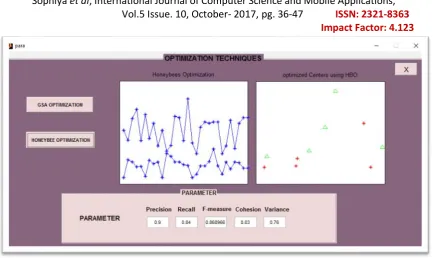
Fig 12 GUI interface for the HBO Optimization
Sophiya et al, International Journal of Computer Science and Mobile Applications, Vol.5 Issue. 10, October- 2017, pg. 36-47 ISSN: 2321-8363 Impact Factor: 4.123
Fig 13 Snapshot of GUI showing the results of Honeybee Optimization algorithm for doing Regionalization on different Parameters.
4. Comparison Table
SN. Optimization Techniques
Parameters
Precision Recall F-Measure Cohesion Variance
1 Gravitational Search Approach
Optimization 0.67 0.7 0.689 0.69 0.64
2 Honey Bee Optimization 0.9 0.84 0.869 0.83 0.76
5. CONCLUSION
Sophiya et al, International Journal of Computer Science and Mobile Applications, Vol.5 Issue. 10, October- 2017, pg. 36-47 ISSN: 2321-8363 Impact Factor: 4.123
REFERENCES
[1] http://www.ijraset.com/fileserve.php?FID=9436 (IJRASET 2017 ).
[2] J.Christina, Dr.K.Komathy, ―Analysis of Hard Clustering Algorithms Applicable to Regionalization‖ Proceedings of 2013 IEEE Conference on Information and Communication Technologies (ICT 2013).
[3] Dipika kalyani, Prof. Setu Kumar Chaturvedi, ―A Survey on Spatio-Temporal Data Mining‖ International Journal of Computer Science and Network (IJCSN), Volume 1, Issue 4, August 2012
[4] G.Kiran Kumar, P.Premchand, T.Venu Gopal, ― Mining Of Spatial Co-location Pattern from Spatial Datasets‖ International Journal of Computer Applications (0975 – 8887) Volume 42– No.21, March 2012. [5] Sheng-Tun Li and Shih-Wei Chou, Jeng-Jong Pan ―Multi-Resolution Spatio-temporal Data Mining for the Study of Air Pollutant Regionalizationl‖ Proceedings of the 33rd Hawaii International Conference on System Sciences – 2000.
[6] Diansheng Guo a,1, Jeremy Mennis, ―Spatial data mining and geographic knowledge discovery—An introduction‖ Computers, Environment and Urban Systems 33 (2009) 403–408.
[7] In-So0 Kang, Tae-wan Kim, and Ki-Joune Li, ―A Spatial Data Mining Method by Delaunay Triangulation‖ http://cimic.rutgers.edu/~adam/mmis03/MMIS/spatial_dm.pdf.
[8] Rongqin Lan a, *, Wenzhong Shi b, Xiaomei Yang c, Guangyuan Lin, ―Mining Fuzzy Spatial Configuration Rules: Methods and Applications‖ ISPRS Workshop on Service and Application of Spatial Data Infrastructure, XXXVI (4/W6), Oct.14-16, Hangzhou, China.
[9] O. A. Mohamed Jafar, R. Sivakumar, ―A Comparative Study of Hard and Fuzzy Data Clustering Algorithms with Cluster Validity Indices‖ http://icecit.sit.ac.in/images/Single%20column%20-%20Sample-elsevier.pdf