ISSN 0015–5659 www.fm.viamedica.pl
The relationship between selected parameters
of a cephalometric analysis determining
the vertical morphology of facial skeleton
and bite force
J. Szymańska
1, Ł. Sidorowicz
21Chair and Department of Paedodontics, Medical University of Lublin, Poland 2Chair and Department of Jaw Orthopedics, Medical University of Lublin, Poland
[Received: 16 February 2017; Accepted: 11 April 2017]
Background: There are few studies devoted to an assessment of the relation between bite force and detailed results of cephalometric analysis that determine craniofacial structure. The purpose of the study was to assess the correlation be-tween the selected criteria determining the craniofacial structure and bite force in patients with normal and increased vertical relation of the bases of jaws and skull.
Materials and methods: The study material included 120 patients, aged between 7 and 17 years, who presented for examination and possible orthodontic treat-ment. The patients were divided into a study group and a control group. The basis of this division were ML-NL and ML-NSL angles, according to Segner’s and Hasund’s analysis standards, respectively: above 27° and above 30° in the study group, and 20.0 ± 7.0° and 28.0 ± 5.0° in the control group. Bite force was tested using a digital dynamometer calibrated in Newtons. The measurement was performed at the level of the first permanent molars. Vertical relations were as-sessed using the following cephalometric measurements: ML-NSL, ML-NL, NL-NSL, N-Me, Sp-Me, SpMe:NMe, ms-NL, SGo:NMe.
Results: Bite force was not found to be dependent on the lower anterior face height (Sp-Me), the ratio of anterior lower to total anterior face height (SpMe:NMe), and NL-NSL angle both in patients with abnormal and normal rela-tions of bases of jaws and skull. Although statistically non-significant, the average mean and maximum bite force values were found to be lower in patients with high-angle relation of bases of jaws and skull than in subjects with normal rela-tion of bases of jaws and skull.
Conclusions: Among the selected parameters determining the vertical craniofacial structure, the rear height of the alveolar process (ms-NL) exerts the greatest influ-ence on bite force in both patients with increased and normal vertical relation of bases of jaws and skull, and with an increase in the value of ms-NL, bite force is reduced. (Folia Morphol 2017; 76, 4: 736–741)
Key words: facial morphology, long face, bite force, cephalometric analysis
INTRODUCTION
The shape of any adult’s face is determined not only by genetic factors, but also by an influence of the local environmental factors, among which mastica-tory muscle functioning is very important [19]. The literature suggests that many researchers assessed the relationship between craniofacial morphology and the structure and force of masseter muscles [4, 7, 10, 13, 15, 19, 24]. Some authors found a correlation between bite force resulting from the primary activity of masseter muscles and the size and morphology of the jaw — length, height of the mandibular ramus and angle of the mandible [13, 21]. Many studies are related to bite force, muscle mor-phology, thickness and activity, and their impact on the facial skeleton morphology [6, 9, 17, 22]. Only a few research works have attempted to explain in detail the relationship between bite force and facial skeleton morphology described by a cephalometric analysis [8, 12, 13, 19, 23]. It should be noted that the use of various cephalometric analyses and stand-ards by the researchers creates additional difficulties in analysing and comparing the results. The study aimed to assess the relationship between selected parameters determining the vertical facial skeleton morphology and bite force.
MATERIALS AND METHODS
The subjects of study (120 patients of the Chair and Department of Jaw Orthopaedics, Medical Uni-versity of Lublin) were aged between 7 and 17 years and referred to the clinic for examination and possible orthodontic treatment. The study design was ap-proved by the Ethics Committee (Resolution number KE-0254/9/2013). The patients’ (60 boys and 60 girls) average age was 12.2 ± 1.7 years, half of the study population were not older than 12 years of age.
A detailed description of the criteria for patient selection, the method of bite force measurement and cephalometric analysis is included in the previ-ous paper [18].
All subjects were divided into two groups. The basis for the division was the ML-NL and ML-NSL angles according to the standards of the Segner and Hasund analysis [16].
— The study group (the angles of ML-NL above 27° and of ML-NSL above 33°) comprised 66 pa-tients (55% of all subjects) aged between 7 and 17 years, half did not exceed 12 years of age, with the average age of 12.2 ± 1.6 years.
— The control group (the angles of ML-NL 20.0 ± ± 7.0° and of ML-NSL 28.0 ± 5.0°) comprised 54 patients (45% of all subjects) aged between 7 and 16 years, half did not exceed 12 years of age, with the average age of 12.3 ± 1.8 years.
Statistical analysis
The results obtained were statistically analysed. To detect the existence of statistical differences between the two analysed groups for quantitative features, the Student’s t-test for independent variables was used. To determine the relationship between the measured features the Pearson correlation coefficient was used. For the statistically significant relationships, straight lines of regression were determined. We estimate the parameters of the regression equation by the least squares method, which is a simple generalisa-tion of the method used in the case of simple linear regression. To assess the goodness of fit the multiple determination coefficient R2 is used.
The 5% error of inference and the associated sig-nificance level p < 0.05, indicating the existence of significant relationships or differences, were assumed. The analysed data base and statistical analyses were performed based on Statistica package version 10.0.
RESULTS
The control groupThe characteristics of the analysed parameters in people with a normal relation of the bases of jaws and skull, who are the controls in the present study, as well as the significant relationship between the elements of cephalometric analysis and bite force in this group were presented in the authors’ previous paper [18].
The study group
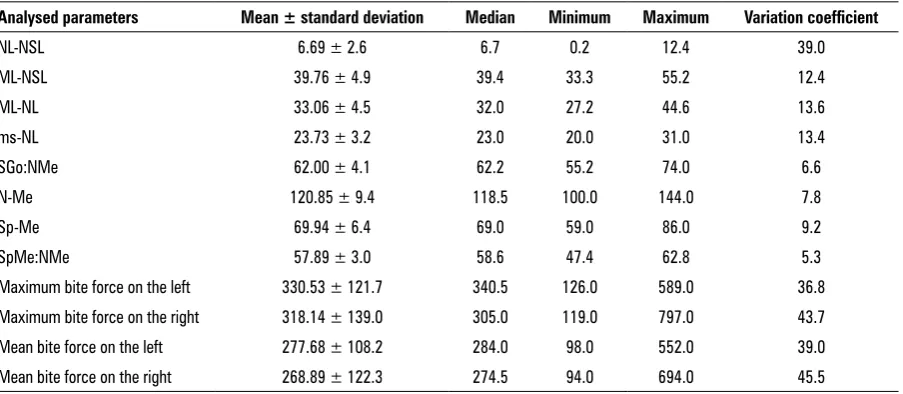
The characteristics of the analysed parameters in patients with a high-angle vertical relationship of jaws and cranial bases (the study group in the present paper) are presented in Table 1.
The documentation of the statistical analysis and of the regression models for patients with a high-angle vertical relationship of jaws and cranial bases is available from the authors.
The positive moderate correlation means that with an increase in SGo:NMe, bite force value is also increased. An evaluation of the coefficient with the variable SGo: NMe indicates that any increase in the posterior to anterior facial height ratio by 1% will increase the mean bite force on the left by an average of 9.9 N and on the right side by 14.2 N. Similar cor-relations may be observed for the maximum bite force on the left and right sides. An increase in SGo:NMe by 1% will result in an increase in the maximum bite force by an average of 12.5 N on the left and by 16 N on the right side.
A statistically significant relationship between bite force and the ms-NL distance was also confirmed. In each case there is a strong negative correlation, that is, with an increase in the value of ms-NL, bite force decreases.
An increase in ms-NL by 1 mm will result in a decrease in the mean bite force by 24.5 N on the left and by 26.5 N on the right side. Even greater changes can be observed by examining the impact of ms-NL distance on the maximum bite force value on the left and right. With an increase of 1 mm in ms-NL, the maximum bite force will decrease by 29.5 N on the left and by 29.7 N on the right side.
Statistically significant relationships were also found between bite force and ML-NL angle. In each case a negative moderate correlation has been shown, which means that with an increase in ML-NL angle, bite force decreases. An increase in the value of the ML-NL angle by one degree reduces the average bite force by 12.3 N on the left and by 12.5 N on the right
side. In the case of bite force maximum values, an increase in ML-NL angle by one degree will result in a decrease in bite force by 14.6 N on the left and by 14.7 N on the right.
A weak statistically significant negative relation-ship between bite force and the ML-NSL angle was found. This means that with an increase in the ML-NSL angle, bite force decreases. With a one-degree increase in ML-NSL angle we observe a decrease in the average bite force by 8.6 N on the left and by 9.2 N on the right side. An analysis of the influence of ML-NSL angle on the maximum bite force showed that an increase in ML-NSL angle by one degree affects a decrease in maximum bite force on the left and right by 107 N and 10.3 N, respectively.
It should be noted that in the group of patients with long face, the statistically non-significant param-eters that did not affect bite force included: lower an-terior face height (Sp-Me), total anan-terior facial height (N-Me), lower anterior face height to total anterior face height ratio (SpMe:NMe), and NL-NSL angles.
The t test for independent variables with a group-ing variable was used to compare the mean values of the analysed parameters in the study group compared to the controls. The study found no statistically sig-nificant difference between the maximum and mean values of bite force on the right and left in the study group in comparison to the controls (Table 2).
An analysis of the selected parameters of the cephalometric analysis determining the vertical mor-phology of facial skeleton and bite force in the study group compared to the controls found statistically Table 1. Characteristics of the analysed parameters in patients with a high-angle vertical relationship of jaws and cranial bases
Analysed parameters Mean ± standard deviation Median Minimum Maximum Variation coefficient
NL-NSL 6.69 ± 2.6 6.7 0.2 12.4 39.0
ML-NSL 39.76 ± 4.9 39.4 33.3 55.2 12.4
ML-NL 33.06 ± 4.5 32.0 27.2 44.6 13.6
ms-NL 23.73 ± 3.2 23.0 20.0 31.0 13.4
SGo:NMe 62.00 ± 4.1 62.2 55.2 74.0 6.6
N-Me 120.85 ± 9.4 118.5 100.0 144.0 7.8
Sp-Me 69.94 ± 6.4 69.0 59.0 86.0 9.2
SpMe:NMe 57.89 ± 3.0 58.6 47.4 62.8 5.3
Maximum bite force on the left 330.53 ± 121.7 340.5 126.0 589.0 36.8 Maximum bite force on the right 318.14 ± 139.0 305.0 119.0 797.0 43.7
Mean bite force on the left 277.68 ± 108.2 284.0 98.0 552.0 39.0
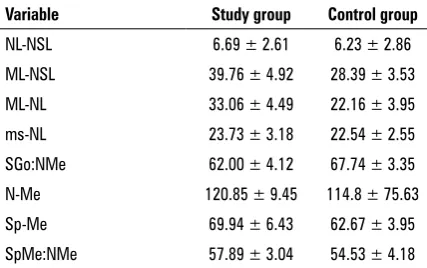
significant differences between the values of the cephalometric analysis parameters between the two groups, with the exception of NL-NSL angle (Table 3).
DISCUSSION
The previous research reported in the literature does not show a statistically significant correlation between the anterior total facial height (N-Me) and bite force [10, 11, 19, 20, 23]. Our study found a positive weak correlation between the average and the maximum bite force on the left and N-Me in the control group. Different results were obtained by Van Sprosen et al. [26], who examined the cross-section of masseter muscles in the long face patients and in the controls, and detected a statistically significant correlation between this parameter and the anterior total facial height. They showed that with an increase in N-Me segment, the cross-section of the masseter muscles, and thus bite force, decreases.
The distance of the molar point (ms) from the maxillary plane (NL) determines not only a degree of vertical development of the maxilla alveolar process, but also an extent of the molar permanent teeth eruption. Excessively erupted molars are associated
with backward rotation of the mandible (ML-NSL angle increases) and the development of vertical growth pattern in patients with long face [2, 15]. This is consistent with the results of our research, in which the values of ms-NL in high-angle patients were increased. Braun et al. [3] and Sontang et al. [19] also pointed to a statistically significant correlation between the posterior height of the alveolar process and the maximum bite force. Interestingly, it was a positive correlation, which Braun et al. [3] described as ‘unexpected.’ Also Ingervall and Minder [8], and Kovero et al. [12] found a statistically significant posi-tive correlation between ms-NL and bite force, but only in female patients. The correlation between the variables in the male group, although not statistically significant, was negative [12]. This observation seems consistent with the results of our research, but one must also consider certain methodological limitations of its interpretation. The mean values for ms-NL in the girls surveyed by Ingervall and Minder [8] were 19.4 ± 2.1 mm. These values are significantly lower than our results, despite the similar age of the patients participating in the study.
Our findings indicate a statistically significant cor-relation between bite force and the SGO:NMe ratio of the posterior to total anterior face height in high-angle patients. The correlation is strong and positive, which means that with an increase in SGO:NMe, bite force also increases. Ingervall and Minder [8] also demon-strated a statistically significant relationship between the maximum bite force and SGO:NMe, but the result was confirmed only in the examined girls. Like in the study group in our research, an increase in SGO:NMe caused an increase in bite force. The values of SGO:NMe in the group of girls reported in the cited work (mean 62.8 ± 4%) are similar to the results obtained.
A statistically significant correlation of SGO:NMe and the maximum bite force, was shown by Kovero et al. [12] in a study on young adults, both men and women, and by Charalampidou et al. [5], who exam-ined with ultrasound the masseter muscle thickness in 72 children aged 8.5–9.5 years. The authors found a statistically significant relationship between this parameter and the ratio of the posterior to total an-terior facial height. With an increase in SGO:NMe, the muscle thickness also increased. The mean SGO:NMe values were 61.5 ± 3.4% in the group of girls, and 62.6 ± 4.5% in the group of boys. These results were similar to the values measured in high-angle patients in our research.
Table 2. The comparison of the bite force values between the study and the control group.
Variable Study group Control group Maximum bite force — right 318.14 ± 138.96 341.46 ± 93.51 Maximum bite force — left 330.53 ± 121.69 340.83 ± 84.25 Mean bite force — right 268.89 ± 122.33 284.98 ± 87.38 Mean bite force — left 277.68 ± 108.17 289.67 ± 73.58 t-Student test with a grouping variable
Table 3. The comparison of the cephalometric analysis parameters between the study and the control group
Variable Study group Control group
NL-NSL 6.69 ± 2.61 6.23 ± 2.86
ML-NSL 39.76 ± 4.92 28.39 ± 3.53
ML-NL 33.06 ± 4.49 22.16 ± 3.95
ms-NL 23.73 ± 3.18 22.54 ± 2.55
SGo:NMe 62.00 ± 4.12 67.74 ± 3.35
N-Me 120.85 ± 9.45 114.8 ± 75.63
Sp-Me 69.94 ± 6.43 62.67 ± 3.95
In a study on 129 adults by Braun et al. [3] ob-tained results similar to those in our control group: the mean SGO:NMe was 68.7 ± 5.8%. The cited work reports a statistically significant correlation between SGO:NMe and the maximum bite force. The correlation, however, is different than that found in our study, since in the control group the re-lationship between SGO:NMe and bite force was not indicated.
As previously mentioned, the patients were di-vided into the control group and the study group on the basis of ML-NSL and ML-NL angles. In the former group there was no statistically significant correlation between ML-NSL and ML-NL angles and bite force, while such a correlation occurred in the latter group: the correlation was moderate for ML-NL angle and weak for ML-NSL angle, i.e. the higher the value of the mentioned angles, the lower the value of bite force. Sondang et al. [19] reported results similar to the values found in our study group; however, the values they measured were lower than those in our research in high-angle patients, but higher in com-parison to the control group. Also Sonnesen and Bakke [20], and Uchida et al. [23] found a statistically significant, negative relationship between ML-NSL and ML-NL angles on the one hand, and the maxi-mum bite force on the other. In addition, Kovero et al. [12] report a statistically significant correlation between the maximum bite force and ML-NSL angle in men, and between the maximum bite force and ML-NL angle in women. Ueda et al. [24], in a study on 30 patients aged 15–28 years, found a statistically significant correlation between ML-NSL and ML-NL angles and the masseter muscle tension measured using electromyography: with an increase in the those angles bite force decreased. Tecco et al. [21] arrived at similar conclusions, showing a statistically significant relationship between the masseter muscles tension and ML-NSL angle.
Pereira et al. [14] found a negative statistically significant correlation between the maximum bite force and ML-NSL angle in the control group, while such a correlation did not occur in the patients with temporomandibular joint dysfunction. The study by Andersen and Sonnesena [1], involving 95 adult pa-tients, showed a statistically significant correlation between the maximum bite force and ML-NSL angle, while no such correlation was found for ML-NL angle. However, Braun et al. [3] reported, in an earlier study, a statistically significant correlation between the
max-imum bite force and the mean ML-NL angle value of 22.1 ± 5.9°. Those results do not correspond to our findings: in our study no such correlation occurred in the control group. On the contrary, Usui et al. [25] obtained the results that are in line with ours. They found a statistically significant relationship between ML-NL angles and the maximum bite force. In their study population divided into five groups according to age, they found ML-NL mean values ranging from 28.1 ± 5.8 mm to 30.5 ± 5.5 mm. Those values are similar to our findings in the high-angle group.
CONCLUSIONS
1. Among the selected parameters determining the vertical craniofacial structure, the rear height of the alveolar process (ms-NL) exerts the greatest influence on bite force both in patients with ab-normal and ab-normal relations of the bases of jaws and skull, but with an increase in the value of ms-NL, bite force is reduced.
2. Bite force is not dependent on the lower anterior facial height (Sp-Me), the ratio of the lower ante-rior facial height to the total anteante-rior facial height (SpMe:NMe), and NL-NSL angle both in patients with abnormal and normal relations of bases of jaws and skull.
3. The average mean and maximum bite force values were lower in patients with high-angle relation of bases of jaws and skull than in subjects with normal relation of bases of jaws and skull, but the differences were not statistically significant.
REfERENCES
1. Andersen MK, Sonnesen L. Risk factors for low molar bite force in adult orthodontic patients. Eur J Orthod. 2013; 35(4): 421–426, doi: 10.1093/ejo/cjs003, indexed in Pubmed: 22291432.
2. Björk A. Prediction of mandibular growth rotation. Am J Orthod. 1969; 55(6): 585–599, doi: 10.1016/0002-9416(69)90036-0.
3. Braun S, Bantleon HP, Hnat WP, et al. A study of bite force, part 2: Relationship to various cephalometric measurements. Angle Orthod. 1995; 65(5): 373–377, doi: 10.1043/0003-3219(1995)065<0373:ASOBFP>2.0. CO;2, indexed in Pubmed: 8526297.
4. Castelo PM, Gavião MB, Pereira LJ, et al. Maximal bite force, facial morphology and sucking habits in young children with functional posterior crossbite. J Appl Oral Sci. 2010; 18(2): 143–148, indexed in Pubmed: 20485925.
doi: 10.1080/00016350701884604, indexed in Pub-med: 18320415.
6. Ciccone de Faria Tdos S, Hallak Regalo SC, Thomazinho A, et al. Masticatory muscle activity in children with a skeletal or dentoalveolar open bite. Eur J Orthod. 2010; 32(4): 453–458, doi: 10.1093/ejo/cjp132.
7. García-Morales P, Buschang PH, Throckmorton GS, et al. Maximum bite force, muscle efficiency and mechanical advantage in children with vertical growth patterns. Eur J Orthod. 2003; 25(3): 265–272, indexed in Pub-med: 12831216.
8. Ingervall B, Minder C. Correlation between maximum bite force and facial morphology in children. An-gle Orthod. 1997; 67(6): 415–422; discussion 423, doi: 10.1043/0003-3219(1997)067<0415:CBMBFA>2.3 .CO;2, indexed in Pubmed: 9428959.
9. Kiliaridis S, Georgiakaki I, Katsaros C. Masseter muscle thickness and maxillary dental arch width. Eur J Orthod. 2003; 25(3): 259–263, doi: 10.1093/ejo/25.3.259, indexed in Pubmed: 12831215.
10. Kiliaridis S, Kjellberg H, Wenneberg B, et al. The relation-ship between maximal bite force, bite force endurance, and facial morphology during growth. A cross-sectional study. Acta Odontol Scand. 1993; 51(5): 323–331, indexed in Pubmed: 8279273.
11. Koc D, Dogan A, Bek B. Bite force and influential factors on bite force measurements: a literature review. Eur J Dent. 2010; 4(2): 223–232, indexed in Pubmed: 20396457. 12. Kovero O, Hurmerinta K, Zepa I, et al. Maximal bite force
and its associations with spinal posture and craniofacial morphology in young adults. Acta Odontol Scand. 2002; 60(6): 365–369, indexed in Pubmed: 12512887. 13. Lowe AA, Takada K, Taylor LM. Muscle activity during
function and its correlation with craniofacial morphology in a sample of subjects with Class II, Division 1 malocclu-sions. Am J Orthod. 1983; 84(3): 204–211, indexed in Pubmed: 6577792.
14. Pereira LJ, Gavião MB, Bonjardim LR, et al. Muscle thick-ness, bite force, and craniofacial dimensions in adolescents with signs and symptoms of temporomandibular dysfunc-tion. Eur J Orthod. 2007; 29(1): 72–78, doi: 10.1093/ejo/ cjl055, indexed in Pubmed: 17290018.
15. Proffit WR, Fields HW. Occlusal forces in normal- and long-face children. J Dent Res. 1983; 62(5): 571–574, doi: 10.117 7/00220345830620051301, indexed in Pubmed: 6573374. 16. Segner D, Hasund A. Indywidualna kefalometria. Med Tour
Press International, Warszawa 1996.
17. Shinkai RS, Lazzari FL, Canabarro SA, et al. Maximum oc-clusal force and medial mandibular flexure in relation to vertical facial pattern: a cross-sectional study. Head Face Med. 2007; 3: 18, doi: 10.1186/1746-160X-3-18, indexed in Pubmed: 17407566.
18. Sidorowicz Ł, Szymańska J. The relationship between facial skeleton morphology and bite force in people with a normal relation of the bases of jaws and skull. Folia Mor-phol. 2015; 74(4): 508–512, doi: 10.5603/FM.2015.0115,
indexed in Pubmed: 26620514.
19. Sondang P, Kumagai H, Tanaka E, et al. Correlation be-tween maximum bite force and craniofacial morphology of young adults in Indonesia. J Oral Rehabil. 2003; 30(11): 1109–1117, indexed in Pubmed: 14641677.
20. Sonnesen L, Bakke M. Molar bite force in relation to occlusion, craniofacial dimensions, and head posture in pre-orthodontic children. Eur J Orthod. 2005; 27(1): 58–63, doi: 10.1093/ejo/cjh069, indexed in Pubmed: 15743864.
21. Tecco S, Crincoli V, Di Bisceglie B, et al. Relation between facial morphology on lateral skull radiographs and sEMG activity of head, neck, and trunk muscles in Caucasian adult females. J Electromyogr Kinesiol. 2011; 21(2): 298–310, doi: 10.1016/j.jelekin.2010.10.014, indexed in Pubmed: 21138792.
22. Tuxen A, Bakke M, Pinholt EM. Comparative data from young men and women on masseter muscle fibres, func-tion and facial morphology. Arch Oral Biol. 1999; 44(6): 509–518, indexed in Pubmed: 10401529.
23. Uchida Y, Motoyoshi M, Shigeeda T, et al. Relationship between masseter muscle size and maxillary morphology. Eur J Orthod. 2011; 33(6): 654–659, doi: 10.1093/ejo/ cjq152, indexed in Pubmed: 21262936.
24. Ueda HM, Ishizuka Y, Miyamoto K, et al. Relationship between masticatory muscle activity and vertical cranio-facial morphology. Angle Orthod. 1998; 68(3): 233–238, doi: 10.1043/0003-3219(1998)068<0233:RBMMAA>2.3 .CO;2, indexed in Pubmed: 9622760.
25. Usui T, Uematsu S, Kanegae H, et al. Change in maxi-mum occlusal force in association with maxillofacial growth. Orthod Craniofac Res. 2007; 10(4): 226–234, doi: 10.1111/j.1601-6343.2007.00405.x, indexed in Pubmed: 17973690.