Vol. 39, No. 1 (2017) 1-8
Tribology in Industry
www.tribology.fink.rs
Fabrication of LM25/SiO
2
Metal Matrix Composite
and Optimization of Wear Process Parameters Using
Design of Experiment
N. Radhika
aa Department of Mechanical Engineering, Amrita School of Engineering, Coimbatore , Amrita Vishwa Vidyapeetham, Amrita University, India.
Keywords:
Metal Matrix Composite Dry sliding wear Analysis of variance Regression analysis
Scanning electron microscope
A B S T R A C T
LM25 aluminium alloy reinforced with 15 wt% SiO2 metal matrix composite was fabricated by liquid metallurgy technique. Microstructure of the fabricated composite specimen was observed using inverted metallurgical microscope and result showed uniform distribution of reinforcement particles in the matrix. The dry sliding wear behaviour of LM25/SiO2 composite was analyzed by conducting experiments using pin-on-disc tribometer. Taguchi’s method was used for designing the number of experiments and L16 orthogonal array was developed for wear analysis. Optimization of parameters like applied load (10 N, 20 N, 30 N, 40 N), sliding velocity (0.5 m/s, 1 m/s, 1.5 m/s, 2 m/s) and sliding distance (500 m, 1000 m, 1500 m, 2000 m) was done using Signal-to-Noise ratio analysis and Analysis of Variance. ‘smaller-the-better’ characteristic was chosen to analyze the dry sliding wear behaviour. Results found that load (69.17 %) had the highest impact on wear rate followed by sliding velocity (18.04 %) and sliding distance (1.5 %). The regression equation was developed and it was validated with confirmatory experiment. Scanning Electron Microscope analysis was done to observe the mechanism of the worn out composite specimen and found more delamination at the load of 40 N.
© 2017 Published by Faculty of Engineering Corresponding author:
N. Radhika
Department of Mechanical Engineering, Amrita School of Engineering, Coimbatore , Amrita Vishwa Vidyapeetham, Amrita University, Tamilnadu, India. E-mail: [email protected]
1. INTRODUCTION
In the last two decades there is a continuous development in the material technology andthe main contribution is to reduce the cost and to meet the global demands of engineering requirement. Engineering materials have limitations to meet the requirement of
mechanical and tribological properties. To overcome these problems, Metal Matrix Composites (MMCs) are used due to their excellent strength, stiffness, high specific modulus, high specific strength, good tribological properties, low coefficient of thermal expansion, thermal conductivity and damping capacity [1-2]. MMCs are used in
R
ES
EA
R
number of applications such as automobile, aerospace, and marine industries [3]. Aluminum is used as matrix metal due to their nature of physical and mechanical properties which are closely suitable for MMCs. A comparison of mechanical properties of unreinforced Al 6061 alloy and Al 6061/12 wt% Titanium Diboride (TiB2) MMCs manufactured through in-situ
process was made. Result revealed that mechanical properties of MMCs were higher than unreinforced alloy[4].The tensile strength of Al/5 Vol. % of Silicon Carbide (SiC) composite fabricated by stir casting route was found high than the same composite fabricated by powder metallurgy technique [5].
Dry sliding wear behavior of Al 6061 composite reinforced with varying wt% (2, 6, 10 and 15) of Beryl was investigated and found that specific wear rate was decreased linearly with increasing wt% of Beryl [6]. Investigation on adhesive wear behavior of Al 2219/titanium carbide (TiC) MMCs revealed that addition of TiC particles improved the wear resistance of the composite [7]. Dry sliding wear behavior of LM 6 aluminum alloy reinforced with 5 wt% of Graphite and 10 wt% of Titanium Oxide (TiO2)
hybrid composite was studied and found that presence of graphite particle decreased the wear rate and presence of TiO2 particle increased the
mechanical properties of the composite [8]. Effect of varying alumina (Al2O3) particle wt%
(3, 6, 9 and 12) and its particle size (149, 105, 74 µm) on wear behavior of Al 7075 composite have been studied and observed that wear rate decreased with decrease in particle size and with increase in weight percentage of the reinforcement [9]. Effect of Zirconium Silicate (ZrSiO4)particle size (53-105 µm) on dry sliding
wear behavior of Al-12wt%Si-5wt%Sn
composite fabricated by spray forming technique was analyzed and lesser wear rate was observed with the particle size of 53 µm [10]. Effect of wear parameters on Al 2219 alloy reinforced with 3wt% of Boron Carbide (B4C)
and 3, 4 and 5wt% of Molybdenum Disulphide (MoS2) hybrid MMCs were investigated and
found that wear rate increased initially with sliding distance and sliding velocity and thereafter decreased[11].
The process parameters are well optimized by Taguchi Design of Experiment (DOE) [12,13]. There are three main phases in DOE process
such as planning phase, conducting phase and analysis interpretation phase. Among these three phases, the most important phase is planning phase, so one has to give more emphasis to that phase. Dry sliding wear resistance of Al 7075 alloy reinforced with different reinforcement particles such as Al2O3,
SiC and cenosphere have been investigated through Taguchi’s method and found that applied normal load was the most influential parameter for Al2O3 and cenosphere reinforced
composite, and for SiC reinforced composite, sliding velocity was the most influential factor. It is also observed that SiC reinforced composite showed least wear rate compared to Al2O3 and
cenosphere reinforced composites [14]. Effect of dry sliding wear parameters of Al 6351 alloy reinforced with fly ash (10 µm) particles were also analyzed using Taguchi technique and found applied load had greatest impact on wear rate followed by sliding velocity and weight percentage of reinforcement [15].The wear rate of Al6061T6 alloy reinforced with 10% SiC/10% Al2O3/5% Graphite hybrid MMCs were analyzed
through regression model analysis and observed that wear rate increased with applied load and decreased with sliding velocity and sliding distance [16].
Based on the above literature survey it is observed that Al-SiO2 (Silicon Dioxide) MMCs
has not been fully explored. Hence the aim of the present work is to fabricate LM25Al/15 wt % of SiO2 MMCs and investigate its dry sliding wear
characteristics through DOE technique.
2. MATERIAL SELECTION
LM25 aluminium alloy was chosen as the matrix material due to its properties such as excellent castability, good machinability and light weight [17]. This alloy is used to cast intricate shape of the automobile and aerospace components [18]. The elemental composition of this alloy is shown in the Table1.
Table 1. Elemental Composition of LM25 Al alloy.
Compos. Si Fe Cu Mn Zn Mg Ti Al
Range 6.5-7.5 0-0.55 0-0.2 0-0.35 0-0.1 0.2-0.4 0-0.2 Bal.
wt% 7.34 0.4 0.1 0.09 0.1 0.38 0.1 Bal.
SiO2 (30-45 µm) with 15 wt% was chosen as
resistance properties and is used as refractory in thermal protection system. The densities of aluminum alloy and SiO2 particles were 2.68
g/cm3 and 2.62 g/cm3 respectively. The
LM25/SiO2 composite is well suited for
automobile application especially for the manufacture of engine piston [19].
3. FABRICATION OF COMPOSITE
The LM25Al/15wt%SiO2 composite was
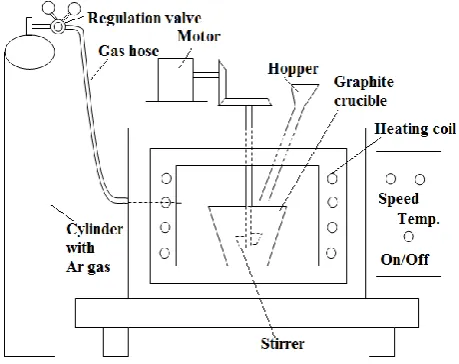
fabricated by stir casting route as this is the most economical and result oriented process for fabrication of MMCs which has been adopted by many researchers [20]. The aluminium ingots were taken in the graphite crucible and kept inside the electric resistance furnace (Fig. 1), where melting occurs between the temperature range of 600-700 ͦC under inert argon gas atmosphere in order to prevent the reaction between molten metal and ambient air to avoid the occurrence of casting defects like porosity, blow holes, etc.
Fig. 1. Schematic view of Melting furnace.
The preheated (300 ͦC) reinforcement particles (SiO2) were gradually added to the melt and
stirring was carried out at a speed of 300 rpm for 5 minutes to get homogeneous distribution of SiO2 particles in the matrix. The molten
mixture was then poured at 710 ͦC into the mild steel mould (180 mm in length and 40 mm in diameter) and allowed to solidify.
4. MICROSTRUCTURAL ANALYSIS
The microstructure of LM25/SiO2 composite
was observed by Zeiss Axiovert 25 CA Inverted
Metallurgical Microscope. For microstructural analysis, the composite specimen was cut into small piece and was mechanically polished initially using SiC emery paper size of 400, 600 and 1000 grade. Further, polishing was done on the specimen using velvet cloth with alumina powder in order to obtain smooth surface finish. Then these specimens were properly etched with keller’s reagent to observe the microstructure of the composite.
5. WEAR TEST
Dry sliding wear experiment was conducted on the LM25Al/15wt%SiO2 composite using
pin-on-disc tribometer. The test specimens of 10 mm in diameter and 35 mm in length were machined from fabricated composite. The stationary holder was used to hold the composite specimen (pin) at one end and the loads were provided by fixed arm with pulley arrangements connected at other end. A Group of weights connecting the fulcrum through the beam provides normal force on the pin. The rotating speed of the disc was controlled so that constant contact was provided at various test parameters. The rotating disc and pin were properly cleaned by SiC emery paper with the grade 1/0 and 2/0 in order to ensure the fresh contact between pin and counterface. The weighing balance having an accuracy of 0.0001 g was used to weigh the specimen prior to and after each experiment.
6. PLAN OF EXPERIMENT
L16 orthogonal array was selected for the
present investigation and the degree of freedom for the orthogonal array should be greater than or equal to, the sum of the variables [21]. The parameters and the corresponding levels are shown in Table 2. The experiment was conducted to analyze the effect of dry sliding wear parameters on Al MMCs and the wear rate results were subjected to Analysis of Variance (ANOVA) and S/N ratio analysis.
Table 2. Process parameters and their levels
Level Load (N) Sliding Velocity (m/s) Sliding Distance (m)
1 10 0.5 500
2 20 1 1000
3 30 1.5 1500
7. RESULTS AND DISCUSSION
Microstructural results, Signal-to-Noise (S/N) ratio, dry sliding wear behaviour, Analysis of Variance (ANOVA) are discussed in the following subsections.
7.1 Microstructural Results
The microstructure of LM25/SiO2 reinforced
composite and SEM image of SiO2 reinforcement
particles are shown in Figs. 2 and 3 respectively.
Fig. 2. Microstructure of LM25/SiO2 composite.
Fig. 3. SEM image of SiO2 particles.
From Fig. 2, it is seen that the reinforcement particles were uniformly distributed over the matrix. This homogeneous distribution was due to casting parameters such as constant stirring speed (300 rpm) and stirring time (5 min).
7.2 Dry sliding wear behavior
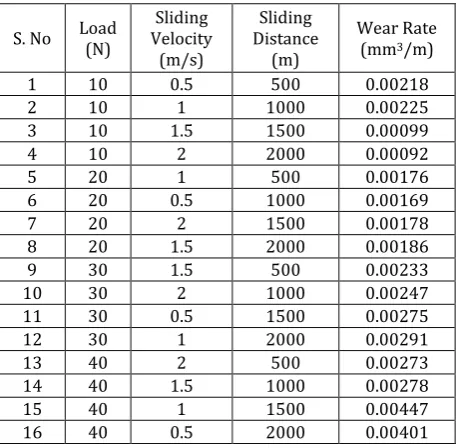
Based on L16 orthogonal array, dry sliding wear
rate of the LM25/SiO2 composite was calculated
and their results are listed in Table 3.
Table 3. Dry sliding wear experimental results
S. No Load (N) Velocity Sliding (m/s)
Sliding Distance
(m)
Wear Rate (mm3/m)
1 10 0.5 500 0.00218
2 10 1 1000 0.00225
3 10 1.5 1500 0.00099
4 10 2 2000 0.00092
5 20 1 500 0.00176
6 20 0.5 1000 0.00169
7 20 2 1500 0.00178
8 20 1.5 2000 0.00186
9 30 1.5 500 0.00233
10 30 2 1000 0.00247
11 30 0.5 1500 0.00275
12 30 1 2000 0.00291
13 40 2 500 0.00273
14 40 1.5 1000 0.00278
15 40 1 1500 0.00447
16 40 0.5 2000 0.00401
7.3 Signal-to-Noise Ratio analysis
Signal-to-Noise ratio (S/N Ratio) was used to analyze the effect of parameters such as sliding velocity, sliding distance and load on wear rate. These analyses were done using Minitab software. The S/N ratio was calculated based on ‘smaller-the-better’ characteristic given by Taguchi and is as follows:
S/N ratio = -10 Log10 [ ∑y2]
where ‘y’ is response value and ‘n’ is number of observation.
Response table for S/N ratio is shown in Table 4 where delta value was used to figure out the most extremely affecting parameter on wear rate and highest delta value means that parameter causes more wear. The delta value gives the discrepancy between the peak S/N ratio value and the lowest S/N ratio value of the parameter. From Table 4, it is observed that wear rate was majorly affected by load parameter followed by sliding velocity and sliding distance.
Table 4. S/N Ratio Response table.
Level Load (N) Velocity (m/s) Sliding Distance (m) Sliding
1 57.58 58.32 56.32
2 62.24 52.7 54.16
3 55.06 59.55 56.18
4 52.05 56.35 60.26
Delta 10.19 6.85 6.11
7.4 Influence of Parameters on Wear Rate
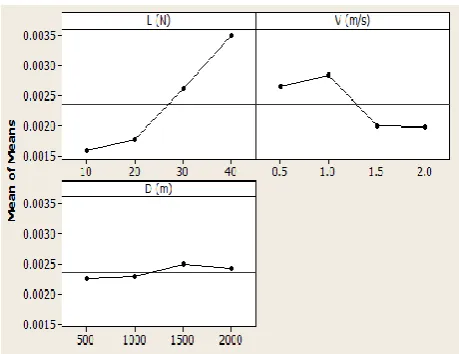
S/N ratio and mean plot for the wear rate are graphically shown in Figs. 4 and 5 respectively.
Fig. 4. Main Effects Plot for S/N ratio.
Fig. 5. Main Effects Plot for Means.
The S/N ratio plot (Fig.4) gives the optimum value (L=10 N, V=2 m/s and D=2000 m) of process parameters to improve the wear resistance of composite and mean plot describes the trend of responses for the three parameters.
7.5 Impact of load on wear behavior
From Fig. 5, for the load between 10 N to 20 N, the wear rate of the composite increased slightly due to lesser contact between the composite surface and counterface and material removal was minimum. As the load increased from 20 N to 40 N, wear rate of the composite increased as the load pushed the specimen strongly against the disc and consequence of that higher amount of stress acted on the harder and sharper reinforcement particles. This caused greater rubbing action which underwent plastic
deformation and decreased the strength between matrix and reinforcement particles. As a result of this, some of the reinforcement particles get fractured and the wear rate progressively moved to the matrix and more material was removed from the composite specimen. In addition to that, the higher strain hardening tendency in the subsurface layer of the composite also caused delamination and resulted in higher wear rate and the similar trend was observed in previous study [22].
7.6 Impact of sliding velocity on wear behaviour
From Fig. 5, it was observed that the wear rate of the composite increased and then decreased with sliding velocity. From the sliding velocity of 0.5 m/s to 1 m/s, the contact time between composite and counterface material was high which led to increase the interfacial temperature. Due to this, the reinforcement particles tend to lose their load bearing capacity which resulted in higher wear rate. In addition to decrease of reinforcement particle strength, the increase of matrix contact with counterface material was also attributed to increased wear rate of the composite. On the other hand, the removal of matrix material was reacted with atmospheric air and forms a non-porous oxide layer over the composite surface. The strong formation of an oxide layer protected the composite and consequently wear rate of the composite reduced with the increase of sliding velocity from 1 m/s to 1.5 m/s. From the sliding velocity of 1.5 m/s to 2 m/s the wear rate of the composite decreased continuously due to lesser contact time between the composite and counterface material and the similar trend was observed in previous investigation [23].
7.7 Impact of sliding distance on wear behaviour
between the sliding surfaces and smoothened which allowed uniform contact with the counterface and thereby wear rate decreased, where similar behavior was also observed in previous study [24].
7.8 Analysis of Variance
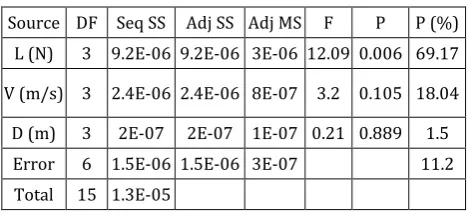
Analysis of Variance (ANOVA) was used to find out the most influencing design factors which affect the performance characteristics (Table 5).
Table 5. ANOVAresults for wear rate.
Source DF Seq SS Adj SS Adj MS F P P (%)
L (N) 3 9.2E-06 9.2E-06 3E-06 12.09 0.006 69.17
V (m/s) 3 2.4E-06 2.4E-06 8E-07 3.2 0.105 18.04
D (m) 3 2E-07 2E-07 1E-07 0.21 0.889 1.5
Error 6 1.5E-06 1.5E-06 3E-07 11.2
Total 15 1.3E-05
The ANOVA was conducted for the confidence level of 95 % and significance level of 5 %. The percentage contribution of each parameter was shown in the last column of ANOVA. The P value of the load parameter from the table was found to be less than 0.05. From the results, it was concluded that load (69.17 %) had higher impact on wear rate followed by sliding velocity (18.04 %) and sliding distance (1.5 %).
8. LINEAR REGRESSION ANALYSIS
The linear regression equation was developed by using Minitab statistical software. This analysis was used to identify the correlation between predicted variable and the response variable.
The regression equation for wear rate is as follows: W = 0.00127 + 0.000066 L - 0.000581 V + 0.0000001 D (1)
where L is the applied load in (N), V is sliding velocity in (m/s), D is sliding distance in (m).
The positive/negative sign of this equation (1) indicated the wear behaviour of composite. The positive sign indicated increase in wear rate and negative sign indicated decrease in wear rate with parameter. The confirmation test was performed with parameters other than selected parameters as shown in Table 6 and the wear
test was conducted for the preferred levels. Then the results observed from experimental wear rate were compared with regression wear rate and found an error less than 7 %.
Table 6. Selected Parameters and Results for confirmation experiment.
S. No Load (N)
Sliding Velocity
(m/s)
Sliding Distance
(m)
Experim. wear rate (mm3/m)
Regression wear rate (mm3/m)
Error %
1 15 0.8 750 0.00185 0.00179 3.2
2 25 1.2 1250 0.00211 0.00222 5.2
3 35 1.6 1750 0.00248 0.00265 6.8
The regression wear rate results were closely similar to experimental wear rate with minimum error and hence the developed model had higher efficiency to analyze the wear rate of composite.
9. SCANNING ELECTRON MICROSCOPE ANALYSIS
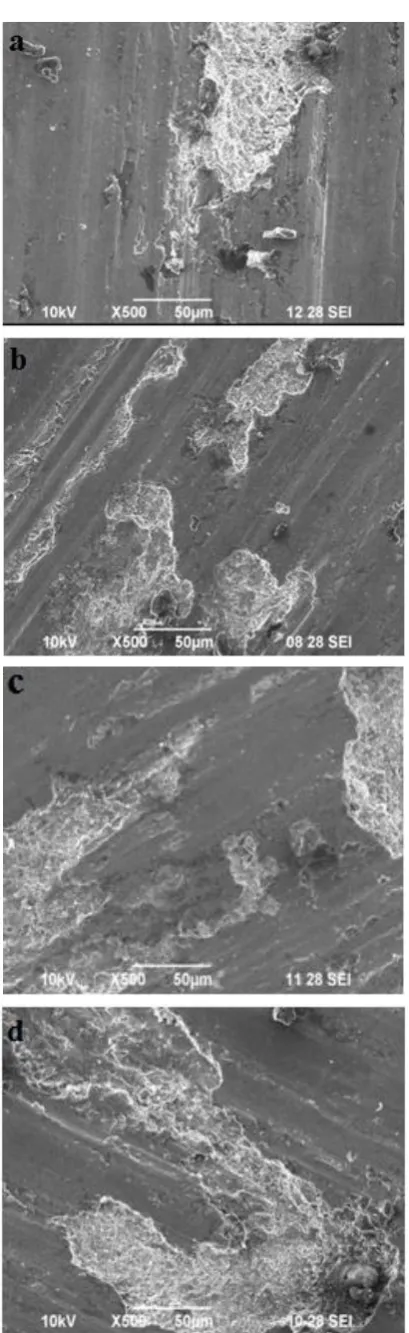
Fig. 6. SEM images of worn out specimens at various conditions, a) L=10 N, D=1500 m, b) L=20 N,D=2000 m, c) L=30 N,D=500 m, and d) L = 40 N, D=1000 m.
Fig. 7. SEM image at optimum condition.
10. CONCLUSION
The LM25/SiO2 composite was successfully
fabricated by stir casting technique. Microstructure of the composite was observed and result showed uniform distribution of reinforcement particles in the matrix. The process parameters were analysed using Taguchi technique. From the ANOVA analysis, it was found that load (69.17 %) had major impact on wear rate followed by sliding velocity (18.04 %) and sliding distance (1.5 %). The regression equation was developed and it was validated with the confirmatory results.SEM analysis revealed the occurrence of maximum wear at high load condition. The present research on the dry sliding wear of aluminium MMC can be used for applications where dry sliding wear resistance is of major consideration.
REFERENCES
[1] A. Burr, J.Y. Yang, C.G. Levi and F.A. Leckie, ‘The strength of metal matrix composite joints’, J. Pergamon., vol. 43, no. 9, pp. 3361-3373, 1995. [2] V. Jayaseelan, K. Kalaichelvan, M. Kannan and S.
Vijay Ananth, ‘Extrusion characterizes of Al/SiC by different manufacturing process’, Int. J. Appl. Eng. Res., vol. 1, no. 2, pp. 194-199, 2010.
[3] A. Vencl, A. Rac and I. Bobic, ‘Tribological behaviour of Al-based MMCs and their application in automotive industry’, Tribology in Industry, vol. 26, no. 3, pp. 31-38, 2004.
MMC Al 6061/TiB2/12p’,J. Miner. Mater. Charact.
Eng., vol. 9, no. 1, pp. 57-65, 2010.
[5] A. Mazahery and M. O. Shabani, ‘Microstructural and abrasive wear properties of SiC reinforced aluminum-based composite produced by compo casting’, Trans. Nonferrous Met. Soc. China., vol. 23, pp. 1905-1914, 2013.
[6] H.N. Reddappa, K.R. Suresh, H.B. Niranjan and K.G. Satyanarayana, ‘Dry sliding friction and wear behavior of Aluminum/Beryl composites’,
Int. J. Appl. Eng. Res., vol. 2, no. 2, pp. 0976-4259, 2011.
[7] J.I. Harti, B.R. Sridhar, H.R. Vitala and P.R. Jadhav, ‘Wear behavior of Al 2219-TiC particulate metal matrix composites, Am. J. Mater. Sci., vol. 5, no. 3, pp. 34-37, 2015.
[8] R. Sharma, P. Sharma and G. Singh, ‘Dry sliding behavior of aluminium alloy reinforced with hybrid ceramic particles’, Int. J. Multi. Res. Dev., vol. 2, no. 10, pp. 485-491, 2015.
[9] N. Raghavendra and V.S. Ramamurthy, ‘Effect of particle size and weight fraction of alumina reinforcement on wear behavior of aluminum metal matrix composites’, Int. J
.
Innovative Res. Sci. Eng. Technol., vol. 3, no. 4, pp. 11191-11198, 2014.[10]R. Mittal and D. Singh, ‘Dry sliding wear behaviour of spray formed ZrSiO4 reinforced Al-Si-Sn alloy’, Adv. Mat. Lett., vol. 3, no. 1, pp. 38-43, 2012.
[11]N.G.S. Kumar, V.M. Ravindranath and G.S.S. Shankar, ‘Mechanical and wear behavior of aluminium metal metrix hybrid composites’,
Procedia. Mater. Sci., vol. 5, pp. 908 – 917, 2014. [12]G. Taguchi and S. Konishi, ‘Taguchi methods,
orthogonal arrays and linear graphs, tools for quality engineering’, American Supplier Institute, pp. 35–38, 1987.
[13]N. Radhika, A. Vaishnavi and G. K. Chandran, ‘Optimisation of dry sliding wear process parameters for aluminium hybrid metal matrix composites’, Tribology in Industry, vol. 36, no. 2, pp. 188-194, 2014.
[14]K.K. Ekka, S.R. Chauhan and Varan, ‘Effect of different reinforcements on sliding wear of aluminium matrix composites using Taguchi design of experimental technique’, Indian. J. Eng. Mater. Sci., vol. 22, pp. 195-202, 2015.
[15]M. Uthayakumar, S.T. Kumaran and S. Aravindan, ‘Dry Sliding Friction and Wear Studies of Fly Ash Reinforced AA-6351 Metal Matrix Composites’,
Adv. Tribol., vol. 2013, p. 6, 2013.
[16]S. Kundu, B.K. Roy and A.K.R. Mishra, ‘Study of dry sliding wear behavior of aluminium/SiC/Al2O3/graphite hybrid metal matrix composite using Taguchi technique’, Int. J. Sci. Res., vol. 3, no. 1, pp. 2250, 2013.
[17]N. Radhika and R. Raghu, ‘Parametric study of dry sliding wear behavior of functionally graded Al LM25/Si3N4 composite by response surface methodology’, Adv. Compo. Lett., vol. 24, no. 6, pp. 130-136, 2015.
[18]A. Srinivasan, U.T.S. Pillai, V. John and B.C. Pai, ‘Low-pressure casting of LM25 (Al-7Si-0.3 Mg) aluminium alloy’, Mater. Manuf. Process., vol. 20, no. 2, pp. 221-230, 2005.
[19]M. Singh, K. Goyal and D.K. Goyal, ‘Fabrication and performance of aluminium based metal matrix composites with SiO2 and TiO2 as reinforced particles’, j. Mech. Eng., vol. 3, no. 4, pp. 142-146, 2015.
[20]S. Sadi, V. Malau, M.W. Wildan and S. Suyitno, ‘Optimization of stir casting process parameters to minimize the specific wear of Al-SiC composites by taguchi method’, Int. J. Eng. Technol., vol. 7, no. 1, pp. 0975-4024, 2015. [21]N. Radhika and R. Subramaniam, ‘Wear
behaviour of aluminium/alumina/graphite hybrid metal matrix composites using Taguchi's techniques’, Ind. Lubr. Tribol., vol. 65, no. 3, pp. 166-174, 2013.
[22]N. Radhika and R. Raghu, ‘Evaluation of dry sliding wear characteristics of LM13 Al/B4C composites’, Tribology in Industry, vol. 37, no.1, pp. 20-28, 2015.
[23]R.L. Deuis, C. Subramanian and J.M. Yellup, ‘Dry sliding wear of aluminium composites-a review’,
J. Compos. Sci. Tech., vol. 57, pp. 415-435, 1997. [24]L. Zhang, X.B. He, X.H. Qu, B.H. Duan, X. Lu and