An Empirical Study of Consumer Adoption of Internet of Things Services
Wonjun Lee
1,*, Seungjae Shin
21Business Administration Department, Cheongju University, Cheongju, Korea 2
Devision of Business, Mississippi State University, Meridian, M.S., U.S
Received 04 June 2017; received in revised form 11 January 2018; accepted 04 April 2018
Abstract
Internet of things (IoT) is considered as a next-generation digital revolution to connect things with an embedded system to the Internet, which will lead to dramatic changes in our lives. The purpose of this paper is to identify the antecedents of consumers’ attitudes toward IoT, and test their influences on the attitudes and behaviors of consumers. To reach the research goal, this paper develops and tests factors determining user acceptance of IoT services by using an extended unified theory of acceptance and use of technology (UTAUT) model, which includes a factor of the hindering condition. Based on the structural equation modeling (SEM) analysis of 224 survey responses, the result shows that performance expectancy, social influence, facilitating condition, and hindering condition have a strong effect on behavioral intention to use IoT services, but effort expectancy does not support the relationship with behavioral intention.
Keywords: IoT, technology adoption, user behavior, UTAUT-H
1.
Introduction
Since the Internet became popular in the mid-1990s, people have produced and consumed information on the Internet; people have also performed economic activities on the Internet. With the introduction of social networking sites, more and more people are connected to the Internet. In the early 21st century, when radio frequency identification (RFID) technology was highlighted by the U.S. Department of Defense and Walmart [1], the focus on the Internet has shifted from human beings to things. The next generation of internet revolution could be ushered in by the emerging version of the Internet of Things (IoT), which will connect everything you can imagine. Many researchers consider IoT new paradigm to make things smarter and to provide economic and social innovations with a dramatic increase in productivity [2-3]. The advent of IoT technology brings new opportunities for both companies and consumers. It is assumed that, in the near future, everything will be an Internet object and nearly every device and merchandise will be tagged with sensors that will collect and send information about people’s consumptions, locations, and usage patterns to a greater extent [4]. The IoT technology is reshaping how people access information and IoT products will be a significant part of consumer infrastructure of smart retailing, smart homes, and smart cities, which will change consumers’ lives and their behaviors [2]. Additionally, the IoT service will provide consumers with greater convenience, speed, quality of products, and trusted services [5].
The IoT technology is expected to be used in many areas today, such as telecommunications, smart homes, supply chain management (SCM), retail tracking, and so on. Although consumers enjoy the benefits of new innovation, they are often confused by new technology [6]. For instance, the proliferation of communication technology raised privacy and security concerns due to the unprecedented amounts of information that the new communication technology could collect, analyze, and store [7]. Researchers are taking note of the possible implications of IoT services and debating how to understand the impacts
of IoT service on the lives of consumers. As a result, understanding consumer acceptance becomes a critical prerequisite in expanding IoT applications to daily life. Because IoT development is in its early stages, only a little attention has been devoted to understanding the issue from the perspective of the individual consumers. Kim and Kim (2016) [8] argued that the lack of user acceptance is one of the obstacles that must be overcome in order for a new technological innovation, such as IoT technology. A user’s perception of usefulness, easiness, and safety are prerequisites for a user’s acceptance of IoT technology. Given the importance of the new technology and the difficulty of understanding the consumer, this paper aims to develop and empirically test a causal relationship model of factors determining consumer acceptance of IoT technology.
2.
Literature Review
2.1. IoT service
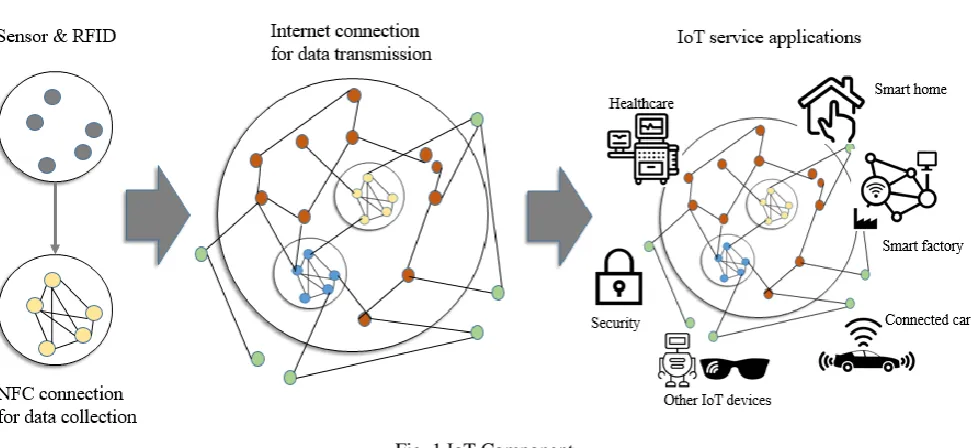
Fig. 1 IoT Component
The term IoT was coined first in 1999 [9] to extend the benefits of the traditional internet to goods in the physical, real world [10]. The origin of IoT stems from the development of RFID technology by the Auto-ID Center at MIT [11]. Borgia (2014) [11] listed several different versions of IoT definitions: (1) MIT’s original definition focuses on intelligent infrastructure with RFID technology, (2) International Telecommunication Union (ITU)’s 2005 definition emphasizes ubiquitous connection, i.e., the world of information and communication technologies for any time, any place connectivity for anyone and anything, and (3) the definition by Cluster of European Research Project on the internet of things (CERP-IoT) in 2009 is the dynamic global network infrastructure with identification of physical and virtual things. A recent, concise definition by McKinsey & Company (2015) [12] is “a network containing all smart devices with some sort of sensing mechanism that can communicate via the Internet with other smart devices or the cloud”. Fig. 1 shows these existing definitions implicitly.
2.2. User acceptance behavior
D Chang, Dong, and Sun (2014) [13] studied factors of IoT products on consumer purchase intentions. Participants in their study watched IoT related videos before completing a survey. In their study, there were six IoT product characteristics: connectivity, interactivity, telepresence, intelligence, convenience, and security. They designed dual customer experiences (functional experience and emotional experience) as mediating variables to influence purchase intentions. They found that all six factors positively influenced intentions to purchase through functional experience. Kim and Kim (2016) [8] surveyed information and communications technology (ICT) experts and proposed an analytic hierarchy process (AHP) to find a viability of IoT applications. They found that logistics was the most promising IoT area to be applied to its strong market potential. They also mentioned that new technology like the IoT should be perceived as useful and enjoyable, as well as safe. Gao and Bai (2015) [14] used the electronic toll collection (ETC) system as an application of IoT usage. The ETC uses RFID technology with a tag attached to the car windshield and RFID readers are established above toll gates, which collects tolls electronically without stopping cars at toll gates. Their basic framework for user acceptance was the technology acceptance model (TAM), with a few other factors. Their results showed that social influence and behavioral control factors, as well as factors from the TAM, such as perceived ease of use, perceived usefulness, and perceived enjoyment, strongly supported a behavioral intention of using IoT; however, the trust factor did not support their hypothesis significantly.
Despite these studies, however, the research from the consumer’s point of view is still very rare and in its initial stage [15]; there is little academic literature available regarding the study of IoT user behavior. Understanding users who are exposed to new technologies such as IoT is particularly challenging. Adoption of a new technology may benefit its users, but it also provides negative effects, such as concerns for privacy or stress from the technology. For instance, it has been pointed out that personal technology usage involves the dual experience of positive and negative attitudes. Researchers have found conflicting consumer behaviors and have documented both satisfied and dissatisfied technology experiences [6, 16–18]. Winner (1994) insisted that technology use can generate a contradicting experience of efficacy and ineptitude [16]. Johnson et al. (2008) also examined the role of consumer paradoxes and identified dual experiences users could encounter [6]. They revealed three paradoxes: control/chaos, fulfill needs/create needs, and freedom/enslavement. Internet use increased both convenience and problems regarding compulsive use.
3.
Hypotheses
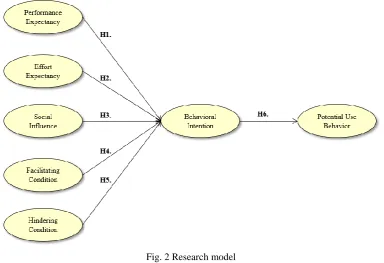
In this section, the authors present the hypotheses that the authors incorporated to extend the UTAUT model to the IoT context from the consumer point of view. Fig. 2 shows the modified UTAUT-H model with a new core variable of the hindering condition. According to the previous researchers, many articles cited the UTAUT as a general reference to the adoption of technology and some researchers tried furthering the UTAUT. The extensions, particularly the addition of new constructs or deletion of existing constructs, have been helpful in expanding the theoretical application of the UTAUT. As we mentioned in the previous section, the authors are considering both positive and negative factors in dealing with IoT service. The hypotheses H1~H4 are adopted from the classical UTAUT model; H5 is an additional hypothesis. While H4 is illustrating the positive aspects of IoT adoption, H5 is depicting the negative aspects of adopting IoT. In the UTAUT-H model, each positive and negative path affect behavioral intention in an individual manner. The two contradicting variables, facilitating condition and hindering condition, exist at the same time, affecting consumer behavior separately. Fig. 2 shows the hypotheses.
Fig. 2 Research model
Performance expectancy has been one of the most consistent predictors of behavioral intention across technologies, including communication technologies [22]. It is defined as the degree of which using a technology will provide benefits to consumers [20]. The more individuals expect that using a technology will improve their performance, the more likely they are to use it [20]. This same pattern can be expected in the effect of performance expectancy on intention to use IoT service. H1. Performance expectancy having a positive effect on behavioral intention
The effort expectancy of the UTAUT model includes perceived ease of use and complexity [23]. Effort expectancy is defined as the degree of ease associated with consumers’ use of a technology [20]. Effort expectancy can be particularly important in the context of personal technologies and non-work place settings. The more IoT is perceived to take more effort to use, the less likely consumers are to use IoT services
H2. Effort expectancy having a positive effect on behavioral intention
Social influence can be an important factor if consumers need sufficient experience to feel confident about making independent decisions.
H3. Social influence having a positive effect on behavioral intention
The facilitating condition is defined as consumers' perception of the resources and support available to perform a behavior [20]. The facilitating condition has been somewhat unclear. Wang and Wang (2010) did not use facilitating condition in their modified UTAUT model and instead added three more constructs (perceived playfulness, perceived value, and self-efficacy) in their mobile internet adoption study [26]. Sundaravej (2004) tested the validity of the UTAUT model with a survey on the usage of Blackboard, an educational web-based software system [27]. He used eight constructs, including four original UTAUT factors and behavioral intention. Items of the facilitating condition construct in the survey were dropped from the further analysis because of the high correlation with other items from attitude, social influence, and self-efficacy. In a study of the online social support using instant messaging (IM) services [28], the results did not support a relationship between facilitating condition and online social support. On the contrary, in the study of a co-worker’s support for using an information system [29], the facilitating condition was an important factor for individual-level technology adoption. In the study of online social commerce [30], the facilitating condition was also a factor in influencing behavioral intention to use social commerce. Even though prior results have been mixed, the authors expect that facilitating conditions will be relevant to IoT technology use.
H4. Facilitating condition having a positive effect on behavioral intention
Every technology has both positive and negative aspects [17]. Negative aspects of technology can also lead to anxiety or techno-stress for consumers, which can serve as negative impacts on the adoption of IoT services. Ayyagari, Grover, and Purvis (2011) investigated the relationship between techno-stress and working professionals [31]. They found that technology characteristics such as usability, intrusiveness, and dynamism were closely related with techno-stress; they also found that work overload, no clear boundary between work and home, job insecurity, job ambiguity, and invasion of privacy were the main stresses from the use of innovative technologies. Tarafdar, Tu, Ragu-Nathan, and Ragu-Nathan (2011) listed five factors that create techno-stress: techno-invasion, techno-overload, techno-uncertainty, techno-insecurity, and techno-complexity, which led to adverse effects on information system use through the decreasing of both user satisfaction and user productivity [32]. Chen and Chang (2013) insisted that anxiety was a significant negative factor in attitudes toward the use of new technology, which was the most important factor for behavioral intentions in adopting NFC mobile phone services [23]. Therefore, we propose a negative response to IoT service.
H5. Hindering condition having a negative effect on behavioral intention
According to Fishbein’s theory [33], consumers’ intention to perform behaviors is correlated highly with both their attitudes toward the behaviors and their normative beliefs about the behaviors, multiplied by their motivation to comply with the norms. Therefore, behavioral intentions are correlated significantly with potential behavior.
H6. Behavioral intention has a positive effect on potential use behavior.
4.
Results and Discussion
4.1. Sample and data collection
population for the research were college students who were at least 19 years old and who were residing in metropolitan areas of Korea. 231 respondents were recruited to participate in this pilot research project, with a usable sample of 224.
Before answering a series of multi-item questions, the respondents watched a 100-second animation with Korean subtitles (https://youtu.be/RtuL6L9_cj8), which describes everyday life with IoT applications from getting up to commuting, working, shopping, and exercising. Respondents could find around 20 applications of IoT in the video: wireless line built in an automobile, smart watch and wristband, home security system, home smart heating system, smart lighting, contactless payment system with RFID technology, smart irrigation system, etc.
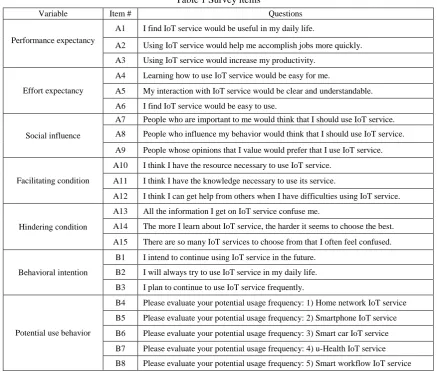
As we mentioned in the hypothesis development section, the questions and structures (performance expectancy, effort expectancy, social influence, facilitating condition, behavioral intention, potential use behavior) were derived from the original UTAUT scale developed by Venkatesh et al. (2012) [35], and additional questions to measure the hindering condition were adopted from Sproles and Kendall (1986)’s research [36]. Items were adapted and modified to reflect the characteristics of IoT application, where the original UTAUT items were based on the general evaluation of technology. Table 1 presents items used in the survey.
Table 1 Survey items
Variable Item # Questions
Performance expectancy
A1 I find IoT service would be useful in my daily life.
A2 Using IoT service would help me accomplish jobs more quickly. A3 Using IoT service would increase my productivity.
Effort expectancy
A4 Learning how to use IoT service would be easy for me.
A5 My interaction with IoT service would be clear and understandable.
A6 I find IoT service would be easy to use.
Social influence
A7 People who are important to me would think that I should use IoT service. A8 People who influence my behavior would think that I should use IoT service.
A9 People whose opinions that I value would prefer that I use IoT service.
Facilitating condition
A10 I think I have the resource necessary to use IoT service.
A11 I think I have the knowledge necessary to use its service.
A12 I think I can get help from others when I have difficulties using IoT service.
Hindering condition
A13 All the information I get on IoT service confuse me.
A14 The more I learn about IoT service, the harder it seems to choose the best.
A15 There are so many IoT services to choose from that I often feel confused.
Behavioral intention
B1 I intend to continue using IoT service in the future. B2 I will always try to use IoT service in my daily life.
B3 I plan to continue to use IoT service frequently.
Potential use behavior
B4 Please evaluate your potential usage frequency: 1) Home network IoT service
B5 Please evaluate your potential usage frequency: 2) Smartphone IoT service
B6 Please evaluate your potential usage frequency: 3) Smart car IoT service
B7 Please evaluate your potential usage frequency: 4) u-Health IoT service B8 Please evaluate your potential usage frequency: 5) Smart workflow IoT service
4.2. Reliability and validity
𝐶𝑟𝑜𝑛𝑏𝑎𝑐ℎ′𝑠 𝑎𝑙𝑝ℎ𝑎 = 𝑛2∗ 𝑚𝑒𝑎𝑛(𝐶𝑂𝑉)
∑(𝑉𝐴𝑅 𝐶𝑂𝑉)⁄ (1)
* n = the number of items in the scale, VAR = inter-item variance, COV = inter-item covariance
Table 2 Cronbach’s alpha and mean
Variable Alpha score Mean (Range) Number of items
Performance expectancy .720 3.912 (.594) 3
Effort expectancy .902 3.619 (.103) 3
Social influence .878 3.058 (.098) 3
Facilitating condition .687 3.320 (.397) 3
Hindering condition .841 2.960 (.241) 3
Behavioral intention .928 3.810 (.170) 3
Potential use behavior .718 3.711 (.746) 5
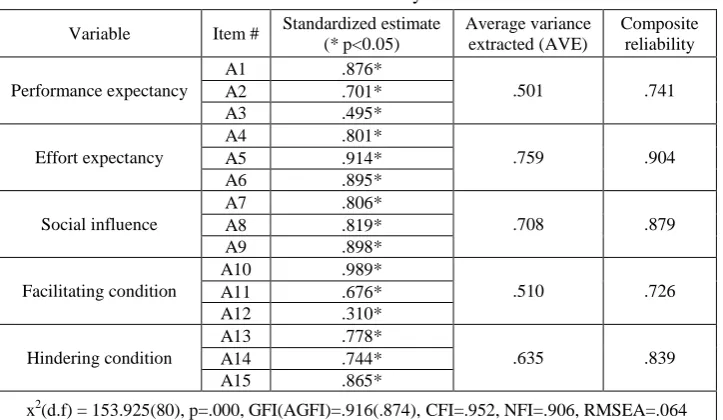
To test the validity of measures, exploratory factor analysis (EFA) was executed with the VARIMAX rotation option by using the principal component analysis (PCA) method. In the test, five factors explaining 75.28% of total variance were extracted successfully. Table 3 presents the results test.In addition, confirmatory factor analysis (CFA) was conducted to check both convergent validity and discriminant validity again [38]. Table 4 presents the results of CFA test.The figure showed that the model provided a good fit to the data. The x2 test provides that the research model generated x2= 153.925, degree of freedom (d.f) = 80, p value=.000, which indicates a marginal fit (normed x2=1.924). Because this x2 test is sensitive to sample size (n=224 in this study), supplementary measures have been developed. The other goodness-of-fit indices showed a good fit within an accepted exhortation level. The goodness of fit index (GFI) is acceptable at. 916 (>.900), the comparative fit index (CFI) is acceptable at. 952 (>.900), and also the normed fit index (NFI) is acceptable at .906 (>.900). The root mean square error of approximation (RMSEA) is.064 (<.080). The analysis outcome proved that the research model and the data were suitable for further analysis [39].
Table 3 CFA analysis
Variable Item # Standardized estimate
(* p<0.05)
Average variance extracted (AVE)
Composite reliability
Performance expectancy
A1 .876*
.501 .741
A2 .701*
A3 .495*
Effortexpectancy
A4 .801*
.759 .904
A5 .914*
A6 .895*
Socialinfluence
A7 .806*
.708 .879
A8 .819*
A9 .898*
Facilitatingcondition
A10 .989*
.510 .726
A11 .676*
A12 .310*
Hinderingcondition
A13 .778*
.635 .839
A14 .744*
A15 .865*
x2(d.f) = 153.925(80), p=.000, GFI(AGFI)=.916(.874), CFI=.952, NFI=.906, RMSEA=.064
4.3. Hypothesis test
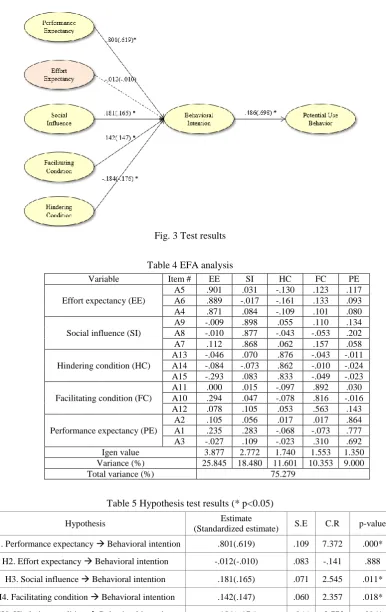
As indicated in Table 5 and Fig. 3, performance expectancy, social influence, and facilitating condition positively affect behavioral intention, supporting H1, H3, and H4, respectively. The hindering condition affects behavioral intention negatively, supporting H5. The results also show a positive and significant relationship between behavioral intention and potential use behavior, supporting H6. However, the relationship between effort expectancy and behavioral intention was not supported, rejecting H2.
Fig. 3 Test results
Table 4 EFA analysis
Variable Item # EE SI HC FC PE
Effort expectancy (EE)
A5 .901 .031 -.130 .123 .117
A6 .889 -.017 -.161 .133 .093
A4 .871 .084 -.109 .101 .080
Social influence (SI)
A9 -.009 .898 .055 .110 .134
A8 -.010 .877 -.043 -.053 .202
A7 .112 .868 .062 .157 .058
Hindering condition (HC)
A13 -.046 .070 .876 -.043 -.011
A14 -.084 -.073 .862 -.010 -.024
A15 -.293 .083 .833 -.049 -.023
Facilitating condition (FC)
A11 .000 .015 -.097 .892 .030
A10 .294 .047 -.078 .816 -.016
A12 .078 .105 .053 .563 .143
Performance expectancy (PE)
A2 .105 .056 .017 .017 .864
A1 .235 .283 -.068 -.073 .777
A3 -.027 .109 -.023 .310 .692
Igen value 3.877 2.772 1.740 1.553 1.350
Variance (%) 25.845 18.480 11.601 10.353 9.000
Total variance (%) 75.279
Table 5 Hypothesis test results (* p<0.05)
Hypothesis Estimate
(Standardized estimate) S.E C.R p-value
H1. Performance expectancy Behavioral intention .801(.619) .109 7.372 .000*
H2. Effort expectancy Behavioral intention -.012(-.010) .083 -.141 .888
H3. Social influence Behavioral intention .181(.165) .071 2.545 .011*
H4. Facilitating condition Behavioral intention .142(.147) .060 2.357 .018*
H5. Hindering condition Behavioral intention -.184(-.176) .066 -2.773 .006*
5.
Discussion
In comparing standardized β in Table 5, performance expectancy is the most important predictor relative to other factors. It implies that the promise of customer benefits made by IoT technologies to be the primary determinant of consumers’ use of IoT technologies. Social influence is another important determinant. Early adopters of new technologies tend to be young, and they are heavy users of social media and easily affected by social influence. Therefore, it is important to consider social influence factors, such as social media, word-of-mouth and peer group’s influence, to encourage the adoption of IoT technologies.
This study also found that both positive and negative factors affect the acceptance of IoT technologies separately, supporting the previous research about satisfiers and dissatisfiers of technology experiences [6, 18]. The UTAUT-H model reveals the negative and direct effect of the hindering condition on behavioral intention to use IoT technologies. This new finding indicates that marketers should provide potential customers with solutions to alleviate their worries and uncomfortable feelings as they consider adopting novel technologies.
Unexpectedly, effort expectancy is not a significant predictor. In the recent research about other technologies, such as smartphone applications [41], smartphone shopping [42], mobile marketing [43], the relationship proved to be positive and significant repeatedly. One possible explanation for the insignificant effect of effort expectancy on behavioral intention lies in the unique technological characteristics of IoT service. IoT services are relatively smart, ubiquitous and highly interactive. As a result, IoT services can be implemented automatically without asking for any kind of effort from the consumers. For instance, people may not need knowledge and special skills to drive a smart car. Consumers hardly understand the IoT technology itself, but they still can enjoy the services with very little effort.
6.
Conclusion
The paper tries to analyze the factors affecting consumers’ acceptance of IoT applications after developing extended UTAUT-H model. The empirical results confirm the usefulness and robustness of the extended UTAUT model this paper developed. This paper identified an additional factor that can be used to explain the complex attitude of consumer and leads to better understanding of consumer behavior in IoT acceptance context. This paper finds that performance expectancy, social influence, facilitating condition and hindering condition is predictive of consumer intention toward using the technologies.
In comparing standardized β, performance expectancy is the most important predictor relative to other factors. It implies that the promise of customer benefits made by IoT technologies to be the primary determinant of consumers’ use of IoT technologies. Social influence is another important determinant. Early adopters of new technologies tend to be young, and they are heavy users of social media and easily affected by social influence. Therefore, it is important to consider social influence factors such as social media, word-of-mouth and peer group’s influence to encourage the adoption of IoT technologies.
This study also found that both positive and negative factors affect the acceptance of IoT technologies separately, supporting the previous researches about satisfiers and dissatisfiers of technology experience [6, 18]. The modified UTAUT model reveals the negative and direct effect of hindering condition on behavioral intention to use IoT technologies. This new finding indicated that marketers should provide potential customers with solutions to get rid of their worries and uncomfortable feelings as they consider to adopt very new technologies.
of consumers’ efforts. For instance, people may not need knowledge and special skills to drive a smart car. Consumer hardly understands the IoT technology itself, but they still can enjoy the service with very little effort.
This paper has some research limitation. First, the IoT service is not on the market yet, and as a result, the respondents should answer many questions based on their imaginations. To partly solve the limitation, this research used ‘information acceleration’ and asked them to watch a short movie about IoT service. In order to get more realistic data, we may need further research after successful commercialization of IoT service. Second, the focus was only on Korea consumer, although IoT adoption is a global agenda. It is recommended that further research should expand the boundaries and includes more nations into the research in order to generalize the empirical research results.
References
[1] S. Shin and B. Eksioglu, “An empirical study of RFID productivity in the U.S. retail supply chain,” International Journal of Production Economics, vol. 163, pp. 89-96, May 2015.
[2] W. Dutton, “Putting things to work: social and policy challenges for the internet of things,” Info, vol. 16, no. 3, pp. 1-21, May 2014.
[3] S. DuBravac and C. Ratti,”The internet of things: evolution or revolution?,” AIG White Paper,
http://www.aig.com/Chartis/internet/US/en/AIG%20White%20Paper%20-%20IoT%20English%20DIGITAL_tcm3171-677828_tcm3171-698578.pdf, April 10, 2017.
[4] J. Bradley, J. Barbier, and D. Handler, “Embracing the internet of everything to capture your share of $14.4 trillion,” http://www.cisco.com/c/dam/en_us/about/ac79/docs/innov/IoE_Economy.pdf, March 7, 2017.
[5] E. Fleisch, “What is the internet of things? an economic perspective,” Economics, Management, and Financial Markets, vol. 5, no. 2, pp. 125-157, January 2010.
[6] D. Johnson, F. Bardhi, and T. Dunn, “Understanding how technology paradoxes affect customer satisfaction with self-service technology: the role of performance ambiguity and trust in technology,” Psychology & Marketing, vol. 25, no. 5, pp. 416-443, April 2008.
[7] H. Waltzman and L. Shen, “The internet of things,” Intellectual Property & Technology Law Journal, vol. 27, no.7, pp. 19-21, July 2015.
[8] S. Kim and S. Kim, “A multi-criteria approach toward discovering killer IoT application in Korea,” Technological Forecasting & Social Change, vol. 102, pp. 143-155, January 2016.
[9] K. Ashton, “That ‘Internet of Things’ thing,” RFID Journal, vol. 22, pp. 97-114, June 2009.
[10] C. Peoples, G. Parr, S. Mcclean, B. Scotney, and P. Morrow, “Performance evaluation of green data centre management supporting sustainable growth of the internet of things,” Simulation Modelling Practice and Theory, vol. 34, pp. 221-242, May 2013.
[11] E. Borgia, “The internet of things vision: key features, applications and open issues,” Computer Communications, vol. 54, pp. 1-31, December 2014.
[12] McKinsey & Company, “The internet of things: opportunities and challenges for semiconductor companies,” http://www.mckinsey.com/insights/innovation/internet-of-things-opportunities-and-challenges-for-semiconductor- companies, March 22, 2017.
[13] Y. Chang, X. Dong, and W. Sun, “Influence of characteristics of the internet of things on consumer purchase intention,” Social Behavior and Personality, vol. 42, no.2, pp. 321-330, March 2014.
[14] L. Gao and X. Bai, “A unified perspective on the factors influencing consumer acceptance of internet of things technology,” Asian Pacific Journal of Marketing and Logistics, vol. 26, no. 2, pp. 211-231, May 2014.
[15] P. Andersson and L-G. Mattsson, “Service innovations enabled by the internet of things,” IMP Journal, vol. 9, no. 1, pp. 85-106, January 2015.
[16] L. Winner, “Three paradoxes of the information age,” In G. Bender and T. Druckery (Eds.), Culture on the brink: ideologies of technology, pp. 191-197, 1994.
[17] D. Mick and S. Fournier, “Paradoxes of technology: consumer cognizance, emotions, and coping,” Journal of Consumer Research, vol. 25, pp. 123-143, September 1998.
[18] T. Friedman, The world is flat: a brief history of the twenty-first century, New York: Farrar, Straus, and Giroux, 2005. [19] FTC, “Internet of things,”
[20] V. Venkatesh, M. Morris, G. Davis, and F. Davis, “User acceptance of information technology: toward a unified view,” MIS Quarterly, vol. 27, no. 3, pp. 425–478, September 2003.
[21] K. Walz, “Stress related issue due to too much technology: effects on working professionals,” Johnson & Wales University, Providence, RI, 2012.
[22] E. Karahanna and D. Straub, “The psychological origins of perceived usefulness and ease of use,” Information and Management, vol. 35, no. 4, pp. 237–250, April 1999.
[23] K-Y. Chen and M-L. Chang, “User acceptance of ‘near field communication’ mobile phone service: an investigation based on the ‘unified theory of acceptance and use of technology’ model,” The Service Industries Journal, vol. 33, no.6, pp. 609-623, October 2013.
[24] M. Lee, C. Cheung, C. Sia, and K. Lim, “How positive information social influence affects consumers’ decision of internet shopping?,” Proc. 39th Hawaii International Conference on System Sciences, January 2016.
[25]X. Dong, Y. Chang, Y. Wang, and J. Yan, “Understanding usage of internet of things (IoT) systems in China: cognitive experience and affect experience as moderator,” Information Technology & People, vol. 30, no. 1, pp. 117-138, January 2017.
[26]H. Wang and S. Wang, “User acceptance of mobile Internet based on the unified theory of acceptance and use of technology: investigating the determinants and gender differences,” Social Behavior and Personality, vol. 38, no. 3, pp. 415-426, April 2010.
[27]T. Sundaravej, “Empirical validation of unified theory of acceptance and use technology model,” Journal of Global Information Technology Management, vol. 13, no. 1,pp. 5-27, 2004.
[28]C. Lin and B. Anol, “Learning online social support: an investigation of network information technology based on UTAUT,” CyberPsychology & Behavior, vol. 11, no. 3, pp. 268-272, June 2008.
[29]T. Sykes, V. Venkatesh, and S. Gosain, “Model of acceptance with peer support: a social network perspective to understand employees’ system use,” MIS Quarterly, vol. 33, no. 2, pp. 371-393, June 2009.
[30]R. Gatautis and A. Medziausienem, “Factor affecting social commerce acceptance in Lithuania,” Procedia – Social and Behavior Sciences, vol. 110, pp. 1235-1241, January 2014.
[31]R. Ayyagari, V. Grover, and R. Purvis, “Technostress: technical antecedents and implications,” MIS Quarterly, vol. 35, no.4, pp. 831-858, December 2011.
[32]M. Tarafdar, Q. Tu, T. Ragu-Nathan, and B. Ragu-Nathan, “Crossing to the dark side: examining creators, outcomes, and inhibitors of technostress,” Communications of ACM, vol. 54, no. 9, pp. 113-120. September 2011.
[33]M. A. Fishbein, “A theory of reasoned action: some applications and implications,” University of Nebraska Press, in press. [34]Trend E-Magazine, “Trend #6: The internet of things begins to take shape,” Trend E-Magazine, pp. 35-40, 2014.
[35]V. Venkatesh, J. Thong, and X. Xu, “Consumer acceptance and use of information technology: extending the unified theory of acceptance and use of technology,” MIS Quarterly, vol. 36, no. 1, pp. 157-178, March 2012.
[36]G. Sproles and E. Kendall, “A methodology for profiling consumers’ decision making styles,” Journal of Consumer Affairs, vol. 20, no. 2, pp. 267-279, 1986.
[37]J. Nunnally, Psychometric theory, New York: McGraw-Hill, 1967.
[38]J. Anderson and D. Gerbing, “Structural equation modeling in practice: a review and recommend two-step approach,” Psychological Bulletin, vol. 103, no.3, pp. 411-423, May 1988.
[39]R. Bagozzi and Y. Yi, “On the evaluation of structural equation models,” Journal of the Academy of Marketing Science, vol. 16, no.1, pp. 74-94, Spring 1988.
[40]R. Schumacker and R. Lomax, A beginner’s guide to structural equation modeling, Lawrence Earlbaum Associated, Mahwah, NJ, 2004.
[41]H. Lee, T. Kim, and J. Choi, “A study of the factors affecting smartphone application acceptance,” 3rd International Conference on e-Education, e-Business, e-Management and e-Learning, 2012, IPEDR vol. 27, pp. 27-34.
[42]K. Yang and J. C. Fomey, “The moderating role of consumer technology anxiety in mobile shopping adoption: deferential effects of facilitating conditions and social influence,” Journal of Electronic Commerce Research, vol. 14, no. 4, pp. 334-347, 2013.
[43]Y. C. Kiat, B Samadi, and H. Hakimian, “Consumer behavior towards acceptance of mobile marketing,” International Journal of Business and Social Science, vol. 8, no. 4, pp. 92-105, 2017.
Copyright© by the authors. Licensee TAETI, Taiwan. This article is an open access article distributed under the terms and conditions of the Creative Commons Attribution (CC BY-NC) license