R E S E A R C H A R T I C L E
Open Access
A combined algorithm for T-wave alternans
qualitative detection and quantitative
measurement
XiangKui Wan
1*, Kanghui Yan
1, Dehan Luo
1and Yanjun Zeng
2*Abstract
Background:T-wave alternans (TWA) provides a noninvasive and clinically useful marker for the risk of sudden cardiac death (SCD). Current most widely used TWA detection algorithms work in two different domains: time and frequency. The disadvantage of the spectral analytical techniques is that they treat the alternans signal as a stationary wave with a constant amplitude and a phase. They cannot detect non-stationary characteristics of the signal. The temporal domain methods are sensitive to the alignment of the T-waves. In this study, we sought to develop a robust combined algorithm (CA) to assess T-wave alternans, which can qualitatively detect and quantitatively measure TWA in time domain.
Methods:The T wave sequences were extracted and the total energy of each T wave within the specified time-frequency region was calculated. The rank-sum test was applied to the ranked energy sequences of T waves to detect TWA qualitatively. The ECG containing TWA was quantitatively analyzed with correlation method. Results:Simulation test result proved a mean sensitivity of 91.2% in detecting TWA, and for the SNR not less than 30 dB, the accuracy rate of detection achieved 100%. The clinical data experiment showed that the results from this method vs. spectral method had the correlation coefficients of 0.96.
Conclusions:A novel TWA analysis algorithm utilizing the wavelet transform and correlation technique is
presented in this paper. TWAs are not only correctly detected qualitatively in frequency domain by energy value of T waves, but the alternans frequency and amplitude in temporal domain are measured quantitatively.
Keywords:T-wave alternans, Continuous wavelet transform, Rank-sum test, Quantitive estimation
Background
Sudden cardiac death (SCD), frequently ascribed to sus-tained ventricular arrhythmias, is one of the leading causes of mortality. American Heart Association claims approximately 350,000 lives annually in the US (approxi-mately one every 1.7 minutes). Accurate identification of patients at increased risk for sustained ventricular arrhythmias is critical for the development of effective strategies to prevent SCD.
Traditionally, left ventricular ejection fraction was used to identify high-risk individuals and to assess the utility of
the prophylactic administration of antiarrhythmic agents [1]. However, this strategy has no survival benefit [2]. There is now evidence that implantation of an internal cardioverter-defibrillator (ICD) in patients who are yet to experience sustained ventricular arrhythmias can improve survival [3-5]. But the costs and risks of indiscriminate application of ICD therapy may be unacceptably high. Some of the non-invasive tests related to high-risk SCD include ventricular late potentials and QT dispersion. However, the positive predictive value of these tests is too low to consider them as sufficient to make a decision about specific treatment, especially defibrillator implantation. The challenge is to develop new selective non-invasive methods which will allow the identification of high-risk patients before a major arrhythmic event occurs.
* Correspondence:[email protected];[email protected]
1School of Information Engineering, Guangdong University of Technology, Guangzhou 510006, China
2Biomedical Engineering Center, Beijing University of Technology, Beijing 100022, China
Recently, the T-wave alterenans (TWA) has been consi-dered as one of the most promising markers, which allows identification patients at an increased risk for ventricular arrhythmia [6-13]. TWA is a phenomenon appearing in the ECG as a consistent fluctuation in the repolarization morphology on an“every-other-beat” basis (2:1 behavior). This fluctuation refers to a beat-to-beat variability in the amplitude of the T wave or ST segment. Numerous clinical studies have demonstrated the link between these oscilla-tions and ventricular arrhythmias.
Current most widely used TWA detection algorithms work in two different domains: time and frequency.
Energy Spectral Method published by Adam et al. in 1981 [7] is the first quantitative studies relating TWA with myocardial instability. After that many researchers have presented many different algorithms based on it, such as Spectral Method (SM) [8], Complex Demodula-tion [9], and Karhunen-Loève Transform [10]. The spec-tral analytical techniques permit the registration of the alternans along the T wave by analysis of the power spectrum for each sample point. The disadvantage of the methods is that they treat the alternans signal as a sta-tionary wave with a constant amplitude and a phase, which is not true in general. They cannot detect non-stationary characteristics of the signal.
The typical time-domain methods include Modified Moving Average method [11] and Correlation Method [12]. Time domain methods has also been used on Holter data, and it can detect TWA in short-time, non-stationary electrocardiogram (ECG) signal. But the higher quality of ECG signal is required, and the reliability and robustness of the algorithms need be improved further.
Besides above reported methods, several nonlinear methods and statistical methods of detection TWA are also presented, such as Laplacian Likelihood Ratio Method, Statistical Tests Method, Poincaré Mapping Method. The use of the methods as an immediate pre-dictor of adverse cardiac events has, as far as the authors are aware, not been reported to date.
The wavelet transform has emerged over recent years as a powerful time–frequency analysis and signal coding tool favored for the interrogation of complex nonstation-ary signals. The continuous wavelet transform (CWT) has been used successfully in the processing of ECG sig-nals, and offers significant advantages—in particular the preservation of feature-specific locations [13]. And Inaki used a wavelet transform-based methodology to detect the TWA in ECG qualitatively [14].
The continuous wavelet transform (CWT)
The continuous wavelet transform is a time–frequency analysis method. It differs from the traditional short time Fourier transform by allowing arbitrarily high lo calization in time of high frequency signal features. The
CWT is able to decompose a signal into different fre-quency components and one can study each of them with a different resolution, and a large selection of loca-lized waveforms can be employed as long as they satisfy predefined mathematical criteria (described below). The wavelet transform of a continuous time signal, x(t), is defined as:
T að ;bÞ ¼ 1ffiffiffi a p
Z þ1
1 x tð ÞΨ tb
a
dt ð1Þ
where Ψ*(t) is the complex conjugate of the analysing wavelet function Ψ*(t),α is the dilationparameter of the wavelet andbis the location parameter of the wavelet.
The contribution to the signal energy at the specificα
scale and b location is given by the two-dimensional
wavelet energy density function known as the scalogram:
E að ;bÞ ¼jT að ;bÞj2 ð2Þ In this paper we concern with the CWT as it allows arbi-trarily high resolution in the time–frequency plane that has been found especially useful in the analysis of com-plex biosignals, most notably the ECG [15].
Methods
ECG signal preprocess
Broadly speaking, ECG contaminants can be classified into the following categories:
power line interference
baseline wandering
electrode pop or contact noise
patient–electrode motion artifacts
The power line interference is narrow-band noise cen-tered at 60 Hz (or 50 Hz) with a bandwidth of less than 1 Hz, and an aptive notch filter is used to remove it [16]. Baseline wandering is estimated with a third order spline fitted to successive TP intervals. The spline is then sub-tracted from the ECG. The other noise and artifacts are suppressed by wavelet-based denoise technique [17].
The R peaks are located using the modulus maximum pair of wavelet transform. The stability of the heart rate is tested (standard deviation of RR < 10% mean RR). This test was designed to exclude ECGs with large RR varia-tions, since the morphology of the T wave may be affected by a sudden change in heart rate.
Combined Algorithm (CA)
the energy spectrums of T waves, which can be calcu-lated by formula (2), appear the same fluctuation. And the values obtained are separated into two groups, corre-sponding to odd and even T-waves. Obviously, the two groups can be considered as two independent samples with unknown distribution, which meets the require-ment of Wilcoxon Rank Sum test. So the Wilcoxon rank sum test was considered appropriate for the statistical analysis to obtain the probability that the groups come from the same population.
According to reference [14], the qualitative detection algorithm is described as follows.
1) When R peaks are detected by modulus maximum pair of wavelet transform, the mean RR intervals are calculated. And the ECG time-frequency information can be obtained.
2) Take the R peak as a fiducial point, T wave onset is calculated by formula (3) [18]
Tsk¼40þ1:33pffiffiffiffiffiffiffiffiRRk ms ð3Þ
Wherekis thekth T wave,k= 1, 2,⋯. And the width of analyzed T wave window is 400 ms. A temporal interval of 400 ms fromTskis considered to delimitate the whole T-wave.
3) The frequency range of T wave is defined as being between 0.5 and 10 Hz.
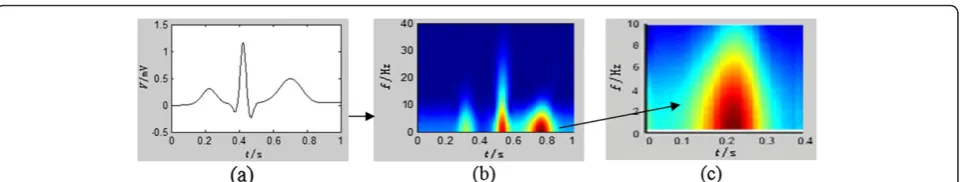
4) For each delimited time–frequency region in the wavelet transform time–frequency plane, corresponding to the T wave, the total energy contained within the selected time–frequency region is calculated by formula (2) and extracted, which was shown as Figure1.
5) All the energy values obtained are separated into two groups, corresponding to odd and even T waves. Then the Wilcoxon rank-sum test was applied to the two groups of values, and the probability that the groups come from the same population is then calculated. If the probability is below 0.05 (P< 0.05), that means the two groups are assumed to come from different populations and a TWA is deemed to
have been detected. Otherwise, the signal is classified as exhibiting no TWA.
For the detected ECG signal existing TWA, A correl-ation technique is used to measure TWA quantificcorrel-ation- quantification-ally [12].
1) The median T wave (Tm) is computed from the
consecutive T waves of the detected ECG signal existing TWA.
Tm¼
XN
i¼1
Ti=N ð4Þ
Where N is the total number of T waves from the analyzed ECG signal.
2) An alternans correlation index (ACIi) is computed to measure morphological changes of each of the consecutiveTjwaves in comparison toTm.
ACIi¼
XM
j¼1
Tið ÞjTmð Þj
XM
j¼1 Tmð Þj
½ 2
ð5Þ
WhereMis the number of sampling points of each T wave. TheACIiindicates the alternans level ofTj
in comparison toTm. If there exists at least 7
consecutive T waves whoseACIiare alternating, then
TWA start is considered in the firstTwave of the consecutive T waves. And the TWA stop is considered in the last T wave of the consecutive T waves.
3) The TWA amplitude (ACAi) forTiwave can be
calculated using the formula (6):
ACAi¼2jACIi1j
XM
j¼1Tm j
ð Þ2
XM
j¼1Tm j
ð Þ
ð6Þ
And the median TWA amplitude (ACA) for the ana-lyzed data is calculated by the formula (7)
― ACA¼
XN
i¼1
ACAi
N ð7Þ
Since Correlation technique tracked T waves in time, it was able to detect short-time T wave ampli-tude changes, as well as the number and the length of alternating segments in the series of beats, and the number percent of alternating T waves, which means it can quantificationally analysis the TWA in time domain.
Simulated data
In actual ECG recordings, the exact value and timing of the TWA episodes are unknown. And such signals can-not be used to test algorithms. For that reason artificial ECG with added synthetic TWA are used to test the algorithms in this paper.
The artificial ECG model is defined as formula (8).
S¼eþk:aþl:w ð8Þ
Where S is the artificial ECG,eis the clean ECG signal obtained as the periodic repetition of a single beat, which guarantees that all the T waves are identical and so no TWA can be present in the original signal.ais the TWA episode, k is the alternans level, w is the noise, and l is the mixed noise factor. For the artificial ECG, four different noise sources have been considered: simu-lated Gaussian white noise, and three records of physio-logical noise from the MIT-BIH Noise Stress Test database: baseline wandering, muscular activity; elec-trode motion.
The specific obtained process of artificial ECG (i.e., S) is described as below.
1) A healthy subject underwent 10-min ECG recording sampled at 500 Hz and quantified with 5μV/LSB in resting conditions, and a heartbeat, duration of 1 second, is selected. The clean ECG is formed by periodic repetition of a single beat 1000 times. The other 4 clean ECG segments from other 4 healthy subjects are formed in the same way. Then 5 clean ECG segments are obtained.
2) The shape of Gaussian function and its first order derivative (half of the whole waveform) are used as the alternans waveform separately. And there are five different alternans level for each alternans waveform, i.e. 10, 20, 50, 100, 200μV. So 10 different TWA can be obtained, which are added the every T wave of above 5 clean ECG segments. And 50 ECG segments containing TWA are synthesized.
3) After linear superposition of above mentioned four different noises, the mixed noise are added to the artificial 50 ECG segments containing TWA. By adjusting the mixed noise factorlto different level, Signal-to-noise ratios are 20, 25, 30, 35 and 40 dB. And finally 250 noised ECG segments containing TWA (S=e+k·a+l·w) are obtained.
Clinical data
The sudden cardiac death holter database and the Euro-pean ST-T database are used as the clinical data sources. These databases are chosen by two reasons: firstly, previ-ous studies found T-wave alternans episodes, some of them related to annotated ischemic episodes. Secondly, the databases are well-known and available by many re-search groups.
In the specific, a group of twenty five patients, who survived an acute myocardial infarction were considered. Each subject underwent 30-min ECG recording in rest-ing conditions. And ECG segments were randomly extracted.
Performance assessment
The detector performance needs to be evaluated with re-gard to the detection rate duration and magnitude of detected episodes. The validation of the detector should begin with a comparison of the simulated TWA episodes and the detector output in terms of sensitivity (Se). The sensitivity is defined as the number of correctly detected episodes divided by the total number of simulated epi-sodes, i.e.
Se¼ TP
TPþFN100% ð9Þ
Where TP is the number of true positive, i.e., the num-ber of correctly detected ECG segments containing TWA. FN is the number of false negative, i.e., the num-ber of missed ECG segments containing TWA.
Results
Simulated data test
The TWA detection algorithm described in the previous section was tested with the 250 artificial ECG test set.
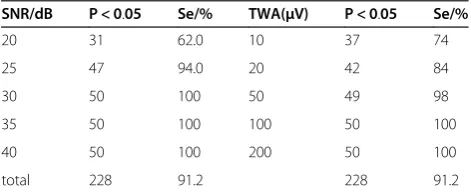
Table 1 Qualitative detection experiment data
SNR/dB P < 0.05 Se/% TWA(μV) P < 0.05 Se/%
20 31 62.0 10 37 74
25 47 94.0 20 42 84
30 50 100 50 49 98
35 50 100 100 50 100
40 50 100 200 50 100
The algorithm classified as TWA (p <0.05) 228 (91.20%) of the overall simulated ECGs, i.e., the number of true positives was 228 and the number of false negatives was 22. the Sensitivity of the algorithm was 91.2%. the de-tection results under different SNR and alternans levels were shown in Table 1.
We can find from the Table 1 that the algorithm clas-sified (i.e., p <0.05) 100.00% of the signals containing TWA when the SNR is above 30. Alternatively, consider-ing now the effect of the amplitude of the artificial TWA added to the signal, the algorithm classified as contain-ing TWA 100.00% of the artificial TWA with amplitudes of 100μV, 98% with 50μV.
We also find statistically that the algorithm classified 92.0% of the signals with no added noise as containing TWA under different SNR (SNR = 20, 25, 30, 35, 40).
Further, the quantitative measurement of TWA was implemented to above qualitative detected ECG seg-ments. The results were shown in Table 2.
Given the simulated TWA amplitude, the relative error (RE) of TWA measurement is defined as follows
RE¼ðAtwaAÞ=Atwa ð10Þ
WhereAtwais the simulated TWA amplitude, andA is
the measured TWA amplitude. RE represented the
de-viation percent ofA fromAtwa.
The combined algorithm and SM gave the detection result for the same simulated ECG segment with 30db SNR in Table 3. (ASM: the measured TWA amplitude by SM).
We can found that the CA got the smaller RE com-pared with SM. A―CAwas greater than ASM (220%), and less than simulated TWA(75%), and the measured TWA value was closer true TWA value.
Clinical data test
The algorithm was used for the analysis of real ECGs selected from the above mentioned clinical database.
1-min lengths of ECG were considered that gave between 60 and 80 beats for normal sinus rhythm. And 30 segments of the 1-min length ECG signal were extracted from the selected patients, the sudden cardiac death holter database and the European ST-T database separately. They were analyzed using the algorithm described in Section III and SM separately. And the Partial results are shown in Table 4.
And the A―CA vs. ASM for the clinical data have the correlation coefficients of 0.96, which was shown as Figure 2.
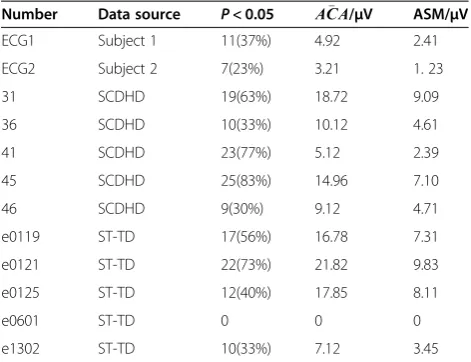
For the patients of number 31, 41, 45, and e0121 in Table 4, the TWA presence frequency in measured ECG segments was above 70%. Consider that TWA is regarded as a marker for sudden cardiac death. These patients should be monitored in particular.
Figure 2Measured TWA amplitude of CA vs. SM.
Table 4 Test results of partial samples
Number Data source P< 0.05 ACA /μV ASM/μV
ECG1 Subject 1 11(37%) 4.92 2.41
ECG2 Subject 2 7(23%) 3.21 1. 23
31 SCDHD 19(63%) 18.72 9.09
36 SCDHD 10(33%) 10.12 4.61
41 SCDHD 23(77%) 5.12 2.39
45 SCDHD 25(83%) 14.96 7.10
46 SCDHD 9(30%) 9.12 4.71
e0119 ST-TD 17(56%) 16.78 7.31
e0121 ST-TD 22(73%) 21.82 9.83
e0125 ST-TD 12(40%) 17.85 8.11
e0601 ST-TD 0 0 0
e1302 ST-TD 10(33%) 7.12 3.45
Table 3 TWA detection results of CA and SM
TWA/μV ACA ASM REACA/% REASM/%
10 7.5 3.4 25 66
20 15 6.9 25 65.5
50 37.8 17.4 24.4 65.2
100 75.2 34.8 24.8 65.2
200 152 69.6 24 65.2
Table 2 quantitative measurement TWA (unit:μV)
Simulated TWA
Max alternans amplitudes
Min alternans amplitudes
Mean
ACA
10 8.01 7.21 7.53
20 15.95 14.67 15.35
50 38.30 37.02 37.59
100 76.19 74.12 75.21
Discussion
The definitions of T-wave onset and offset are not con-sistent in different literatures, and T wave is easily affected by the interference due to its lower frequency and morphological diversity. An empirical value method is used for extracting T wave in this paper [18]. The em-pirical value method may induce erroneous judgement in cases of RT interval variability, but it can avoid the difficulties to determine the onset and offset of T wave, and significantly reduce T wave detection calculation. For this paper T wave energy is required to be extracted, while the T wave energy is mainly concen-trated in the middle part of the T wave, and its energy near T-wave onset and offset is very small, so the possi-bility of erroneous judgment caused by RT interval variability is reasonable small. Two segments of ECG data from the experimental signal were randomly extracted, which are used in the simulation test. The RT intervals are prolongation of 10 ms and shorten 10 ms, respectively, we found that the T wave energy
extracted changes were less than 1%, and the
Wil-coxon rank sum test results is no change, which showed that using empirical value method to extract T wave is proper.
The simulated ECG is obtained as a K-fold repetition of a single beat extracted from a real ECG. A pertur-bation, which waveform is generated by the Gaussian function, is added every other T-wave in this artificial ECG to simulate a TWA. And the amplitude of the added signal can be controlled. Four different noise sources from Gaussian white noise and physiological noise have been considered. The artificial ECG has the maximum approximation to clinical ECG, which guaran-tees the experimental results with the credibility. The ECG simulation scheme can be considered for perform-ance evaluation of other TWA detection algorithms.
Conclusions
TWA study has the important research value. An exten-sive scientific and clinical literature points to a funda-mental link between TWA and susceptibility to life-threatening ventricular arrhythmias. Although some advances have been made in the TWA detection, it remains troubling to test TWA in the ambulatory ECG signals.
In this paper using the nonparametric test method combining with the CWT and correlation technique, a novel TWA detector algorithm was presented. The algo-rithm was validated using simulated ECG signals with artificial TWA of various amplitudes and noise levels. And for the clinical data test, SM was involved to detect and measure the same data with the algorithm, and their results have the greatly high correlation. TWAs were not only correctly detected qualitatively in frequency
domain by energy value of T waves, but the alternans frequency and amplitude in temporal domain were measured by calculatingACIiand A―CA.
Abbreviations
TWA: T-wave alternans; SCD: Sudden cardiac death; ICD: Internal cardioverter-defibrillator; SM: Spectral method; CWT: Continuous wavelet transform; ECG: Electrocardiogram; CA: Combined algorithm; ACI: Alternans correlation index; ACA: TWA amplitude.
Competing interests
The authors declare that they have no competing interests.
Authors’contributions
XW and YZ carried out the study design and drafted the manuscript, KY collected patients’data, DL participated in the design of the study. All authors read and approved the final manuscript.
Acknowledgements
This work was supported by the National Nature Science Foundation of China (No. 60901027).
Received: 10 January 2012 Accepted: 7 January 2013 Published: 14 January 2013
References
1. Bigger JT, Fleiss JL, Kleiger R,et al:The relationship among ventricular arrhythmias, left ventricular dysfunction and mortality in the 2 years after myocardial infarction.Circulation1984,69:250–258.
2. Echt DS, Liebson PR, Mitchell LB,et al:Mortality and morbidity in patients receiving encainide, flecainide, or placebo.N Engl J Med1991,
324:781–788.
3. Michael JC, David SR:Explaining the clinical manifestations of T wave alternans in patients at risk for sudden cardiac death.Hear Rhythm2009,
6:22–28.
4. Gustavo L, Anne BC:Risk stratification for sudden cardiac death: current approaches and predictive value.Curr Cardiol Rev2009,5:56–64. 5. Moss AJ, Zareba W, Hall WJ,et al:Prophylactic implantation of a
defibrillator in patients with myocardial infarction and reduced ejection fraction.N Engl J Med2002,346:877.
6. Zareba W, Moss AJ:Noninvasive risk strtification in postinfarction patients with severe left ventricular dysfunction and methodology of the MADIT II noninvasive electrophysiology substudy.J Electocardiol2003,
36:101–108.
7. Adam DR, Akselrod S, Cohen RJ:Estimation of ventricular vulnerability to fibrillation through T-wave time series analysis.Comput Cardiol1981,
8:307–310.
8. Smith JM, Clancy EA, Valeri CR,et al:Electrical alternans and cardiac electrical instability.Circulation1988,77(1):110–121.
9. Nearing BD, Huang AH, Verrier RL:Dynamic tracking of cardiac vulnerability by complex demodulation of the T wave.Science1991,
252:437–440.
10. Laguna P, Ruiz M, Moody GB,et al:Repolarization alternans detection using the KL transform and the beatquency spectrum.Computing in Cardiology1996,23:673–676.
11. Nearing BD, Verrier RL:Modified moving average analysis of T-wave alternans to predict ventricular fibrillation with high accuracy.
J Appl Physiol2002,92:541–549.
12. Burattini L, Zareba W, Moss AJ:Correlation method for detection of transient T-wave alternans in digital Holter ECG recordings. Annals of Noninvasive.Electrocardiology1999,4(4):416–426.
13. Addison PS, Watson JN, Clegg G,et al:Evaluating arrhythmias in ECG signals using wavelet transforms.IEEE Trans Biomed Eng2000,
19(4):383–392.
14. Inaki R, Grubb NR,et al:T-wave alternans found in preventricular tachyarrhythmias in CCU patients using a wavelet transform-based methodology.IEEE Trans Biomed Eng2008,55(11):2658–2665.
15. Addison PS:Wavelet transforms and the ECG: a review.Physiol Meas2005,
16. Ferdjallah M, Barr RE:Adaptive digital notch filter design on the unit circle for the removal of powerline noise from biomedical signals.
IEEE Trans Biomed Eng1994,41(4):529–536.
17. Wan X, Xu D, Zhang J:Research on ECG de-noising method based on wavelet transform.Chin J Biomed Eng2008,27(4):630–632.
18. Martinez JP, Olmos S, Laguna P:T wave alternans detection: a simulation study and analysis of the European ST-T database.Comput Cardiol2000,
27:155–158.
doi:10.1186/1749-8090-8-7
Cite this article as:Wanet al.:A combined algorithm for T-wave
alternans qualitative detection and quantitative measurement.Journal of
Cardiothoracic Surgery20138:7.
Submit your next manuscript to BioMed Central and take full advantage of:
• Convenient online submission
• Thorough peer review
• No space constraints or color figure charges
• Immediate publication on acceptance
• Inclusion in PubMed, CAS, Scopus and Google Scholar
• Research which is freely available for redistribution